. 2024 Aug 1;25(15):8399.
doi: 10.3390/ijms25158399.

Exploring Intrinsic Disorder in Human Synucleins and Associated Proteins

Affiliations

Exploring Intrinsic Disorder in Human Synucleins and Associated Proteins

Sriya Reddy Venati et al. Int J Mol Sci. .

Abstract

In this work, we explored the intrinsic disorder status of the three members of the synuclein family of proteins-α-, β-, and γ-synucleins-and showed that although all three human synucleins are highly disordered, the highest levels of disorder are observed in γ-synuclein. Our analysis of the peculiarities of the amino acid sequences and modeled 3D structures of the human synuclein family members revealed that the pathological mutations A30P, E46K, H50Q, A53T, and A53E associated with the early onset of Parkinson's disease caused some increase in the local disorder propensity of human α-synuclein. A comparative sequence-based analysis of the synuclein proteins from various evolutionary distant species and evaluation of their levels of intrinsic disorder using a set of commonly used bioinformatics tools revealed that, irrespective of their origin, all members of the synuclein family analyzed in this study were predicted to be highly disordered proteins, indicating that their intrinsically disordered nature represents an evolutionary conserved and therefore functionally important feature. A detailed functional disorder analysis of the proteins in the interactomes of the human synuclein family members utilizing a set of commonly used disorder analysis tools showed that the human α-synuclein interactome has relatively higher levels of intrinsic disorder as compared with the interactomes of human β- and γ- synucleins and revealed that, relative to the β- and γ-synuclein interactomes, α-synuclein interactors are involved in a much broader spectrum of highly diversified functional pathways. Although proteins interacting with three human synucleins were characterized by highly diversified functionalities, this analysis also revealed that the interactors of three human synucleins were involved in three common functional pathways, such as the synaptic vesicle cycle, serotonergic synapse, and retrograde endocannabinoid signaling. Taken together, these observations highlight the critical importance of the intrinsic disorder of human synucleins and their interactors in various neuronal processes.

Keywords: Parkinson’s disease; intrinsically disordered protein; liquid–liquid phase separation; protein–protein interactions; α-synuclein; β-synuclein; γ-synuclein.


Conflict of interest statement

The authors declare no conflicts of interest. The funders had no role in the design of the study; in the collection, analyses, or interpretation of data; in the writing of the manuscript; or in the decision to publish the results.

Figures

Figure A1
Figure A1
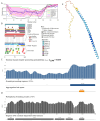
Functional disorder analysis of human Metallothionein-3 (UniProt ID: P25713). (A) Functional disorder profile generated by D2P2. (B) Redox-sensitive disorder profile generated by IUPred2A. (C) 3D structural model generated by AlphaFold. (D) CHMP2B-centered PPI network generated by STRING. This network was generated using medium confidence level of 0.185.
Figure A2
Figure A2
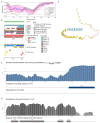
Functional disorder analysis of human CHMP2B (Q9UQN3). (A) Functional disorder profile generated by D2P2. (B) 3D structural model generated by AlphaFold. (C) CHMP2B-centered PPI network generated by STRING. This network was generated using medium confidence level of 0.4.
Figure A3
Figure A3
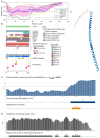
Functional disorder analysis of human neurogranin (UniProt ID: Q92686). (A) Functional disorder profile generated by D2P2. (B) 3D structural model generated by AlphaFold. (C) NRGN-centered PPI network generated by STRING. This network was generated using low confidence of 0.15 for minimum required interaction score.
Figure A4
Figure A4
Functional disorder analysis of human complexin-1 (UniProt ID: O14810). (A) Functional disorder profile generated by D2P2. (B) 3D structural model generated by AlphaFold. (C) CPLX1-centered PPI network generated by STRING. This network was generated using a custom confidence value of 0.225 for minimum required interaction score.
Figure A5
Figure A5
Functional disorder analysis of human complexin-2 (UniProt ID: Q6PUV4). (A) Functional disorder profile generated by D2P2. (B) 3D structural model generated by AlphaFold. (C) CPLX2-centered PPI network generated by STRING. This network was generated using a custom confidence value of 0.225 for minimum required interaction score.
Figure A6
Figure A6
Functional disorder analysis of human NUCKS1 (UniProt ID: Q9H1E3). (A) Functional disorder profile generated by D2P2. (B) 3D structural model generated by AlphaFold. (C) NUCKS1-centered PPI network generated by STRING. This network was generated using a custom confidence value of 0.200 for minimum required interaction score.
Figure A7
Figure A7
Functional disorder analysis of human MBP (UniProt ID: P02686). (A) Functional disorder profile generated by D2P2. (B) 3D structural model generated by AlphaFold. (C) MBP-centered PPI network generated by STRING. This network was generated using a custom confidence value of 0.300 for minimum required interaction score.
Figure A8
Figure A8
Functional disorder analysis of human Calpastatin (UniProt ID: P20810). (A) Functional disorder profile generated by D2P2. (B) 3D structural model generated by AlphaFold. (C) CAST-centered PPI network generated by STRING. This network was generated using a custom confidence value of 0.200 for minimum required interaction score.
Figure A9
Figure A9
Functional disorder analysis of human MAPT (UniProt ID: P10636). (A) Functional disorder profile generated by D2P2. (B) 3D structural model generated by AlphaFold. (C) MAPT-centered PPI network generated by STRING. This network was generated using a custom confidence value of 0.500 for minimum required interaction score.
Figure A10
Figure A10
Functional disorder analysis of human hemogen (UniProt ID: Q9BXL5). (A) Functional disorder profile generated by D2P2. (B) 3D structural model generated by AlphaFold. (C) HEMGN-centered PPI network generated by STRING. This network was generated using a low confidence of 0.150 for minimum required interaction score.
Figure A11
Figure A11
Functional disorder analysis of human Histone H1.2 (UniProt ID: P16403). (A) Functional disorder profile generated by D2P2. (B) 3D structural model generated by AlphaFold. (C) H1.2-centered PPI network generated by STRING. This network was generated using a custom confidence value of 0.250 for minimum required interaction score.
Figure A12
Figure A12
Structural and functional characterization of human prolyl endopeptidase (UniProt ID: P48147). (A) Intrinsic disorder profile generated by RIDAO. (B) FuzDrop output. (C) PREP-centered PPI network generated by STRING. This network was generated using the custom confidence value of 0.400 for the minimum required interaction score. (D) X-ray crystal structure of human prolyl endopeptidase (PDB ID: 3DDU).
Figure A13
Figure A13
Structural and functional characterization of human lactadherin (UniProt ID: Q08431). (A) Intrinsic disorder profile generated by RIDAO. (B) FuzDrop output. (C) Lactadherin-centered PPI network generated by STRING. This network was generated using the custom confidence value of 0.400 for the minimum required interaction score. (D) A 3D structural model generated by AlphaFold.
Figure A14
Figure A14
Structural and functional characterization of human SAP (UniProt ID: P02743). (A) Intrinsic disorder profile generated by RIDAO. (B) FuzDrop output. (C) SAP-centered PPI network generated by STRING. This network was generated using the custom confidence value of 0.400 for the minimum required interaction score. (D) X-ray crystal structure of the pentameric human serum amyloid P-component (PDB ID: 4AVS).
Figure A15
Figure A15
Structural and functional characterization of human cholinesterase (UniProt ID: P06276). (A) Intrinsic disorder profile generated by RIDAO. (B) FuzDrop output. (C) Cholinesterase-centered PPI network generated by STRING. This network was generated using the custom confidence value of 0.400 for the minimum required interaction score. (D) X-ray crystal structure of human cholinesterase (PDB ID: 1P0I).
Figure A16
Figure A16
Structural and functional characterization of human NADH-ubiquinone oxidoreductase chain 4 (MT-ND4, UniProt ID: P03905). (A) Intrinsic disorder profile generated by RIDAO. (B) FuzDrop output. (C) MT-ND4-centered PPI network generated by STRING. This network was generated using the custom confidence value of 0.400 for the minimum required interaction score. (D) 3D structural model generated by AlphaFold.
Figure 1
Figure 1
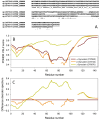
Comparison of amino acid sequences of human α-, β-, and γ-synucleins. (A) Multiple sequence alignment conducted by Clustal Omega using default parameters. An asterisk (*) indicates positions which have a single, fully conserved residue. A colon (:) indicates conservation between groups of strongly similar properties and shows that some sequences in a column have different amino acids, but the amino acids have similar chemical properties. A period (.) indicates conservation between groups of weakly similar properties. A dash (-) indicates a gap in the alignment. (B) Per-residue disorder profiles of human α-, β-, and γ-synucleins generated by PONDR® VSL2. To better represent the peculiarities of the per-residue intrinsic disorder propensity distribution, the scale of Y–axis is extended to cover PONDR® VSL2 scores from 0.34 to 1.0. (C) Difference disorder spectra calculated by subtracting profiles of β- and γ-synucleins from the profiles of human α-synuclein.
Figure 2
Figure 2
Functional disorder analysis of human α-synuclein (UniProt ID: P37840). (A), Multiparametric disorder analysis of the protein using RIDAO. The outputs of PONDR® VLXT, PONDR® VSL2, PONDR® VL3, PONDR® FIT, IUPred long, and IUPred short are shown by black, red, green, pink, blue, and yellow lines, respectively. Mean disorder profile (or mean disorder prediction, MDP), calculated as an average of outputs of these six predictors, is shown by dashed dark pink line, whereas error distribution is shown as light pink shadow. In this per-residue disorder analysis, a disorder score was assigned to each residue. A residue with disorder score equal to or above 0.5 is considered disordered, and a residue with disorder score below 0.5 is predicted to be ordered. Residues/regions with disorder scores between 0.15 and 0.5 were considered ordered but flexible. The corresponding thresholds are shown by solid (0.5) and long-dashed lines (0.15). (B) Functional disorder profile generated for α-synuclein by the D2P2 database showing the outputs of several disorder predictors such as VLXT, VSL2b, PrDOS, IUPred, and Espritz. The colored bar highlighted by blue and green shades represents the disorder prediction; yellow zigzagged bars show positions of MoRFs, whereas colored circles at the bottom of the plot show the positions of predicted PTMs, such as phosphorylation (red circles marked P), sumoylation (green circles marked S), acetylation (yellow circles marked A), glycosylation (orange circles marked G), and ubiquitylation (violet circles marked U). (C) The FuzDrop-generated plot shows the sequence distribution of the residue-based droplet-promoting probabilities, pDP, for human α-synuclein. (D) The FuzDrop-generated plot of the multiplicity of binding modes shows positions of regions that can sample multiple binding modes in a cellular context (sub-cellular localization, partners, posttranslational modifications)-dependent manner. (E) 3D structural model as predicted by AlphaFold. The structure is colored according to the per-residue model confidence score (pLDDT) ranging from orange to blue, where fragments of structure with very high (pLDDT > 90), confident (90 > pLDDT > 70), low (70 > pLDDT > 50), and very low (pLDDT < 50) pLDDT scores are shown by blue, cyan, yellow, and orange colors, respectively.
Figure 3
Figure 3
Functional disorder analysis of human β-synuclein (UniProt ID: Q16143). (A), Multiparametric disorder analysis of the protein using RIDAO. (B) Functional disorder profile generated for human β-synuclein by the D2P2 database. Colored circles at the bottom of the plot show the localization of PTMs, such as phosphorylation (red circles marked P) and acetylation (yellow circles marked A). (C) The FuzDrop-generated plot shows the sequence distribution of the residue-based droplet-promoting probabilities, pDP. (D) The FuzDrop-generated plot of the multiplicity of binding modes. (E) A 3D structural model is predicted by AlphaFold.
Figure 4
Figure 4
Functional disorder analysis of human γ-synuclein (UniProt ID: O76070). (A), Multiparametric disorder analysis of the protein using RIDAO. (B) Functional disorder profile generated for human γ-synuclein by the D2P2 database. Colored circles at the bottom of the plot show the localization of PTMs, such as phosphorylation (red circles marked P) and acetylation (yellow circles marked A). (C) The FuzDrop-generated plot shows the sequence distribution of the residue-based droplet-promoting probabilities, pDP. (D) The FuzDrop-generated plot of the multiplicity of binding modes. (E) A 3D structural model is predicted through AlphaFold.
Figure 5
Figure 5
(A) Protein–protein interaction network of human α-synuclein (UniProt ID: P37840) (A), β-synuclein (UniProt ID: Q16143) (B), and human γ-synuclein (UniProt ID: O76070) (C). These PPI networks were generated by STRING using the minimum required interaction score of 0.5 (α-synuclein) or 0.4 (medium confidence, β- and γ-synucleins) and adjusting the value of the maximum number of interactors in the first shell to 500. Network nodes represent individual proteins, and edges represent protein–protein interaction for shared function, with different types of interactions; the blue line represents curated databases, black line represents co-expression, and green line represents gene neighborhoods. Access to the interactive PPI maps for α-, β-, and γ-synucleins can be found on the STRING webpage via the following URLs: https://string-db.org/cgi/network?taskId=bTG0CScAf8Wp&sessionId=bcRTSNZudCtN (accessed on 5 May 2024); https://string-db.org/cgi/network?taskId=bvfk903ldEwq&sessionId=bcRTSNZudCtN (accessed on 5 May 2024), and https://string-db.org/cgi/network?taskId=brXAj9n6xxUM&sessionId=bcRTSNZudCtN (accessed on 5 May 2024).
Figure 6
Figure 6
Comparison of the functional enrichments of the interactomes of human synucleins in terms of the abundance of the corresponding proteins in various KEGG pathways. Strength corresponds to Log10(observed/expected), a measure describing the scale of the enrichment effect. The ratio considered here is between the number of proteins in the given STRING-generated network that are annotated with a given term and the number of proteins that are expected to be annotated with this term in a random network of the same size.
Figure 7
Figure 7
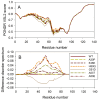
Effect of the missense point mutations associated with the familial cases of PD (A30P, E46K, H50Q, G51D, A53T, and A53E) on the intrinsic disorder propensity of human α-synuclein. (A) Per-residue disorder profiles generated by PONDR® VSL2. (B) Difference disorder spectra calculated by subtracting mutant profiles from those of the wild type protein.
Figure 8
Figure 8
Effect of the missense point mutations associated with the familial cases of PD (A30P, E46K, H50Q, G51D, A53T, and A53E) on intrinsic disorder propensity of human α-synuclein. (A) Per-residue droplet-promoting probabilities (pDP) evaluated by FuzDrop. (B) Difference pDP spectra calculated by subtracting mutant profiles from those of the wild type protein.
Figure 9
Figure 9
Global disorder analysis of 381 α- synucleins, 320 β- synucleins, and 234 γ-synucleins from different species in the form of the PONDR® VSL2 score vs. PONDR® VSL2 (%) plot. Here, each point corresponds to a query protein, coordinates of which are evaluated from the corresponding PONDR® VSL2 data as its ADS and PPIDR. Color blocks are used to visualize proteins based on the accepted classification, with red, pink/light pink, and blue/light blue regions containing highly disordered, moderately disordered, and ordered proteins, respectively (see the text). Dark blue or pink regions correspond to the regions where PPIDR agrees with ADS, whereas areas in which only one of these criteria applies are shown by light blue or light pink.
Figure 10
Figure 10
Multiple sequence alignments of α- (A), β- (B), and γ-synucleins (C) conducted by Clustal Omega using default parameters.
Figure 11
Figure 11
Conservation of the peculiarities of the per-residue intrinsic disorder propensity among the members of synuclein family. Disorder profiles were generated for α- (A), β- (B), and γ-synucleins (C) by PONDR® VSL2.
Figure 12
Figure 12
STRING-generated PPI network centered at human α-, β-, and γ-synucleins.
Figure 13
Figure 13
Evaluation of the global disorder status of 10,611 proteins from the human brain proteome (gray circles), as well as the interactomes of individual human synucleins and the global interactome centered at the three synucleins, with corresponding data shown by differently colored circles. (A) PONDR® VSL2 score vs. PONDR® VSL2 (%) plot. Here, each point corresponds to a query protein coordinate, which is evaluated from the corresponding PONDR® VSL2 data as its average disorder score (ADS) and percent of the predicted intrinsically disordered residues (PPIDR). Color blocks are used to visualize proteins based on the accepted classification, with red, pink/light pink, and blue/light blue regions containing highly disordered, moderately disordered, and ordered proteins, respectively (see the text). Dark blue or pink regions correspond to the regions where PPIDR agrees with ADS, whereas areas in which only one of these criteria applies are shown by light blue or light pink. (B) CH-CDF plot, where the coordinates for a query protein are calculated as the average distance of its CDF curve from the CDF boundary (X axis) and its distance from the CH boundary. Protein classification is based on the quadrant where it is located: Q1, protein predicted to be ordered by both predictors. Q2, protein predicted to be ordered by CH-plot and disordered by CDF. Q3, protein predicted to be disordered by both predictors. Q4, protein predicted to be disordered by CH-plot and ordered by CDF.
Figure 14
Figure 14
Correlation between the number of interactions and intrinsic disorder level of human proteins in the joint α-β-γ synuclein interactome. A vertical solid line represents the average node degree of this network (which is 45.8). Two verical solid lines represent two disorder boundaries of 15% and 30%.
Figure 15
Figure 15
A correlation between the overall disorder status (PONDR® VSL2, %), interactability (node degree), and LLPS predisposition (pLLPS) of 467 human proteins in the joint α-β-γ synuclein interactome.

Similar articles

  • Localization of synucleins in the mammalian cochlea.
    Akil O, Weber CM, Park SN, Ninkina N, Buchman V, Lustig LR. Akil O, et al. J Assoc Res Otolaryngol. 2008 Dec;9(4):452-63. doi: 10.1007/s10162-008-0134-y. Epub 2008 Jul 30. J Assoc Res Otolaryngol. 2008. PMID: 18665422 Free PMC article.
  • Molecular ageing of alpha- and Beta-synucleins: protein damage and repair mechanisms.
    Vigneswara V, Cass S, Wayne D, Bolt EL, Ray DE, Carter WG. Vigneswara V, et al. PLoS One. 2013 Apr 22;8(4):e61442. doi: 10.1371/journal.pone.0061442. Print 2013. PLoS One. 2013. PMID: 23630590 Free PMC article.
  • Monomeric synucleins generate membrane curvature.
    Westphal CH, Chandra SS. Westphal CH, et al. J Biol Chem. 2013 Jan 18;288(3):1829-40. doi: 10.1074/jbc.M112.418871. Epub 2012 Nov 26. J Biol Chem. 2013. PMID: 23184946 Free PMC article.
  • Fish Synucleins: An Update.
    Toni M, Cioni C. Toni M, et al. Mar Drugs. 2015 Oct 30;13(11):6665-86. doi: 10.3390/md13116665. Mar Drugs. 2015. PMID: 26528989 Free PMC article. Review.
  • The synucleins.
    George JM. George JM. Genome Biol. 2002;3(1):REVIEWS3002. doi: 10.1186/gb-2001-3-1-reviews3002. Epub 2001 Dec 20. Genome Biol. 2002. PMID: 11806835 Free PMC article. Review.

References

    1. Uversky V.N. Looking at the recent advances in understanding alpha-synuclein and its aggregation through the proteoform prism. F1000Research. 2017;6:525. doi: 10.12688/f1000research.10536.1. - DOI - PMC - PubMed
    1. Stefanis L. α-Synuclein in Parkinson’s disease. Cold Spring Harb. Perspect. Med. 2012;2:a009399. doi: 10.1101/cshperspect.a009399. - DOI - PMC - PubMed
    1. Weinreb P.H., Zhen W., Poon A.W., Conway K.A., Lansbury P.T., Jr. NACP, a protein implicated in Alzheimer’s disease and learning, is natively unfolded. Biochemistry. 1996;35:13709–13715. doi: 10.1021/bi961799n. - DOI - PubMed
    1. Uversky V.N., Li J., Fink A.L. Evidence for a partially folded intermediate in alpha-synuclein fibril formation. J. Biol. Chem. 2001;276:10737–10744. doi: 10.1074/jbc.M010907200. - DOI - PubMed
    1. Eliezer D., Kutluay E., Bussell R., Jr., Browne G. Conformational properties of α-synuclein in its free and lipid-associated states. J. Mol. Biol. 2001;307:1061–1073. doi: 10.1006/jmbi.2001.4538. - DOI - PubMed

MeSH terms

Grants and funding

This research received no external funding.

LinkOut - more resources