. 2024 Jul 25;29(15):3476.
doi: 10.3390/molecules29153476.

Insights into the Gene Expression Profile of Classical Hodgkin Lymphoma: A Study towards Discovery of Novel Therapeutic Targets

Affiliations

Insights into the Gene Expression Profile of Classical Hodgkin Lymphoma: A Study towards Discovery of Novel Therapeutic Targets

Abdulaziz A Aloliqi. Molecules. .

Abstract

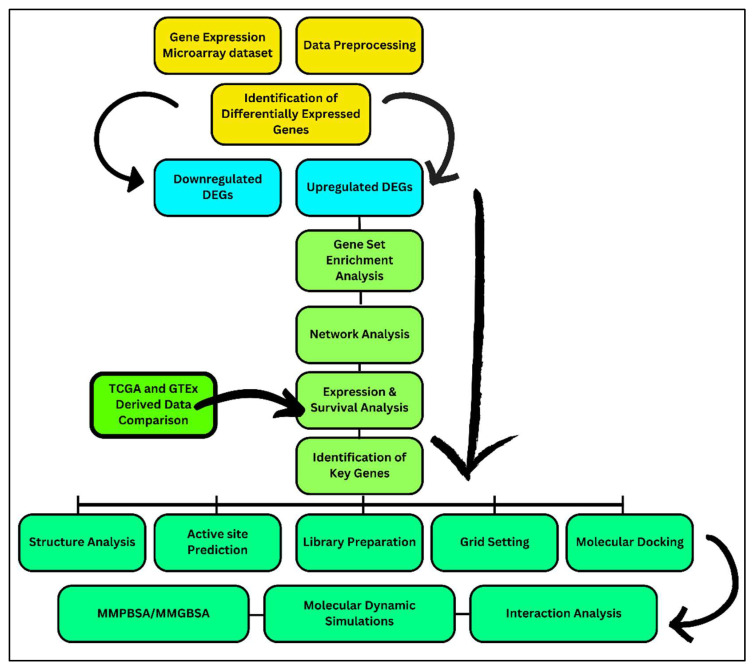
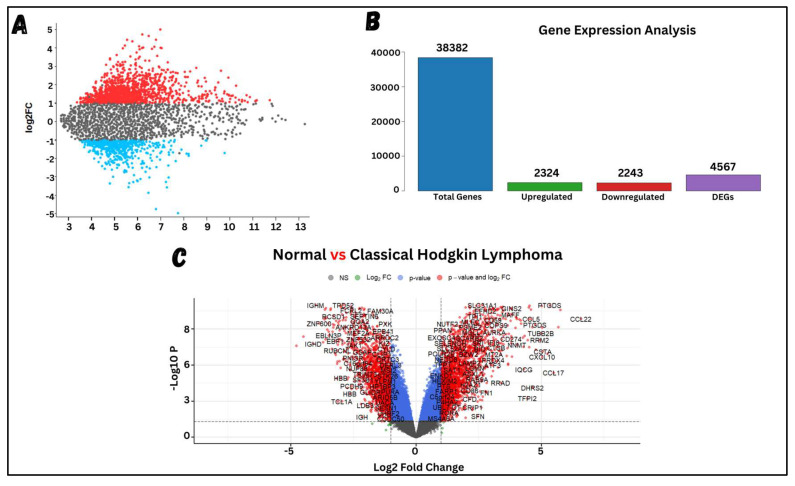
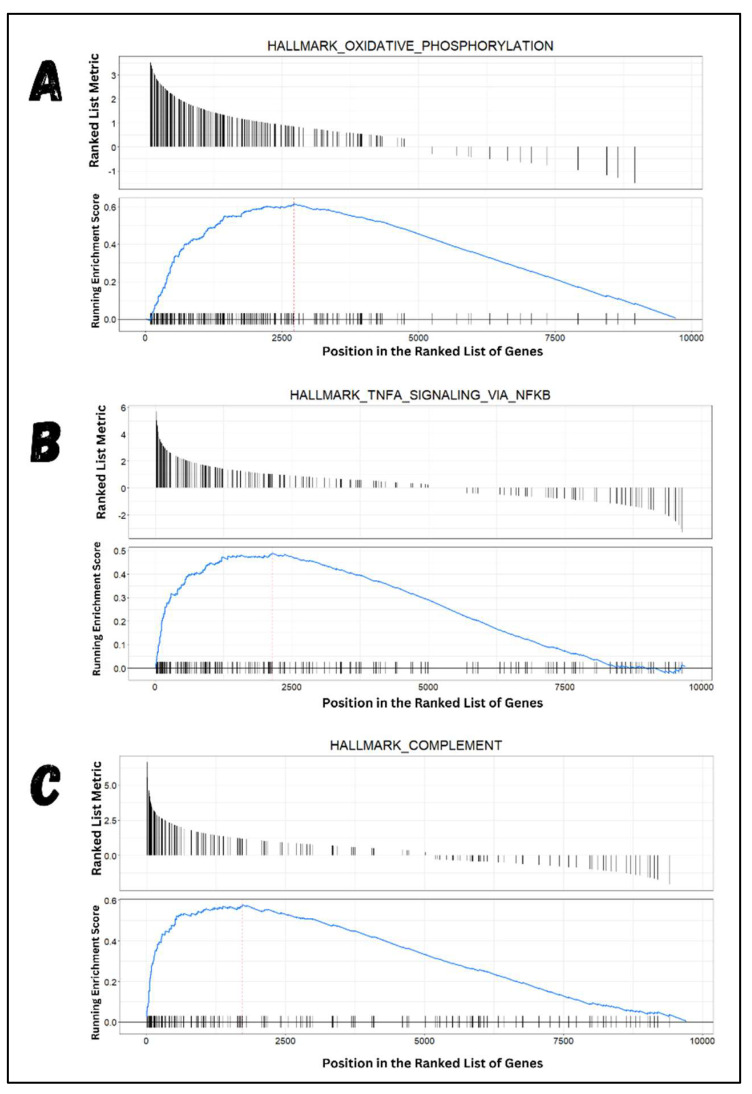
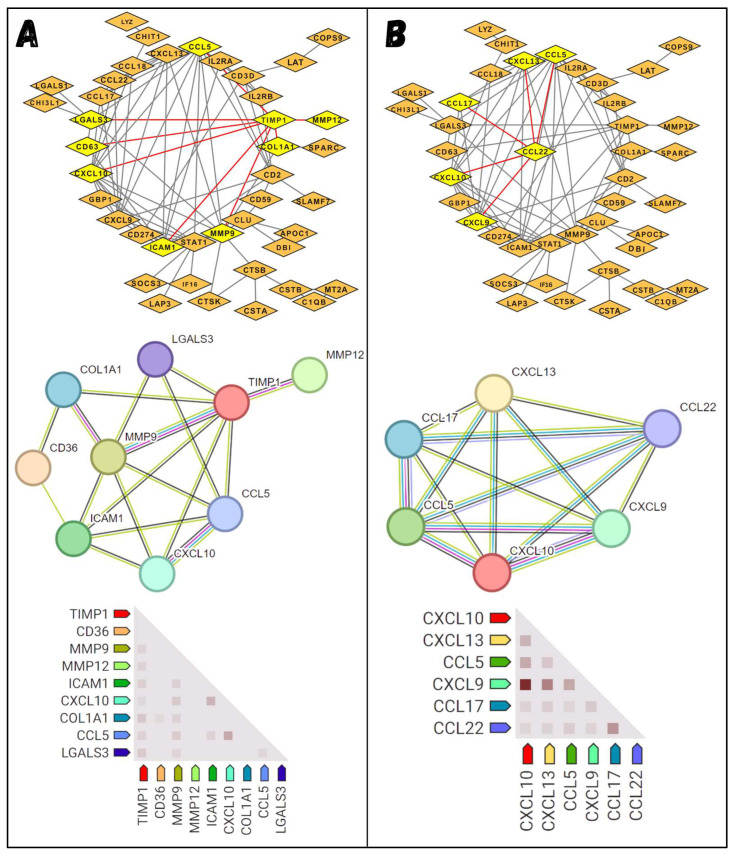
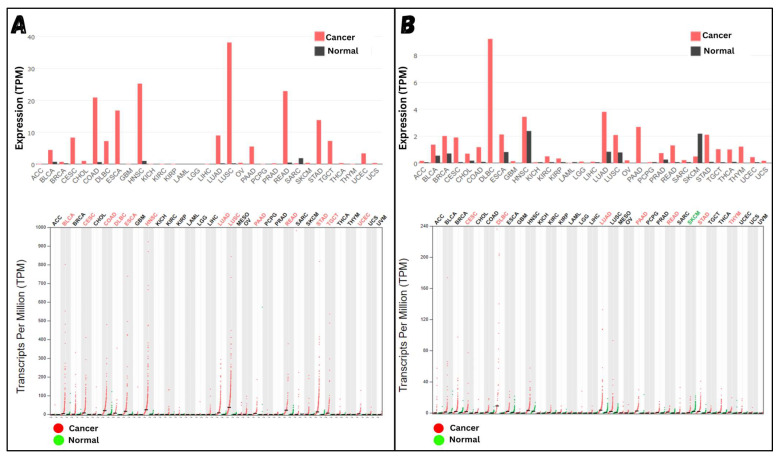
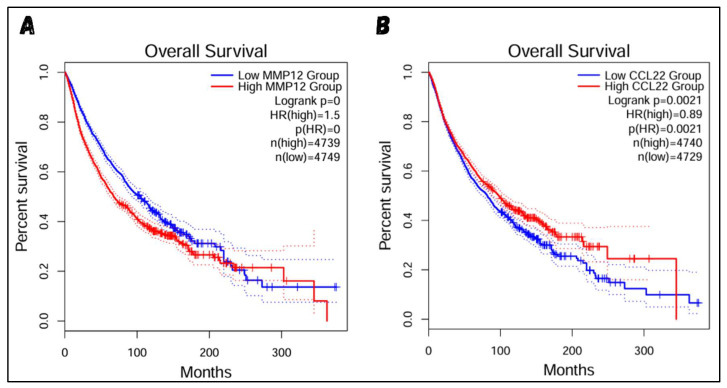
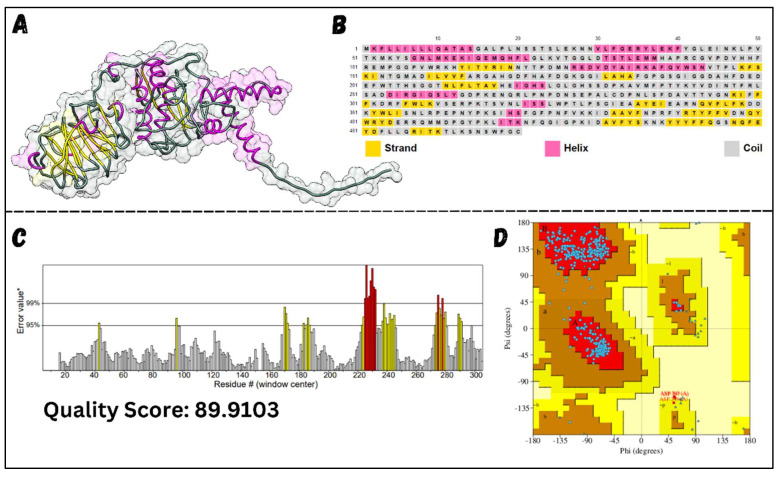
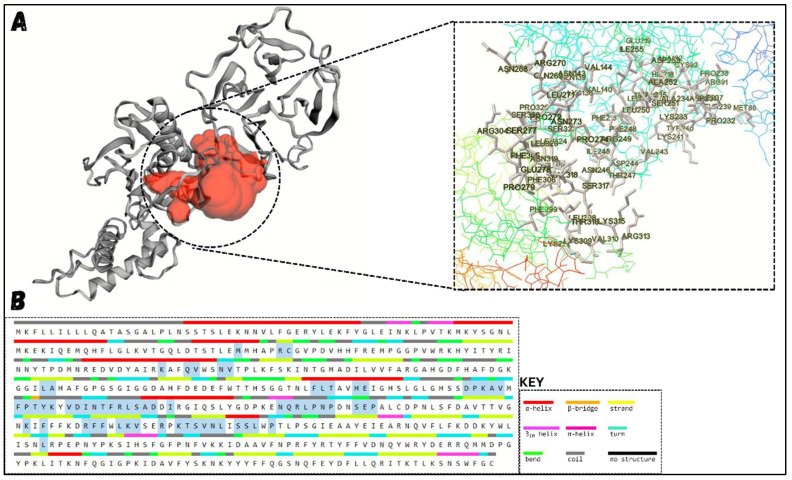
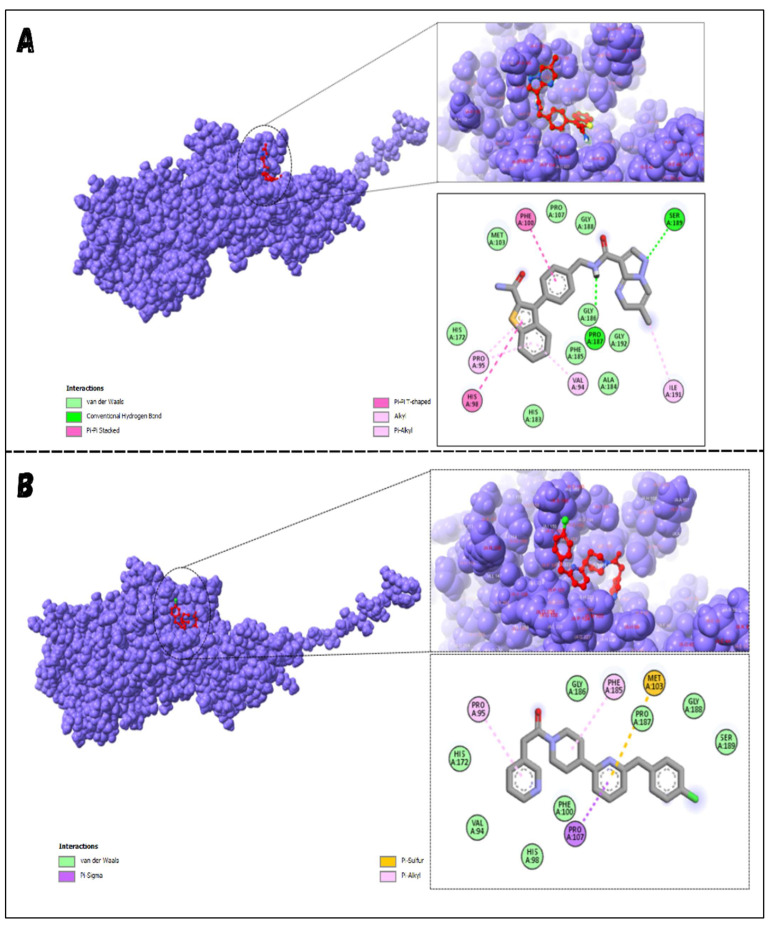
Classical Hodgkin lymphoma (cHL) is a common B-cell cancer and a significant health concern, especially in Western and Asian countries. Despite the effectiveness of chemotherapy, many relapse cases are being reported, highlighting the need for improved treatments. This study aimed to address this issue by discovering biomarkers through the analysis of gene expression data specific to cHL. Additionally, potential anticancer inhibitors were explored to target the discovered biomarkers. This study proceeded by retrieving microarray gene expression data from cHL patients, which was then analyzed to identify significant differentially expressed genes (DEGs). Functional and network annotation of the upregulated genes revealed the active involvement of matrix metallopeptidase 12 (MMP12) and C-C motif metallopeptidase ligand 22 (CCL22) genes in the progression of cHL. Additionally, the mentioned genes were found to be actively involved in cancer-related pathways, i.e., oxidative phosphorylation, complement pathway, myc_targets_v1 pathway, TNFA signaling via NFKB, etc., and showed strong associations with other genes known to promote cancer progression. MMP12, topping the list with a logFC value of +6.6378, was selected for inhibition using docking and simulation strategies. The known anticancer compounds were docked into the active site of the MMP12 molecular structure, revealing significant binding scores of -7.7 kcal/mol and -7.6 kcal/mol for BDC_24037121 and BDC_27854277, respectively. Simulation studies of the docked complexes further supported the effective binding of the ligands, yielding MMGBSA and MMPBSA scores of -78.08 kcal/mol and -82.05 kcal/mol for MMP12-BDC_24037121 and -48.79 kcal/mol and -49.67 kcal/mol for MMP12-BDC_27854277, respectively. Our findings highlight the active role of MMP12 in the progression of cHL, with known compounds effectively inhibiting its function and potentially halting the advancement of cHL. Further exploration of downregulated genes is warranted, as associated genes may play a role in cHL. Additionally, CCL22 should be considered for further investigation due to its significant role in the progression of cHL.

Keywords: cancer therapy; classical Hodgkin lymphoma; docking; drug target; gene expression; microarray data analysis; simulations.


Conflict of interest statement

The author declares no conflicts of interest.

Figures

Figure 1
Figure 1
Research workflow. This study commenced with the retrieval of gene expression microarray datasets related to cHL and healthy individuals. The data were preprocessed using various statistical tools to obtain the most significant gene expression values. Differentially expressed genes were identified, revealing sets of upregulated and downregulated genes in cHL. Further analysis of the upregulated genes was conducted with respect to their involvement in different pathways using GSEA analysis. Additionally, network analysis was performed on the upregulated genes to identify deep connections among them. Significant interactions were found between the top two upregulated genes, highlighting their effective role in cHL. This hypothesis was validated by further exploring the roles of key genes using reference databases. The analysis identified key genes with significant roles in the progression of cHL. Subsequently, structural analyses were performed, where the three-dimensional protein structure of the target gene was retrieved, minimized, and evaluated for stability. The active site was predicted, and its coordinates were calculated for the grid box setting. Ligands were retrieved and minimized for the docking protocol. Both the ligands and the protein were selected for docking, and the binding potentials were calculated, followed by interaction analysis between the docked entities. Finally, simulations were conducted on the docked complexes to evaluate their behavior, respectively.
Figure 2
Figure 2
Visualizing processed data. (A) shows the boxplot of each sample, where all the samples have almost the same median, indicating the high quality of the data. This plot was generated using ggplot2 R-package v4.4.1. (B) shows a heatmap using Pheatmap R-package based on the normalized expression values of each sample, indicating correlations between them. Two clusters are visualized in the heatmap, showing that samples of the same phenotypes are closely correlated. (C) shows a PCA plot of the samples generated by ggplot2 R-package, where the classification of both phenotypes is observed, indicating significant expression differences. (D) shows a histogram of the median expression values across samples, with a threshold of 2 (red line) to ensure that only expression values greater than 2 are chosen.
Figure 3
Figure 3
Visualization of significant DEGs. (A) shows an MA-plot where the average value of each gene is on the X-axis and logFC values on the Y-axis. The gray dots represent genes with logFC values below the threshold, i.e., (−1 ≤ logFC ≤ +1), while the red and blue dots represent genes with logFC values above the threshold, identified as DEGs. (B) shows the total number of genes and the final number of DEGs. (C) presents a volcano plot where non-significant genes are shown as gray dots, genes that are significant but do not meet the logFC threshold as blue dots, and significant genes that meet the logFC threshold as red dots.
Figure 4
Figure 4
Top 3 GSEA pathways. Most of the top-regulated genes were associated with the mentioned pathways. As shown in (AC), the ranked metric list denotes the ranked list provided as input, compared with the running enrichment score. Each image shows positive running enrichment scores, indicated by the running blue curve remaining high when it follows the upregulated genes across the ranked list and dropping gradually when downregulated genes were scanned on the row.
Figure 5
Figure 5
Interaction analysis. (A) shows the closest association of multiple genes with MMP12. MMP12 is highly associated with TIMP1 (the more interactive the colored lines, the stronger the interaction), which further interacts closely with other genes. The heatmap illustrates the coexpression and interdependence of different genes, where darker points in the heatmap indicate stronger coexpression relationships. (B) similarly depicts the close interactive genes associated with CCL22, along with the extent of their associations and coexpression.
Figure 6
Figure 6
Reference Analysis: (A) shows the expression level of MMP12 in different malignancies. Out of a total of 31 malignancies, 13 show a reasonably high expression of MMP12. The accompanying dot plot also displays the expression levels, taking into account the reported number of individuals included in the case and control groups. (B) demonstrates similar results for CCL22, where high expression is reported in 17 malignancies.
Figure 7
Figure 7
Survival Analysis: (A) shows the survival analysis of MMP12 and (B) CCL22. In both graphs, the blue slope represents the survival rate of individuals with low gene expression, while the red slope represents the survival rate of individuals with high gene expression. Survival analysis is performed on thousands of built-in reference datasets. If the majority of samples have a similar correlation with the query gene, they will be represented by bold lines (blue and red). Samples with slightly different correlations will be represented by dotted lines (blue and red).
Figure 8
Figure 8
MMP12 Structure Assessment. (A) shows the three-dimensional structure of the protein, clearly highlighting helices, coils, and strands. (B) identifies the amino acids involved in forming helices, strands, and coils. (C) shows the ERRAT plot, demonstrating the stability of MMP12, with the majority of amino acids within the acceptable range. Although a few amino acids exceed the stability threshold (red), the overall ERRAT score remains acceptable. Yellow regions are those with 95% confidence of rejection (D) presents the Ramachandran plot, with most amino acids (blue dots) located in the most favored region (red), while two residues are in the disallowed region (pale yellow). Further details about the Ramachandran plot coloring and labelling can be found at https://doi.org/10.1002/pro.3289.
Figure 9
Figure 9
Predicted Active Site of MMP12. (A) shows the region of the active site in MMP12 (red) and its associated residues, while (B) represents the arranged residues involved in the active site (red) along with the overall secondary structure summary of the protein.
Figure 10
Figure 10
Setting the Grid Box. (A) shows the overall grid box covering the entire active site, while (B) visualizes the magnified transparent grid box and the involved residues of the active site.
Figure 11
Figure 11
Docking Results. (A) shows the best binding pose of BDC_24037121 (red) into the active site of MMP12, with 16 interactions as indicated in the provided key. (B) shows the binding interactions of BDC_27854277 (red) with MMP12, totaling 12 interactions, making it the second-best ligand to be considered.
Figure 12
Figure 12
Simulations Results. (A) RMSD plot of MMP12 with BDC_24037121 and BDC_27854277 illustrates the stability of the complexes over time. (B) Residual fluctuations plot of MMP12 and the ligands after interactions show the dynamic behavior of the residues involved. (C) The linearly stable curve of the radius of gyration of docked complexes demonstrates the compactness and stability of the complexes. (D) SASA plot for the docked protein complex indicates changes in the solvent-accessible surface area, suggesting alterations in protein compaction due to ligand binding.

Similar articles

References

    1. Achkova D. Development of Immunotherapy for Classical Hodgkin’s Lymphoma and Anaplastic Large Cell Lymphoma Using Colony-Stimulating Factor-1 Receptor Re-Targeted T-Lymphocytes. Guy’s, King’s and St. Thomas’s School of Medicine; London, UK: 2016.
    1. Huang X., Nolte I., Gao Z., Vos H., Hepkema B., Poppema S., van den Berg A., Diepstra A. Epidemiology of Classical Hodgkin Lymphoma and Its Association with Epstein Barr Virus in Northern China. PLoS ONE. 2011;6:e21152. doi: 10.1371/journal.pone.0021152. - DOI - PMC - PubMed
    1. Liu D. Tumors and Cancers. CRC Press; Boca Raton, FL, USA: 2017. Hodgkin Lymphoma; pp. 171–176.
    1. Gao J., Chen Y., Wu P., Wang F., Tao H., Shen Q., Wang S., Gong S., Zhang X., Zhou Z., et al. Causes of Death and Effect of Non-Cancer-Specific Death on Rates of Overall Survival in Adult Classic Hodgkin Lymphoma: A Populated-Based Competing Risk Analysis. BMC Cancer. 2021;21:955. doi: 10.1186/s12885-021-08683-x. - DOI - PMC - PubMed
    1. Gupta S., Craig J.W. Classic Hodgkin Lymphoma in Young People. Semin. Diagn. Pathol. 2023;40:379–391. doi: 10.1053/j.semdp.2023.06.005. - DOI - PubMed

MeSH terms

LinkOut - more resources