. 2024 Aug 9;15(1):6830.
doi: 10.1038/s41467-024-51242-8.

PD-L1 deglycosylation promotes its nuclear translocation and accelerates DNA double-strand-break repair in cancer

Affiliations

PD-L1 deglycosylation promotes its nuclear translocation and accelerates DNA double-strand-break repair in cancer

Zhen Shu et al. Nat Commun. .

Abstract

Resistance to radiotherapy is a major barrier during cancer treatment. Here using genome-scale CRISPR/Cas9 screening, we identify CD274 gene, which encodes PD-L1, to confer lung cancer cell resistance to ionizing radiation (IR). Depletion of endogenous PD-L1 delays the repair of IR-induced DNA double-strand breaks (DSBs) and PD-L1 loss downregulates non-homologous end joining (NHEJ) while overexpression of PD-L1 upregulates NHEJ. IR induces translocation of PD-L1 from the membrane into nucleus dependent on deglycosylation of PD-L1 at N219 and CMTM6 and leads to PD-L1 recruitment to DSBs foci. PD-L1 interacts with Ku in the nucleus and enhances Ku binding to DSB DNA. The interaction between the IgC domain of PD-L1 and the core domain of Ku is required for PD-L1 to accelerate NHEJ-mediated DSB repair and produce radioresistance. Thus, PD-L1, in addition to its immune inhibitory activity, acts as mechanistic driver for NHEJ-mediated DSB repair in cancer.


Conflict of interest statement

The authors declare no competing interests.

Figures

Fig. 1
Fig. 1. Genome-scale CRISPR/Cas9 screen identifies IR resistance genes.
a Schematic illustration of the CRISPR/Cas9 loss-of-function screen in human lung cancer H460 cells. b Volcano plot showing both negatively (left) and positively (right) selected genes at day 7 after radiation treatment (4 Gy). CD274 gene that encodes PD-L1 is highlighted in green. c Negative selection of CRISPR screen data ranked based on RRE method. d Differentially selected sgRNAs from (b) were subject to a functional enrichment analysis using over-representation test (ORT) as implemented in MAGeCKFlute.
Fig. 2
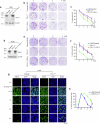
Fig. 2. Depletion of endogenous PD-L1 enhances radiosensitivity by retardation of DSB repair.
a Endogenous PD-L1 was knocked out from H460 cells using the CRISPR/Cas9 system. PD-L1 was rescued by transfection with exogenous WT PD-L1. PD-L1 expression levels were analyzed by western blot. b, c H460 parental, H460 PD-L1 knockout cells and H460 PD-L1 knockout cells expressing exogenous WT PD-L1 were treated with increasing doses of IR, followed by colony formation analysis. Error bars represent ± s.d., n = 3 per group. ***P < 0.001, ****P < 0.0001, by two-tailed t test. d Endogenous PD-L1 was knocked out from H358 cells. PD-L1 was rescued by transfection with exogenous WT PD-L1. PD-L1 expression levels were analyzed by western blot. e, f H358 parental, H358 PD-L1 knockout cells and H358 PD-L1 knockout cells expressing exogenous WT PD-L1 were treated with increasing doses of IR, followed by colony formation analysis. Error bars represent ± s.d., n = 3 per group. ***P < 0.001, by two-tailed t test. g, h H460 parental and PD-L1 knockout H460 cells were treated with 4 Gy of IR at 2 Gy/min dose rate, followed by immunofluorescence analysis of γH2AX foci and DAPI at various time points. Foci ≥5/cell were counted as foci-positive cells. Error bars represent ± s.d., n = 3 per group. ***P < 0.001, by two-tailed t test. Source data are provided as a Source Data file.
Fig. 3
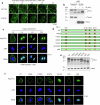
Fig. 3. Radiation induces PD-L1 nuclear localization through deglycosylation.
a H460 cells expressing GFP-tagged PD-L1 were treated with 4 Gy of IR at 2 Gy/min dose rate, followed by time-lapse imaging of GFP-PD-L1 in living cells. The pictures were captured every 5 min. b H460 cells were treated with 4 Gy of IR at 2 Gy/min dose rate, followed by isolation of cytoplasmic and nuclear fractions. PD-L1 was analyzed by western blot. α-Tubulin or PCNA was used as cytoplasmic or nuclear marker, respectively. **PD-L1: glycosylated form, *PD-L1: nonglycosylated form. c H460 cells expressing Flag-tagged PD-L1 were treated with glycosylation inhibitor tunicamycin (5 µg/ml) for various times, followed by immunofluorescence staining with anti-Flag antibody. d Schematic representation of the N → Q mutation at single- or multi-glycosylation site(s) in PD-L1. e, f Flag-tagged WT and various PD-L1 mutants were transfected into H460 cells, followed by western blot or immunofluorescence staining using anti-Flag antibody. **PD-L1: glycosylated form, *PD-L1: nonglycosylated form. Source data are provided as a Source Data file.
Fig. 4
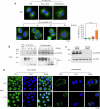
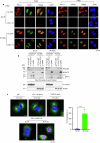
Fig. 4. CMTM6 directly interacts with and transports PD-L1 into the nucleus.
a PD-L1/CMTM6 interactions were analyzed by PLA at various times following IR exposure in H460 cells. PLA signals were detected by fluorescence microscopy as discrete spots. IgG, single PD-L1 antibody alone or single CMTM6 antibody alone was used as negative control. After PLA, immunofluorescence staining using α-tubulin antibody was performed as phase contrast imaging. Error bars represent ± s.d., n = 10 per group. ****P < 0.0001, by two-tailed t test. b PD-L1/CMTM6 interactions were analyzed by co-IP using PD-L1 antibody following IR exposure in H460 cells. **PD-L1: glycosylated form, *PD-L1: nonglycosylated form. c Ctrl siRNA or CMTM6 siRNA was transfected into H460 cells, followed by western blot using CMTM6 antibody. d H460 cells expressing Ctrl siRNA or CMTM6 siRNA were treated with IR (4 Gy), followed by immunofluorescence staining with PD-L1 antibody. Source data are provided as a Source Data file.
Fig. 5
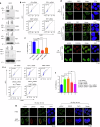
Fig. 5. Depletion of PD-L1 by RNAi reduces NHEJ activity and enhances HR activity.
a H460 cells were transfected with Ctrl siRNA, PD-L1 siRNA, 53BP1 siRNA, RIF1 siRNA or BRCA1 siRNA, followed by western blot. b, c NHEJ activity was analyzed by FACS using BDTM FACSCanto II in H460 cells expressing Ctrl siRNA, PD-L1 siRNA, 53BP1 siRNA, or RIF1 siRNA. Y axis represents the recovery rate of GFP from I-SceI-induced DSBs in EJ5-GFP reporter. X axis represents 7-AAD (a nucleic acid dye) staining, which was used for the exclusion of nonviable cells for quality control in flow cytometric analysis. Error bars represent ± s.d., n = 3 per group. ***P < 0.001, by two-tailed t test. d H460 cells or H460 PD-L-1 knockout (KO) cells were treated with IR (4 Gy), followed by immunofluorescence co-staining of γH2AX with anti-53BP1, RIF1 or FAM35A, respectively. e, f HR activity was analyzed by FACS using BDTM FACSCanto II in H460 cells expressing Ctrl siRNA, PD-L1 siRNA, 53BP1 siRNA, BRCA1 siRNA+ PD-L1 siRNA or BRCA1 + 53BP1 siRNA. Y axis represents the recovery rate of GFP from I-SceI-induced DSBs in DR-GFP reporter. X axis represents 7-AAD (a nucleic acid dye) staining, which was used for the exclusion of nonviable cells for quality control in flow cytometric analysis. Error bars represent ± s.d., n = 3 per group. *P < 0.05, **P < 0.01, by two-tailed t test. g H460 cells or H460 PD-L-1 knockout (KO) cells were treated with 4 Gy of IR at 2 Gy/min dose rate, followed by immunofluorescence co-staining of γH2AX with pRPA2 or RPA70, respectively. Source data are provided as a Source Data file.
Fig. 6
Fig. 6. IR induces PD-L1 foci, co-localization and direct interaction with Ku80 in the nucleus.
a Co-localizations of PD-L1 with Ku80 or γH2AX were analyzed in H460 cells following IR exposure by immunofluorescence with pre-extraction using CSK plus RNase A (CSK + R). b H460 cells were treated with IR, followed by isolation of cytoplasmic and nuclear fractions. Co-IP experiments using PD-L1 antibody were performed in cytoplasmic and nuclear fractions, followed by western blot. IgG and lysate were used as controls. **PD-L1: glycosylated form, *PD-L1: nonglycosylated form. α-tubulin as cytoplasmic marker, and PCNA as nuclear marker, for purity of each fraction. c PD-L1/Ku80 interactions were analyzed by PLA following IR (4 Gy) exposure in H460 cells. PLA signals were detected by fluorescence microscopy as discrete spots. IgG, single PD-L1 antibody alone or single Ku80 antibody alone was used as negative control. After PLA, immunofluorescence staining using α-tubulin antibody was performed as phase contrast imaging. Error bars represent ± s.d., n = 10 per group. ***P < 0.001, by two-tailed t test. Source data are provided as a Source Data file.
Fig. 7
Fig. 7. The IgC domain of PD-L1 interacts with Ku at the core domain.
a Schematic representation of structural WT and various deletion mutants of PD-L1 and Ku80 proteins. b, c HA-tagged WT Ku80 was co-transfected with Flag-tagged WT PD-L1 or various PD-L1 deletion mutant(s) into 293T cells, followed by co-IP using anti-HA (b) or anti-Flag antibody (c), respectively. The Ku-associated PD-L1 (b, upper) or PD-L1-associated Ku (c, upper) was analyzed by western blot. IgG or 1/10 input was used as negative or positive control, respectively. d, e Flag-tagged WT PD-L1 was co-transfected with HA-tagged WT Ku80 or various Ku80 deletion mutant(s) into 293T cells, followed by co-IP using anti-Flag (d) or anti-HA antibody (e), respectively. The PD-L1-associated Ku (d, upper) or Ku-associated PD-L1 (e, upper) was analyzed by western blot. IgG or 1/10 input was used as negative or positive control, respectively. Source data are provided as a Source Data file.
Fig. 8
Fig. 8. The Ku binding domain in PD-L1 is essential for PD-L1 to accelerate NHEJ-mediated DSB repair and reduce IR sensitivity.
a Western blot analysis of PD-L1 using PD-L1 or Flag antibody, respectively, in H460, H460 PD-L1 KO, H460 PD-L1 KO cells expressing exogenous WT PD-L1 or PD-L1 ΔIgC mutant. b Cells were treated with 4 Gy of IR at 2 Gy/min dose rate, followed by immunofluorescence analysis of γH2AX foci and DAPI at different time points. Foci ≥5/cell were counted as foci-positive cells. Error bars represent ± s.d., n = 3 per group. ***P < 0.001, ****P < 0.0001, by two-tailed t test. c NHEJ activity was analyzed by FACS using CytekTM Aurora in various cells as indicated. Y axis represents the recovery rate of GFP from I-SceI-induced DSBs in EJ5-GFP reporter. X axis represents 7-AAD (a nucleic acid dye) staining, which was used for the exclusion of nonviable cells for quality control in flow cytometric analysis. Error bars represent ± s.d. n = 3 per group. **P < 0.01, ***P < 0.001, by two-tailed t test. d Cells were treated with IR (4 Gy), followed by colony formation assay. Error bars represent ± s.d., n = 3 per group. ***P < 0.001, by two-tailed t test. e Nu/Nu mice with various xenografts were treated with IR (2 Gy every other day, and 5 times in total). Tumor volume was measured once every 2 days. Mice were sacrificed at day 20, and tumors were removed and analyzed. Error bars represent ± s.d., n = 6 mice each group. **P < 0.01, by two-tailed t test. Source data are provided as a Source Data file.

Similar articles

References

    1. Chen, L. & Han, X. Anti-PD-1/PD-L1 therapy of human cancer: past, present, and future. J. Clin. Investig.125, 3384–3391 (2015). 10.1172/JCI80011 - DOI - PMC - PubMed
    1. Nishino, M., Ramaiya, N. H., Hatabu, H. & Hodi, F. S. Monitoring immune-checkpoint blockade: response evaluation and biomarker development. Nat. Rev. Clin. Oncol.14, 655–668 (2017). 10.1038/nrclinonc.2017.88 - DOI - PMC - PubMed
    1. Ghahremanloo, A., Soltani, A., Modaresi, S. M. S. & Hashemy, S. I. Recent advances in the clinical development of immune checkpoint blockade therapy. Cell Oncol.42, 609–626 (2019).10.1007/s13402-019-00456-w - DOI - PubMed
    1. George, J. et al. Genomic amplification of CD274 (PD-L1) in small-cell lung cancer. Clin. Cancer Res.23, 1220–1226 (2017). 10.1158/1078-0432.CCR-16-1069 - DOI - PMC - PubMed
    1. Zak, K. M. et al. Structure of the complex of human programmed death 1, PD-1, and its ligand PD-L1. Structure23, 2341–2348 (2015). 10.1016/j.str.2015.09.010 - DOI - PMC - PubMed

LinkOut - more resources