

Effect of metabolic status on response to SIV infection and antiretroviral therapy in nonhuman primates
- PMID: 39115937
- PMCID: PMC11457846
- DOI: 10.1172/jci.insight.181968
Effect of metabolic status on response to SIV infection and antiretroviral therapy in nonhuman primates
Abstract
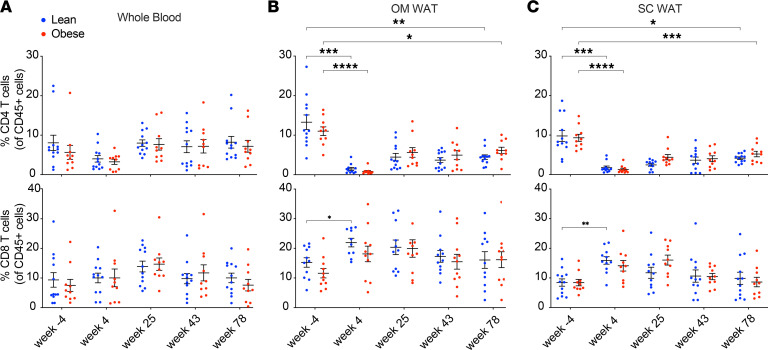
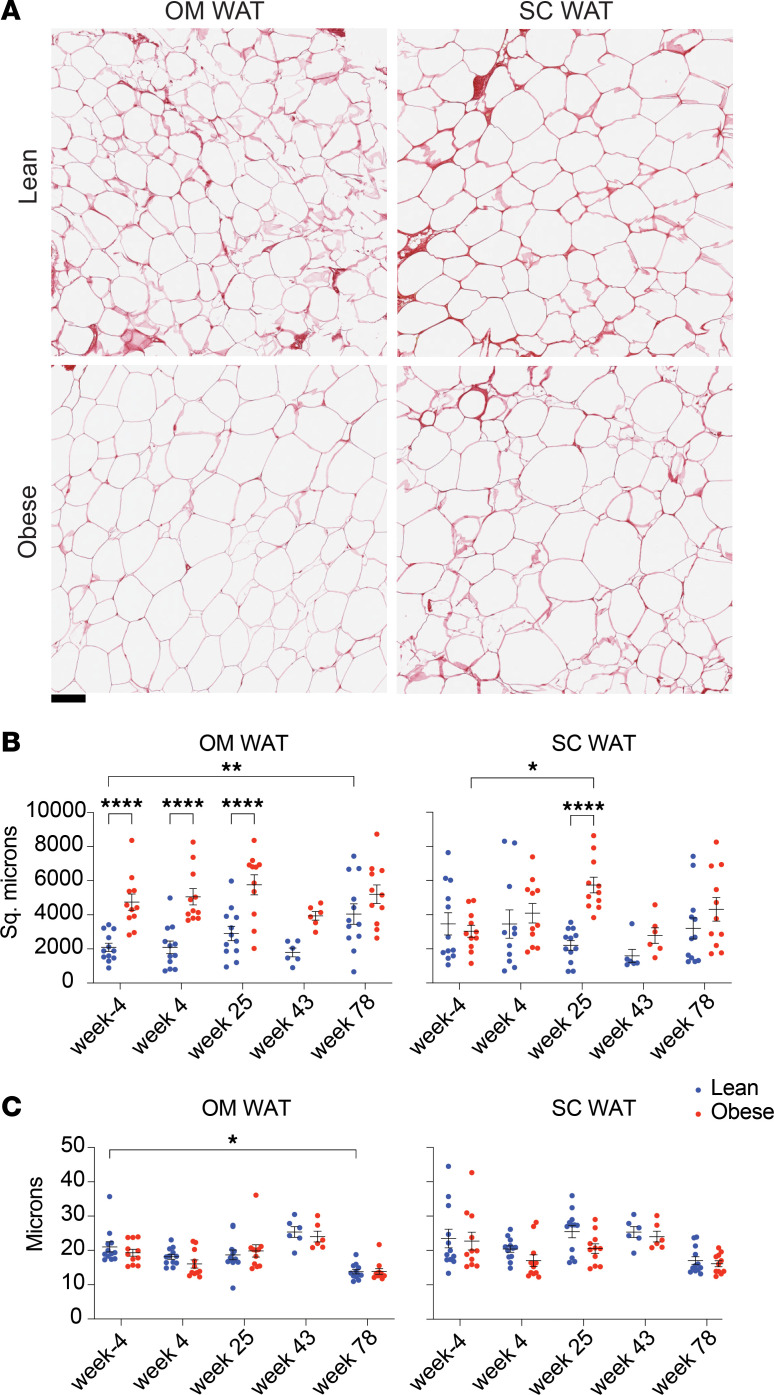
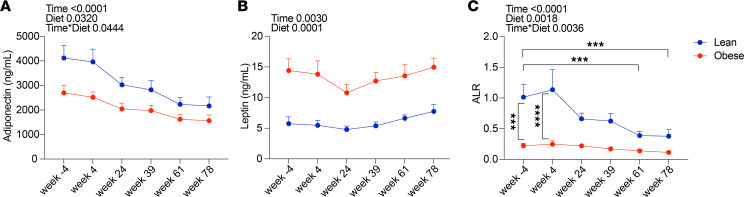
Current antiretroviral therapy (ART) regimens efficiently limit HIV replication, thereby improving the life expectancy of people living with HIV; however, they also cause metabolic side effects. The ongoing obesity epidemic has resulted in more people with metabolic comorbidities at the time of HIV infection, yet the effect of preexisting metabolic dysregulation on infection sequelae and response to ART is unclear. Here, to investigate the impact of preexisting obesity and insulin resistance on acute infection and subsequent long-term ART, we infected a cohort of lean and obese adult male macaques with SIV and administered ART. The responses of lean and obese macaques to SIV and ART were similar with respect to plasma and cell-associated viral loads, ART drug levels in plasma and tissues, SIV-specific immune responses, adipose tissue and islet morphology, and colon inflammation, with baseline differences between lean and obese groups largely maintained. Both groups exhibited a striking depletion of CD4+ T cells from adipose tissue that did not recover with ART. However, differential responses to SIV and ART were observed for body weight, omental adipocyte size, and the adiponectin/leptin ratio, a marker of cardiometabolic risk. Thus, obesity and insulin resistance had limited effects on multiple responses to acute SIV infection and ART, while several factors that underlie long-term metabolic comorbidities were influenced by prior obesity and insulin resistance. These studies provide the foundation for future investigations into the efficacy of adjunct therapies such as metformin and glucagon-like peptide-1 receptor agonists in the prevention of metabolic comorbidities in people living with HIV.
Keywords: AIDS/HIV; Adipose tissue; Glucose metabolism; Metabolism; Obesity.
Figures


Similar articles
-
Initiation of Antiretroviral Therapy Restores CD4+ T Memory Stem Cell Homeostasis in Simian Immunodeficiency Virus-Infected Macaques.J Virol. 2016 Jul 11;90(15):6699-6708. doi: 10.1128/JVI.00492-16. Print 2016 Aug 1. J Virol. 2016. PMID: 27170752 Free PMC article.
-
Bone Marrow-Derived CD4+ T Cells Are Depleted in Simian Immunodeficiency Virus-Infected Macaques and Contribute to the Size of the Replication-Competent Reservoir.J Virol. 2018 Dec 10;93(1):e01344-18. doi: 10.1128/JVI.01344-18. Print 2019 Jan 1. J Virol. 2018. PMID: 30305357 Free PMC article.
-
Simian-Human Immunodeficiency Virus SHIV.C.CH505 Persistence in ART-Suppressed Infant Macaques Is Characterized by Elevated SHIV RNA in the Gut and a High Abundance of Intact SHIV DNA in Naive CD4+ T Cells.J Virol. 2020 Dec 22;95(2):e01669-20. doi: 10.1128/JVI.01669-20. Print 2020 Dec 22. J Virol. 2020. PMID: 33087463 Free PMC article.
-
HIV Persistence in Adipose Tissue Reservoirs.Curr HIV/AIDS Rep. 2018 Feb;15(1):60-71. doi: 10.1007/s11904-018-0378-z. Curr HIV/AIDS Rep. 2018. PMID: 29423731 Free PMC article. Review.
-
Brain macrophages harbor latent, infectious simian immunodeficiency virus.AIDS. 2019 Dec 1;33 Suppl 2(Suppl 2):S181-S188. doi: 10.1097/QAD.0000000000002269. AIDS. 2019. PMID: 31789817 Free PMC article. Review.
References
MeSH terms
Substances
Grants and funding
LinkOut - more resources
Full Text Sources
Medical
Research Materials
