Machine learning-based derivation and validation of three immune phenotypes for risk stratification and prognosis in community-acquired pneumonia: a retrospective cohort study
- PMID: 39114653
- PMCID: PMC11303239
- DOI: 10.3389/fimmu.2024.1441838
Machine learning-based derivation and validation of three immune phenotypes for risk stratification and prognosis in community-acquired pneumonia: a retrospective cohort study
Abstract
Background: The clinical presentation of Community-acquired pneumonia (CAP) in hospitalized patients exhibits heterogeneity. Inflammation and immune responses play significant roles in CAP development. However, research on immunophenotypes in CAP patients is limited, with few machine learning (ML) models analyzing immune indicators.
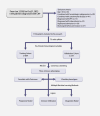
Methods: A retrospective cohort study was conducted at Xinhua Hospital, affiliated with Shanghai Jiaotong University. Patients meeting predefined criteria were included and unsupervised clustering was used to identify phenotypes. Patients with distinct phenotypes were also compared in different outcomes. By machine learning methods, we comprehensively assess the disease severity of CAP patients.
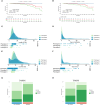
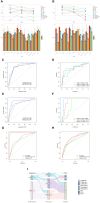
Results: A total of 1156 CAP patients were included in this research. In the training cohort (n=809), we identified three immune phenotypes among patients: Phenotype A (42.0%), Phenotype B (40.2%), and Phenotype C (17.8%), with Phenotype C corresponding to more severe disease. Similar results can be observed in the validation cohort. The optimal prognostic model, SuperPC, achieved the highest average C-index of 0.859. For predicting CAP severity, the random forest model was highly accurate, with C-index of 0.998 and 0.794 in training and validation cohorts, respectively.
Conclusion: CAP patients can be categorized into three distinct immune phenotypes, each with prognostic relevance. Machine learning exhibits potential in predicting mortality and disease severity in CAP patients by leveraging clinical immunological data. Further external validation studies are crucial to confirm applicability.
Keywords: community-acquired pneumonia; immune phenotype; machine learning; risk stratification; unsupervised clustering.
Copyright © 2024 Qin, Yu, Zhao, Xu, Li, Gu and Guo.
Conflict of interest statement
The authors declare that the research was conducted in the absence of any commercial or financial relationships that could be construed as a potential conflict of interest.
Figures


Similar articles
-
Lymphopenic Community Acquired Pneumonia (L-CAP), an Immunological Phenotype Associated with Higher Risk of Mortality.EBioMedicine. 2017 Oct;24:231-236. doi: 10.1016/j.ebiom.2017.09.023. Epub 2017 Sep 21. EBioMedicine. 2017. PMID: 28958655 Free PMC article.
-
Machine-Learning Model for Mortality Prediction in Patients With Community-Acquired Pneumonia: Development and Validation Study.Chest. 2023 Jan;163(1):77-88. doi: 10.1016/j.chest.2022.07.005. Epub 2022 Jul 16. Chest. 2023. PMID: 35850287
-
The Associations of Serum IL-37 With the Severity and Prognosis in Patients With Community-Acquired Pneumonia: A Retrospective Cohort Study.Front Immunol. 2021 May 7;12:636896. doi: 10.3389/fimmu.2021.636896. eCollection 2021. Front Immunol. 2021. PMID: 34025645 Free PMC article.
-
Cold-inducible RNA-binding protein might determine the severity and the presences of major/minor criteria for severe community-acquired pneumonia and best predicted mortality.Respir Res. 2020 Jul 20;21(1):192. doi: 10.1186/s12931-020-01457-2. Respir Res. 2020. PMID: 32689999 Free PMC article.
-
Prognostic value of mid-regional pro-adrenomedullin (MR-proADM) in patients with community-acquired pneumonia: a systematic review and meta-analysis.BMC Infect Dis. 2016 May 26;16:232. doi: 10.1186/s12879-016-1566-3. BMC Infect Dis. 2016. PMID: 27230573 Free PMC article. Review.
Cited by
-
Nutritional Status and Inflammation as Mediators of Physical Performance and Delirium in Elderly Community-Acquired Pneumonia Patients: A Retrospective Cohort Study.Clin Interv Aging. 2024 Oct 3;19:1641-1652. doi: 10.2147/CIA.S483481. eCollection 2024. Clin Interv Aging. 2024. PMID: 39376978 Free PMC article.
References
MeSH terms
Grants and funding
LinkOut - more resources
Full Text Sources
Medical
Miscellaneous

