. 2024 Jul 8;20(10):3823-3841.
doi: 10.7150/ijbs.96113. eCollection 2024.

siRNA-loaded folic acid-modified TPGS alleviate MASH via targeting ER stress sensor XBP1 and reprogramming macrophages

Affiliations

siRNA-loaded folic acid-modified TPGS alleviate MASH via targeting ER stress sensor XBP1 and reprogramming macrophages

Manman Zhu et al. Int J Biol Sci. .

Abstract

Macrophages show high plasticity and play a vital role in the progression of metabolic dysfunction-associated steatohepatitis (MASH). X-box binding protein 1 (XBP1), a key sensor of the unfolded protein response, can modulate macrophage-mediated pro-inflammatory responses in the pathogenesis of MASH. However, how XBP1 influences macrophage plasticity and promotes MASH progression remains unclear. Herein, we formulated an Xbp1 siRNA delivery system based on folic acid modified D-α-tocopheryl polyethylene glycol 1000 succinate nanoparticles (FT@XBP1) to explore the precise role of macrophage-specific Xbp1 deficiency in the progression of MASH. FT@XBP1 was specifically internalized into hepatic macrophages and subsequently inhibited the expression of spliced XBP1 both in vitro and in vivo. It promoted M1-phenotype macrophage repolarization to M2 macrophages, reduced the release of pro-inflammatory factors, and alleviated hepatic steatosis, liver injury, and fibrosis in mice with fat-, fructose- and cholesterol-rich diet-induced MASH. Mechanistically, FT@XBP1 promoted macrophage polarization toward the M2 phenotype and enhanced the release of exosomes that could inhibit the activation of hepatic stellate cells. A promising macrophage-targeted siRNA delivery system was revealed to pave a promising strategy in the treatment of MASH.

Keywords: D-α-Tocopheryl polyethylene glycol 1000 succinate; Endoplasmic reticulum stress; Macrophages; Metabolic dysfunction-associated steatohepatitis; X-box binding protein 1.


Conflict of interest statement

Competing Interests: The authors have declared that no competing interest exists.

Figures
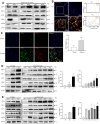
Figure 1
Figure 1
XBP1s is increased in macrophages in high-fat induced ER stress model. (A) The expression of XBP1s, ATF6, IRE1α,GRP78 and PERK in HFD diet induced MASH mice was determined by Western blot analysis(n = 3). Immunofluorescence images of liver tissues of FFC diet-fed mice (B) and NAFLD patients (C) dual stained with XBP1 (green channel) and F4/80 or CD68 (red channel), and semi-quantitative analyzed (scale bar = 50/20 μm). (D-E) The expression of XBP1s, IRE1α, ATF6, GRP78 and PERK in palmitic acid- and TM-treated RAW 264.7 (D) and mTHP-1 cells (E), and semi-quantitatively analyzed the band intensity of XBP1s. Data are presented as the means ± SD (error bar) of at least three independent experiments. *P < 0.05, **P < 0.01, ***P < 0.001 compared with relative controls.
Figure 2
Figure 2
Preparation and characterization of FT@XBP1. (A)Scheme of the formation of folate-modified TPGS encapsulated with Xbp1 siRNA (FT@XBP1) and its mechanism of action in hepatic macrophages. (B) Typical TEM observation of FA-TPGS and FT@XBP1 (scale bar = 500/100 nm). (C) The results of dynamic light scattering of FA-TPGS and FT@XBP1. (D) The UV spectra of TPGS, siXbp1, FA-TPGS and FT@XBP1. (E) Serum stability of FT@XBP1 and siXbp1 at different time points (0, 2, 4, 12 and 24 h). (F) The cumulative drug release profile of FT@XBP1 under the conditions of pHs 7.4 and 5.0. Data are presented as the means ± SD (error bar) of at least three independent experiments.
Figure 3
Figure 3
Cytotoxic effects of FT@XBP1 on macrophages. (A) Cell viability of FA-TPGS, FT@NC and FT@XBP1 on RAW 264.7 cells in a range of concentrations (0, 0.15, 0.3, 0.6, 1.2, 2.4 and 4.8 μg/mL) for 48 h. (B) Flow cytometry analysis determinate apoptotic and necrotic cells in RAW 264.7 cells after treated with FT@XBP1 at 2.4 μg/mL for 48 h, and quantitatively analyzed. The levels of XBP1s protein (C) in RAW 264.7 cells after co-incubating with FA-TPGS based nano-carriers for 48 h and (D) quantitatively analyzed. Data are presented as the means ± SD (error bar) of at least three independent experiments. *P < 0.05 compared with indicated groups.
Figure 4
Figure 4
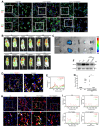
FT@XBP1 specific targeted hepatic macrophage in vitro and in vivo. (A) Representative images of internalization and accumulation of rhodamine B-labeled FT@XBP1 in RAW 264.7 (F4/80) and mTHP-1 (CD68) cells (scale bar = 20/10 μm). (B) In vivo NIR imaging of mice intravenously injected of FT@XBP1 and controls for 72 h. (C) Mean fluorescence intensities of major organs (from left to right are heart, liver, spleen, lungs and kidneys, respectively) at 72 h after administration. (D) Representative images of F4/80 (green channel) positive hepatic macrophages incorporated FT@XBP1 (red channel) in the liver tissues from MASH mice (scale bar = 20/50 μm), and (E) the fluorescence intensity was measured. The protein (F) and mRNA (G) levels of Xbp1s in liver tissues of FT@XBP1 treated MASH mice or relative control. (H) IF analysis XBP1 expression in F4/80 (red channel) positive hepatic macrophages, and (I) the fluorescence intensity was measured. Data are presented as the means ± SD (error bar) of at least three independent experiments. ***P < 0.001 as indicated.
Figure 5
Figure 5
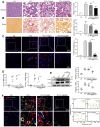
FT@XBP1 alleviated liver injury and steatosis in FFC dieted MASH mice. (A) Schematic overview of the strategy for measuring the effect of FT@XBP1 on FFC diet-induced MASH. (B) Images of mice treated with FT@XBP1 or control. (C, D) Body weight, (E) liver weight and (F) liver index of FFC-fed or chow-fed mice, and FFC-fed mice treated with FT@XBP1 or FT@NC (n = 4). (G) Representative images of H&E staining (scale bar = 50 μm). (H) Serum ALT and AST levels. (I) Images of liver tissues and Oil red O staining (scale bar = 50 μm), and (J) the levels of hepatic TG, serum TC and epididymal fat in FT@XBP1 treated MASH mice or control (n = 4). Data are presented as the means ± SD (error bar) of at least three independent experiments. *P < 0.05, **P < 0.01 and ***P < 0.001 as indicated.
Figure 6
Figure 6
FT@XBP1 alleviated fibrosis in FFC dieted MASH mice. The sections of liver tissues from FT@XBP1 treated mice fed with FFC or chow diet were subjected to Masson staining (A) and Sirius red staining (B), and quantitative analyzed (scale bar = 50 μm). (C) Representative immunofluorescence image of α-SMA in MASH livers (scale bar = 50/20 μm), and semi-quantitative analyzed. The expression of fibrotic genes (D) and proteins (E) of α-SMA and col1αI in liver tissues, and band were quantitatively analyzed. (F) Representative immunofluorescence for F4/80 and α-SMA in MASH livers (scale bar = 50/20 μm), and semi-quantitative analyzed. Data are presented as the means ± SD (error bar) of at least three independent experiments. *P < 0.05, **P < 0.01 and ***P < 0.001 as indicated.
Figure 7
Figure 7
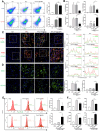
FT@XBP1 repolarized M1 macrophages toward M2 phenotype in vitro and in vivo. (A) Flow cytometry detected the phenotypes of hepatic macrophages from FT@XBP1 treated mice. (B) Inflammatory factors Il-6, l-1β, Tnf-α and Il-10 in hepaticliver tissues of FT@XBP1 treated mice or relative controls were measured using qRT-PCR. (C) Representative immunofluorescence for dual staining F4/80 and CD86 or F4/80 and CD163 in the livers of FT@XBP1 treated mice or relative controls, and semi-quantitative analyzed (scale bar = 50 μm). (D) Representative images of iNOS and CD163 in livers of MASH mice, and quantitative analyzed (scale bar = 50 μm). (E) Flow cytometry detected the percentage of CD86+ and CD163+ RAW 264.7 cells after co-incubating with PA and/or FT@XBP1, and (F) the cultured supernatants were used for measuring inflammatory factors IL-6, IL-1β, TNF-α and IL-10. Data are presented as the means ± SD (error bar) of at least three independent experiments. *P < 0.05, **P < 0.01 and ***P < 0.001 as indicated.
Figure 8
Figure 8
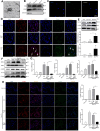
FT@XBP1 alleviated HSCs activation via macrophages derived exosomes. (A) TEM image of exosomes derived from PA treated RAW 264.7 cells (scale bar = 100 nm). (B) Western blot analysis of CD9, CD63, and Calnexin using cell lysates or purified exosomes. (C) Representative images of JS-1 cells encapsulated PKH67-labeled exosomes in vitro (scale bar = 25 μm). The expression of fibrotic molecules was measured by immunofluorescence staining (D) and Western blot analysis (E) of JS-1 cells stimulated with Exo-PA or Exo-con, scale bar = 50 μm. The expression of XBP1s, α-SMA, TIMP1 and Col1αI was determined by Western blot analysis (F), and qRT-PCR assay (G) in JS-1 cells. (H) Immunofluorescence staining of α-SMA and Col1αI after JS-1 cells were treated with macrophage-derived exosomes in vitro (scale bar = 25 μm). Data are presented as the means ± SD (error bar) of at least three independent experiments. *P < 0.05, **P < 0.01 and ***P < 0.001 as indicated.

Similar articles

References

    1. Younossi ZM, Koenig AB, Abdelatif D. et al. Global epidemiology of nonalcoholic fatty liver disease-Meta-analytic assessment of prevalence, incidence, and outcomes. Hepatology. 2016;64:73–84. - PubMed
    1. Estes C, Razavi H, Loomba R. et al. Modeling the epidemic of nonalcoholic fatty liver disease demonstrates an exponential increase in burden of disease. Hepatology. 2018;67:123–33. - PMC - PubMed
    1. Friedman SL, Neuschwander-Tetri BA, Rinella M. et al. Mechanisms of NAFLD development and therapeutic strategies. Nat Med. 2018;24:908–22. - PMC - PubMed
    1. Romero-Gomez M, Zelber-Sagi S, Trenell M. Treatment of NAFLD with diet, physical activity and exercise. J Hepatol. 2017;67:829–46. - PubMed
    1. Xu F, Guo M, Huang W. et al. Annexin A5 regulates hepatic macrophage polarization via directly targeting PKM2 and ameliorates NASH. Redox Biol. 2020;36:101634. - PMC - PubMed