. 2024 Sep;633(8028):127-136.
doi: 10.1038/s41586-024-07747-9. Epub 2024 Aug 7.

The genomic landscape of 2,023 colorectal cancers

Affiliations

The genomic landscape of 2,023 colorectal cancers

Alex J Cornish et al. Nature. 2024 Sep.

Abstract

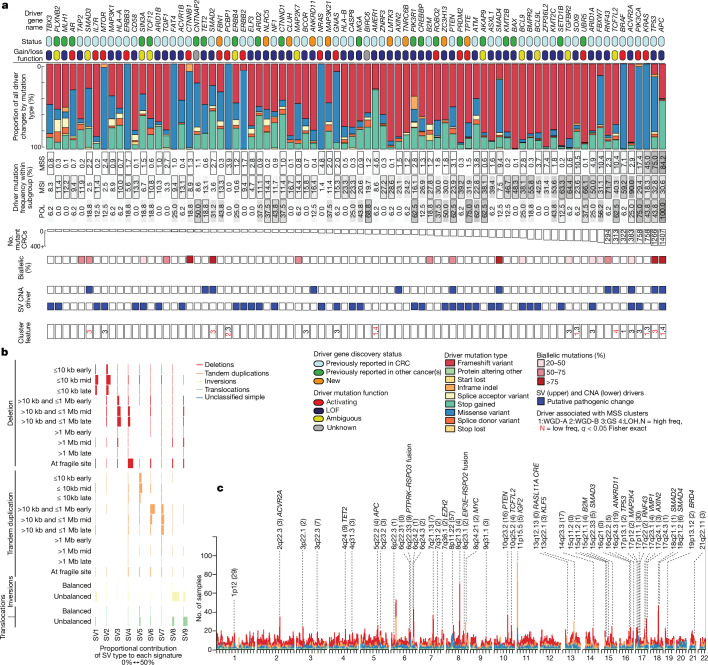
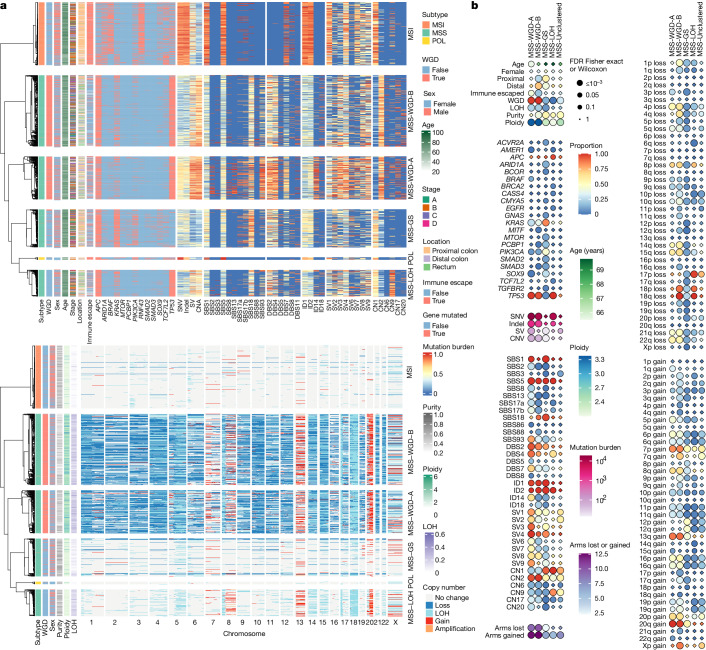
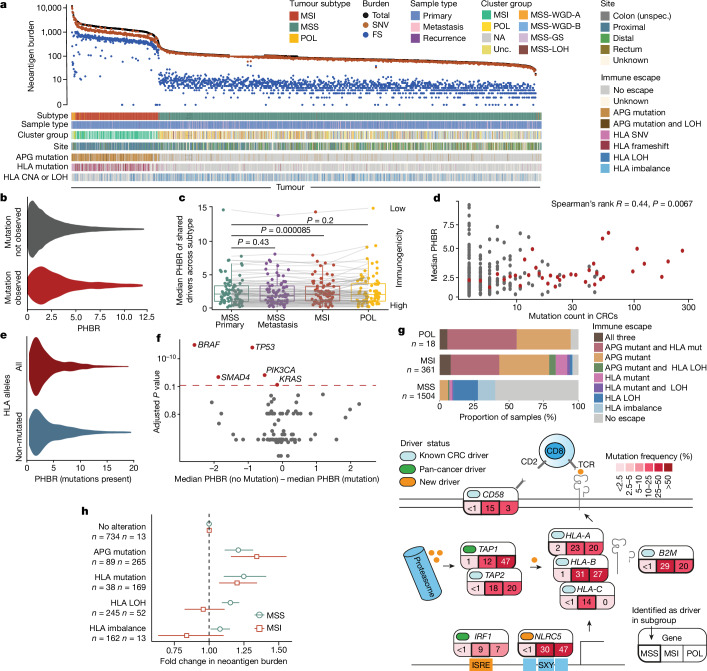
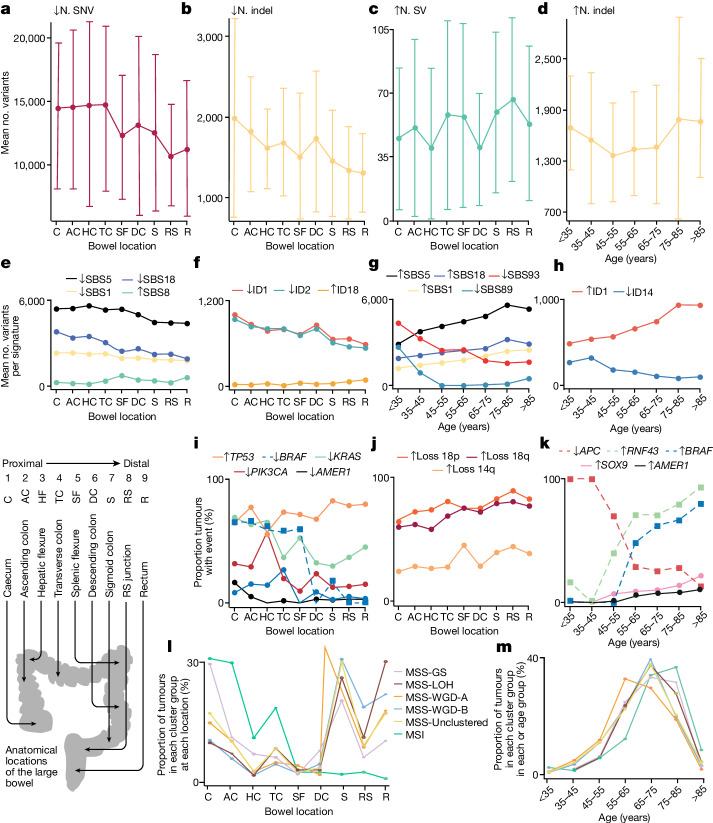
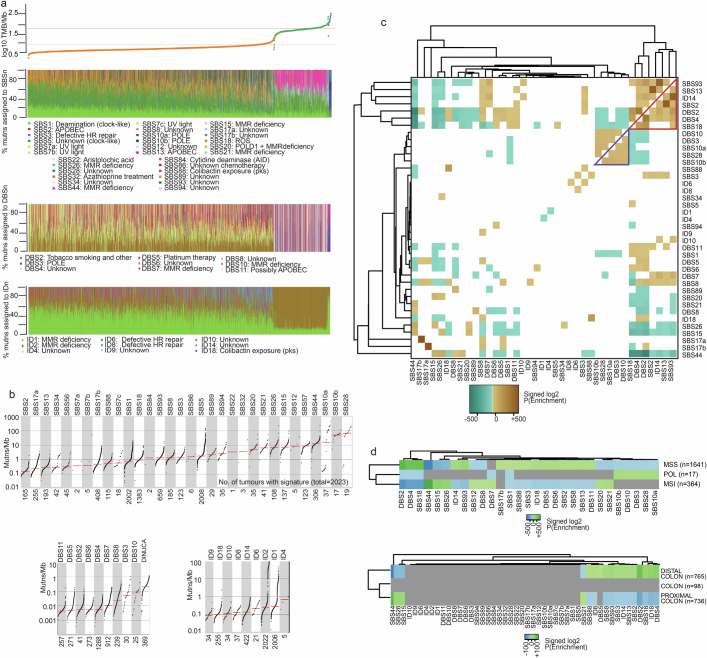
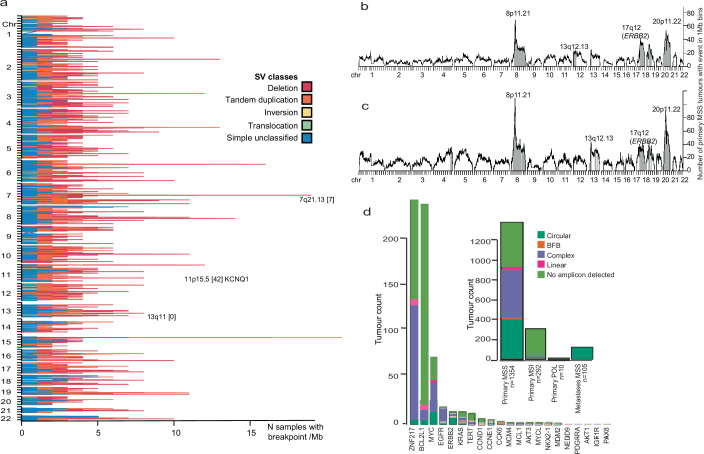
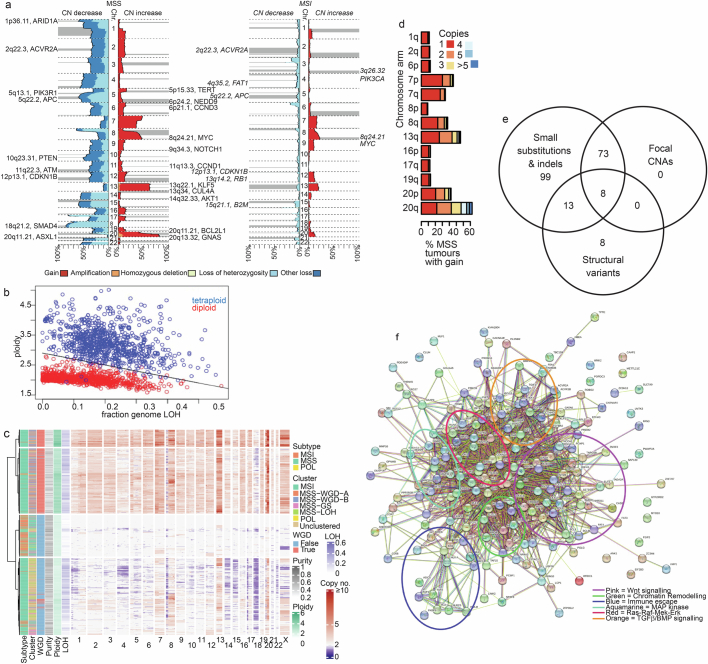
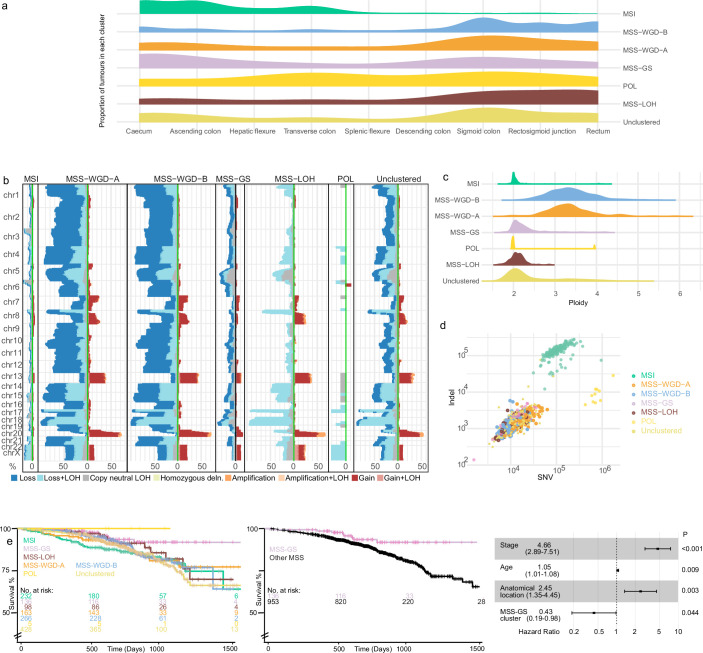
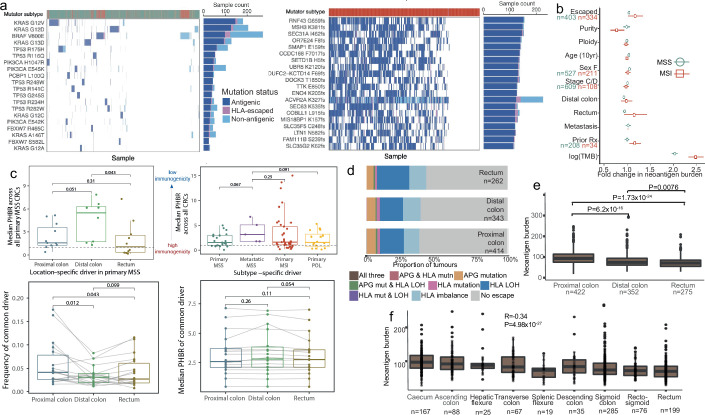
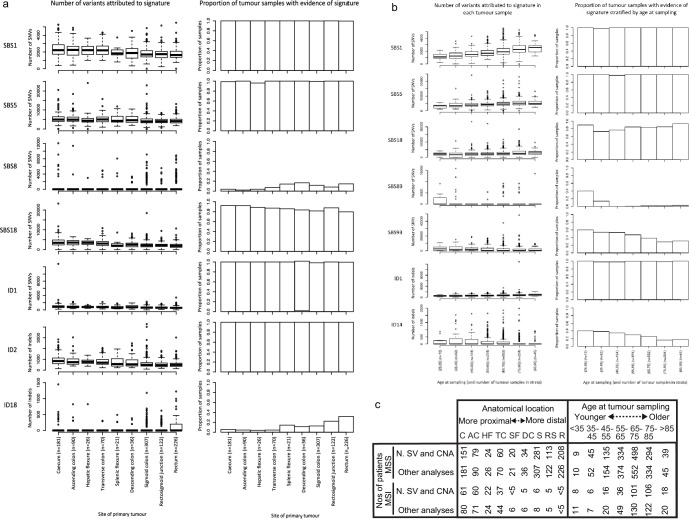
Colorectal carcinoma (CRC) is a common cause of mortality1, but a comprehensive description of its genomic landscape is lacking2-9. Here we perform whole-genome sequencing of 2,023 CRC samples from participants in the UK 100,000 Genomes Project, thereby providing a highly detailed somatic mutational landscape of this cancer. Integrated analyses identify more than 250 putative CRC driver genes, many not previously implicated in CRC or other cancers, including several recurrent changes outside the coding genome. We extend the molecular pathways involved in CRC development, define four new common subgroups of microsatellite-stable CRC based on genomic features and show that these groups have independent prognostic associations. We also characterize several rare molecular CRC subgroups, some with potential clinical relevance, including cancers with both microsatellite and chromosomal instability. We demonstrate a spectrum of mutational profiles across the colorectum, which reflect aetiological differences. These include the role of Escherichia colipks+ colibactin in rectal cancers10 and the importance of the SBS93 signature11-13, which suggests that diet or smoking is a risk factor. Immune-escape driver mutations14 are near-ubiquitous in hypermutant tumours and occur in about half of microsatellite-stable CRCs, often in the form of HLA copy number changes. Many driver mutations are actionable, including those associated with rare subgroups (for example, BRCA1 and IDH1), highlighting the role of whole-genome sequencing in optimizing patient care.


Conflict of interest statement

L.B.A. is a compensated consultant and has equity interest in io9. His spouse is an employee of Biotheranostics. L.B.A. is also an inventor of a US Patent 10,776,718 for source identification by non-negative matrix factorization. L.B.A. declares US provisional applications with the following serial numbers: 63/289,601; 63/269,033; 63/366,392; 63/367,846; 63/412,835. A.J.C. is an employee of Owkin UK Ltd. All other authors declare they have no known competing financial interests or personal relationships that could have appeared to influence the work reported in this paper.

Figures

Fig. 1
Fig. 1. Driver genes and structural variants in CRC.
a, The most commonly mutated driver genes based on separate analyses of SNVs, small indels and other base-level changes in the MSS primary, MSI, POL and MSS metastasis sets. Genes with the highest oncogenic mutation frequencies across the entire cohort are shown in rank order (most frequent on the right). For driver gene discovery, CRC drivers had previously been identified in any CRC cohort (or cohorts), whereas other cancer drivers had previously been identified only in non-CRC or multicancer cancer cohorts,. The remaining drivers were considered new. Mutation role (loss of function (LOF), activating, unknown or ambiguous) was assigned considering previous curation and predictions by this study. Conflicts or uncertainty were termed ambiguous. The percentage of tumours with a pathogenic mutation in the MSS primary (n = 1,521), MSI (n = 360) and POL (n = 16) cohorts are shown. Drivers identified in a specific cohort are in cells with a black border. Number mutated represents all tumours with a pathogenic mutation across all three cohorts. Also shown are: the percentage of tumours with biallelic mutations including LOH; status as a putative SV and/or focal CNA driver; and discriminant genes in the MSS primary cluster analysis. See also Extended Data Fig. 2. b, Nine SV signatures by underlying SV type in MSS primary, MSI and POL CRCs (n = 1,898). Horizontal coloured bars represent the contribution of each SV type to each signature. c, Significant simple SV hotspots identified in MSS primary CRCs (n = 1,354). Numbers of tumours with a SV at each genomic location (1 Mb regions) are coloured by the underlying type. Hotspots (excluding fragile sites) identified at Q < 0.05 (one-sided permutation test) are annotated with cytoband, the number of genes contained (in parentheses) and any candidate gene (Supplementary Table 10). Simple SVs comprise ≤2 individual rearrangements. Unclassified SVs could not be identified clearly as a deletion, tandem duplication, inversion or translocation.
Fig. 2
Fig. 2. Identification of MSS primary CRC molecular subgroups by cluster analysis.
a, Heatmap of the six clusters identified by consensus clustering for a subset of variables that showed a significant difference (false discovery rate (FDR) < 0.05) between the MSS clusters. The single cluster analysis is split into two parts for better visualization. Top, subtype (MSS primary, MSI and POL), WGD status, age at sampling, sex, Dukes stage, site, immune-escape status, genes, mutation burdens and signatures. Bottom, subtype, WGD status, purity, ploidy, fraction LOH and copy number states. Values for mutation burdens (SNV, indel, SV, CNA) and signatures (SBS, DBS, ID, SV and CN) are ranked and scaled to lie between 0 and 1. Driver gene mutations are shown by gene name. Chromosome arm-level changes are shown by 1–22 and X. b, Summary of significant and other selected associations between molecular features and MSS primary clusters relative to the entire MSS primary group. Circle size shows FDR, diamonds indicate non-significance (FDR > 0.05). For categorical variables measured as the proportion of tumours (for example, signature presence, immune escape), a heatmap scale between 0 and 1 is used. Quantitative variables each have a bespoke scale, as shown. Full data are shown in Supplementary Table 23. No significant difference between clusters (FDR > 0.05) was found for many variables, mostly those with a low frequency in MSS primary tumours. Notable moderate-frequency molecular variables without a significant association with cluster group included signatures DBS6 and SV5 and driver mutations in FBXW7, SMAD4 and PTEN. There was also no significant association with microbiome diversity or prevalence of the top 20 bacterial genera.
Fig. 3
Fig. 3. Immune landscape of CRC.
a, Neoantigen burdens and immune-escape mutations. Bars show antigen-presenting or antigen-processing gene (APG) and HLA alterations in each cancer. FS, frameshift; unspec., unspecified; unc, unclassified. b, PHBR of all non-observed mutations in all cancers (n = 478,106 mutations) compared with observed mutations (n = 3,211 mutations). P = 6 × 10–56. c, Median PHBR of driver mutations (n = 80) shared between CRC subtypes, computed separately for cancers of each subtype. Lines connect PHBR values of the same mutation across subtypes. d, Median PHBR of driver mutations across the entire CRC cohort by mutation count. Grey dots represent individual mutations, red dots show the median for mutations at the same frequency. e, The influence of HLA alterations on PHBR. Values for each driver in each patient with a HLA mutation using the full set of patient-specific HLA alleles (red) are compared with values computed from a reduced, non-mutated set (blue). P = 2 × 10–11. f, Median PHBR difference of non-mutated and mutated driver gene changes within patients. Each dot denotes a driver. Genes with significant difference (PBonferroni < 0.1) are highlighted in red. g, Top, somatic mutations in components of the APG pathway by CRC subtype. Bottom, frequencies of cancers with mutations in specific APGs or HLA. A total of 140 cancers were excluded from the analysis owing to incompatible HLA types. h, Associations between immune-escape-associated somatic mutations and neoantigen burden. Multivariable regression analysis was performed in 1,412 MSS primary and 309 MSI cancers, using no HLA or APG alteration as the baseline. Circles or squares show odds ratio (OR) point estimates and whiskers show 95% CIs. Numbers of cancers with each type of alteration are shown (tumours can be present in more than one alteration group). Throughout, unless otherwise stated, two-sided Wilcoxon tests were used, and for box plots, the centre line shows the median, the box limits show upper and lower quartiles, and the whiskers show 1.5× inter-quartile range.
Fig. 4
Fig. 4. Variation of molecular features with MSS CRC anatomical location in the large bowel and with patient age at presentation.
ad, Mean number of variants (N) based on bowel location (ac) and age (d). a, Decreasing SNV burden from proximal to distal colorectum. b, Decreasing indel burden from proximal to distal colorectum. c, Increasing indel burden from proximal to distal colorectum. d, Increasing indel burden with age. eh, Mean number of variants per signature based on bowel location (e,f) and age (g,h). e, Decreasing mutation burdens ascribed to SBS5, SBS18 and SBS1, and increasing SBS8 burden, from proximal to distal colorectum. f, Decreasing mutation burdens ascribed to ID1 and ID2, and increasing ID18 burden, from proximal to distal colorectum. g, Decreasing mutation burdens ascribed to SBS93 and SBS89, and increasing SBS5, SBS18 and SBS1 burdens, with age. h, Decreasing mutation burdens ascribed to ID14, and increasing ID1 burden, with age. i, Decreasing frequencies of KRAS, PIK3CA and AMER1 driver mutations, and increasing frequency of TP53 mutations, from proximal to distal colorectum, with decreasing frequency of BRAF in MSI tumours shown for comparison. j, Increasing frequencies of arm-level CNAs involving chromosomes 18p, 18q and 14q from proximal to distal colorectum. k, Increasing frequencies of SOX9 and AMER1 driver mutations with age in MSS primary tumours compared with increasing frequencies of RNF43 and BRAF, yet decreasing APC, with age in MSI tumours. l, Proportions of tumours in four MSS cluster groups, unclustered MSS and MSI showing increased MSS-GS (and MSI) in proximal locations and increased WGD-B in distal locations. m, As per l but by age, showing relatively early presentation of WGD-A cancers. Selected MSI data are shown by way of comparison in i and k using dashed lines. Error bars in ad represent standard deviations. The bottom-left panel shows the nine anatomical sub-divisions of the colorectum, from caecum (most proximal) to rectum (most distal). RS, recto-sigmoid. Full data in these panels and additional data are provided in Supplementary Table 37, with further details in Extended Data Fig. 9 and Supplementary Tables 23 and 32–34.
Extended Data Fig. 1
Extended Data Fig. 1. SBS, DBS and ID mutational signatures in each tumour.
(a) top-to-bottom: tumour mutation burden (TMB) per megabase (Mb) and mutational signature activity (% of mutations assigned) for SBS, DBS and ID mutations. Tumour subtypes are: MSS primary (n = 1641, orange), MSI (n = 364, green) and POL (n = 17, blue). Tumours are first grouped according to their subtype and then ordered within each group from the lowest to the highest TMB. Common signatures included clock-like processes (e.g. SBS1, SBS5) and effects of specific underlying aetiologies (e.g. oxidative damage, SBS18). Signatures previously unreported in CRC included SBS89 and SBS94 (29 and 35 cancers, respectively; both unknown aetiology). Previously reported SBS30 (base excision repair), SBS40 (unknown aetiology) and ID7 (defective mismatch repair) were not found. (b) Ascribed mutation burdens for each detected signature in all CRCs. (c) Pairwise associations between mutational signatures. Clusters of co-occurrence, based on binary presence/absence, are highlighted by coloured triangles. Positive values (ochre) represent significant co-occurrence, whereas negative values (cyan) indicate relative exclusivity, with stronger associations in deeper shading (Bonferroni-corrected P values, Fisher’s exact test). Non-significant results are in white. Putative artefact signatures and signatures with no significant result (PBonf > 0.05) are not shown. Hierarchical clustering (Ward.D2, Euclidean distances) was performed on the rows and columns of the results matrix. Note negative associations between MSS- and MSI-specific signatures and positive associations between signatures with other likely shared aetiology (e.g. SBS17a/b). There were several novel associations of unknown origin. Notable relationships additional to those reported in the main article included an inverse association across all cancers between SBS44 (often MSI, dominated by C > T) and DBS2 (smoking, CC > NN) (PBonf = 1.4 x 10−173), DBS4 (GC > AA, TC > AA) (PBonf = 5.8 x 10−137) and SBS18 (C > A) (PBonf = 6.5 x1 0−139). A further cluster involved SBS10a/b, SBS28, DBS3 and DBS10 (driven by POLE). SBS3 tended to co-occur with ID6, ID8 and SBS88. (d) Selected signatures showing significant differences among MSS primary, MSI and POL cancers (upper) or anatomical locations (lower). Associations are assessed as in (c), although co-occurrence is shown by green hues and mutual exclusivity in blue. MSI tumours were principally characterised by SBS44, and POL by SBS10a/b and SBS28. MSS cancers were enriched for SBS2, SBS8, SBS13, SBS18 and SBS93. SBS88, pks+ pathogenic E. coli exposure, was present in 115 (6%) cancers and ID18 (colibactin-derived) in 255 (13%). Note that these associations are uncorrected for covariables; multivariable analysis is shown in Supplementary Table 32. Further information is provided in Supplementary Result 1.
Extended Data Fig. 2
Extended Data Fig. 2. Driver mutations.
(a) Distribution of per-tumour driver mutation counts by CRC type. Predicted pathogenic mutations from 193 driver genes (Supplementary Table 4) were included in the analysis which showed a highly significant difference (P = 2.6 x 10−198, two-sided Kruskal-Wallis). n, numbers of tumours in each of the four groups. (b) Significant pairwise associations between the most frequently mutated driver genes and indel hotspot mutations, whole genome duplication, age, anatomical location and mutational signatures (Q<0.05). (c) Frequencies of 241 CRC SNV/indel driver gene mutations across all samples (including analysis of MSS primary cancers by anatomical location, Supplementary Table 35). The plot shows the sample sets in which the driver was discovered (colour of bar) and previous reports of the gene as a driver in CRC or other cancers (colour of gene name). The y-axis shows the proportion of cancers with a predicted pathogenic SNV or small indel mutation across the whole tumour set. In addition to these drivers, eight SV hotspots were denoted as likely drivers, involving genes CDKAL1, BRD4, EZH2, IGF2, KCNQ1, MYC, UBE3A and VMP1 (Supplementary Table 35). (d) Frequencies of putative driver mutations in four major signaling pathways, Wnt, Ras-Raf-Mek-Erk/MAP-kinase, Pi3 kinase and TGFβ/BMP. Pathway information obtained from KEGG and TCGA. Key pathway genes not identified as CRC drivers by IntOGen are included in grey. Colour code for driver status is as per Fig. 1. Numbers refer to mutation frequency in that CRC subgroup (left-right: MSS, MSI, POL), with increasingly red shading for higher frequencies). Subgroups in which the gene was identified as a driver are shown with bold outline as per Fig. 1.
Extended Data Fig. 3
Extended Data Fig. 3. Somatic structural variation.
(a) Hotspots of simple structural variants (SVs) identified in MSI tumours (n = 292). Coloured lines represent numbers of samples with a SV breakpoint of each class in 1Mb genome regions. Hotspots are annotated with their cytoband, the number of genes within their boundaries (in brackets) and any candidate gene. SVs at fragile sites are not included. (b, c) Numbers of MSS primary tumours with (b) chromothripsis events and (c) unclassified complex SVs. Regions enriched for chromothripsis and unclassified complex SV at a 5% FDR and greater than 5Mb in size are shaded. SVs at fragile sites are not included. (d) Extrachromosomal DNA (ecDNA) across CRC subtypes and its contribution to common oncogene amplification. The smaller chart shows the counts of tumours carrying at least one ecDNA amplicon across tumour subtypes (e.g. tumour counted as “Circular” if ≥ 1 circularised amplicon detected, otherwise “BFB” if ≥ 1 BFB amplicon detected until “No amp” where no valid amplicon detected). The larger chart shows ecDNA classification of commonly amplified oncogenes in MSS primary tumours. Classification was restricted to gene amplifications with a total copy number ≥ 5 in diploid tumours or ≥ 10 in tetraploid tumours (i.e. amplifications or “big gains”). See Supplementary Table 13.
Extended Data Fig. 4
Extended Data Fig. 4. CNAs, SVs, WGD and pathways of tumorigenesis.
(a) CNA summary in MSS primary and MSI tumours. Genome-wide frequencies of CNA in MSS primary (n = 1,354) and MSI (n = 292) tumours are shown. Focal amplifications and deletions reported by GISTIC analysis are shown as grey bars, and annotated with a cytoband and likely candidate gene where identified. Black dashed lines represent chromosome boundaries. (b) Classification of all tumours into diploid and tetraploid (genome-doubled). (c) Hierarchical clustering of all tumours based only on copy number states identifies WGD/non-WGD split (column 2). CNA-based clustering identified a division based on WGD, with features highly reminiscent of the iCMS2/3 division identified by Joanito et al using single cell transcriptomics. (d) Frequency of copy number gain in MSS primary tumours by chromosome arm. (e) Numbers of driver genes identified in the three main classes (SNV/indel, SV and focal CNA). Putative SV and focal CNA drivers must be (i) at a site significantly over-represented above background levels, and (ii) annotated to either a known SNV/indel driver or a single gene (i.e. there is only a single coding gene in the SV hotspot or focal CNA region). SNV/indel drivers identified in MSS cancers in a specific anatomical region of the colorectum are not shown (see Supplementary Tables 35 & 36). SV and CNA changes at fragile sites are excluded. CNAs in particular and SVs are likely to include some second hits at tumour suppressor genes (Supplementary Table 18). The following genes are annotated as putative CNA drivers based on focal changes, including focal or minimal overlapping regions of change: ACVR1B, ACVR2A, AKT1, ANK1, APC, ARID1A, ARID1B, ARID2, ASXL1, ATM, AXIN1, B2M, BCL9, BCL9L, BMPR2, CASP8, CCND3, CD58, CDK12, CDKN1B, CHD2, CREBBP, CUL4A, DUSP16, EIF2B3, ELF3, EPHA3, ERBB2, ERBB4, FHIT, FKBP9, FOXP1, FSIP2, FUS, GNAS, GOLGA5, GPNMB, IDH1, IL7R, IRF1, KLF5, LCP1, MGA, MITF, MLF1, MTOR, MYH11, NBEA, NEDD9, NF1, NRAS, PAN3, PDE4DIP, PIK3CA, PIK3R1, PLK1, PLXNB2, POLE, POLG, POPDC3, PRDM2, PRKAG1, PRKCB, PTEN, PTPN11, PWWP2A, RASGRF1, RB1, ROBO2, SAP130, SETD1B, SIN3A, SMAD4, TBX3, TCF3, TFRC, THEMIS, TPTE, USP36, ZBTB7A and ZC3H13. The following genes are annotated as putative SV drivers based on hotspots: ACVR2A, ANK1, ANKRD11, APC, AXIN2, B2M, BRD4, CD58, CDKAL1, CDKN1C, CTNNB1, EZH2, IGF2, KCNQ1, KLF5, MAP2K4, MMP16, MYC, PTEN, RNF43, SMAD2, SMAD3, SMAD4, STAG1, TCF7L2, TET2, TP53, UBE3A and VMP1. (f) Molecular and functional connections between CRC driver genes from (e). Connections are derived from STRING. Gene annotation to the six pathways or “other pathway” was performed manually. Note that this analysis weights all driver genes equally.
Extended Data Fig. 5
Extended Data Fig. 5. Clinicopathological and molecular features of the four MSS clusters in comparison with MSI and POL cancers.
(a) Anatomical sub-divisions of the colorectum (see Fig. 4). Note that numbers of CRCs in the splenic flexure and descending colon are generally relatively low compared with other regions. (b) Copy number changes and LOH. (c) Ploidy. (d) SNV and indel burdens. Note the lack of obvious structure within the MSS sub-group centroid. (e) Survival. Left, Kaplan-Meier plot showing overall survival of patients with tumours in the four MSS clusters with unclustered MSS, MSI and POL also shown. Median follow-up was 755 days. The failure to show the established association between MSI and good prognosis could be accounted for by the higher age and stage of the MSI patients, together with the non-availability of cancer-specific measures of survival. In analysis uncorrected for stage, age, location and other clinicopathological variables, logrankP = 0.16. Centre, Kaplan-Meier plot showing overall survival of MSS-GS cancer patients versus all other MSS cancers. Median follow-up was 754 days. In analysis uncorrected for stage, age, location and other clinicopathological variables, logrankP = 0.019. Right, multivariable analysis, showing that MSS-GS patients had significantly longer overall survival (HR = 0.43, P = 0.044) than the other MSS clusters in a CoxPH model including age, stage (C,D v A,B (reference)), and location (proximal colorectum v distal colorectum (reference)). Sex was not significantly associated with survival. In the forest plot, the boxes represent point estimates and the horizontal lines delimit 95% confidence intervals. No. at risk, number of patients entering the study at time 0, or for subsequent times, number who had not suffered an event or been censored during the previous time period.
Extended Data Fig. 6
Extended Data Fig. 6. Rare molecular sub-groups and non-coding driver SVs.
(a) Representative copy number analysis of a cancer with sub-clonal SMAD4 (chr18q21.2) mutation. The Battenberg output shows copy number along the genome from chromosome 1 to 22. Red bars indicate total copy number, orange bars sub-clonal copy number states and blue bars minor allele copy number. Integrating these data with SNV data shows the most parsimonious explanation to be that chromosome 18 has sub-clonal (average copy number ~0.5) loss, by clonal deletion of one homologue and the co-existence of two sub-clones of similar prevalence, one with deletion of the other homologue and the other with a loss of function SMAD4 mutation. The presence of multiple other sub-clonal copy number changes in this tumour supports this view. (b) Co-occurrence of Wnt pathway driver mutations in MSS primary tumours. Pairwise comparison is by logistic regression, using co-variables of TMB, age, sex and location. The pairwise effect size β (co-occurrence >1 (blue), exclusivity <1 (red)) is shown in each square. Uncorrected two-sided P-values for the pairwise association are indicated as * <0.05, ** <0.01, *** <0.001. Note the co-occurrence of CTNNB1 and TCF7L2, which is also present in MSI tumours (β = 0.26, P<0.001). (c) Representative copy number analysis of an MSI cancer with WGD and chromosomal instability (CIN). The Battenberg output shows a grossly rearranged, polyploid genome, placing this cancer amongst the most altered of the MSS group. It contrasts sharply with the near-unaltered karyotypes of most other MSI cancers. (d) Mutation status of BRCA1/2 in tumours with and without predicted homologous recombination deficiency (HRD) based on HRDetect (probability threshold 0.7). Germline or somatic BRCA1/2 variants defined as moderate or high impact by Variant Effect Predictor (VEP) and/or reported as pathogenic or likely pathogenic by ClinVar (v1.20) were included in the analysis, together with CNAs. (e) Proportion of cancers showing ID8 activity in patients who had received radiotherapy for treatment of their CRC or a different cancer prior to the CRC. (f) Multiple simple structural variants (SVs) identified at 17q24.3 overlapping lncRNAs and a regulatory element that interacts with the SOX9 promoter. Data from MSS primary cancers (n = 1,354) are shown. Top track arcs represent simple SVs; second track shows mean GC-corrected log ratio between tumour and normal read coverage (logRR) as computed by Battenberg – higher and lower values indicate tendencies for copy number gains and losses respectively amongst the included tumours; third track shows chromosomal interactions identified in HT29 cells using promoter capture Hi-C; fourth track shows histone mark signals; and bottom track shows the locations of coding genes in the region and lncRNA LINC00673/LINC00511. Vertical lines represent hotspot start and end positions.
Extended Data Fig. 7
Extended Data Fig. 7. Driver mutation immunogenicity and immune escape.
(a) Heatmap and frequency chart of the 20 most common antigenic SNV and frameshift mutations. Mutations are shown in order of decreasing frequency across the CRC set. Colours show antigenic mutations (dark blue), escaped antigenicity through HLA alteration (purple), or non-antigenic mutations (light blue). The molecular subtype of each cancer is shown above the heatmap (green: MSS, red: MSI, yellow: POL). Among recurrent non-synonymous mutations, KRAS G12V was most antigenic, predicted to bind patient-specific HLA molecules in 80% (146/181) of cancers. KRAS G12D and G13D were also frequently predicted to be antigenic, whereas the rarer KRAS mutations G12C, A146T and G12A were less so. BRAF V600E was predicted to be antigenic in only 36% (98/272) of cancers, as the HLA alleles binding the resulting epitope were either uncommon or, in 20% of cancers with predicted binding, underwent somatic loss. The most common peptide-changing frameshift mutations were principally found in MSI cancers, at a frequency of >40% (and are shown in these cancers only). Frameshift mutations produced a neoantigen in >95% of cases, although the most frequent frameshift in MSS cancers, APC E1309fs, had low predicted antigenicity (30%, 14/47 cases). For the 20 most frequent non-synonymous changes, the observed mutation frequency and predicted antigenic frequency were inversely related (P = 0.042, two-sided Pearson correlation test). There was no equivalent association for the 20 most frequent frameshift changes (P = 0.32), plausibly reflecting their almost universally high immunogenicity. (b) Dependency of neoantigen burden on immune escape, TMB and other clincopathological and molecular variables separately in 1,450 MSS and 350 MSI cancers in multivariable regression models. Green circles and red squares represent odds ratios for each variable respectively, with whiskers showing 95% confidence intervals. Escape is defined as having HLA LOH or a mutation in HLA, B2M or other antigen presenting gene. Note that too few MSI metastases were present for associations to be calculated. The variables listed are tested relative to reference variables, which are (top-bottom, excluding quantitative and categorical variables): non-escaped; males; stage A/B; non-metastasis; and no prior non-surgical therapy. Purity, ploidy, age and TMB are quantitative variables; location (distal colon or rectum) is compared against proximal colon. (c) Immune features of tumours and driver genes from different anatomical locations. Top left: PHBR immunogenicity scores for 29 location-specific driver genes (11, 8 and 10 in proximal colon, distal colon and rectum respectively) in 1,049 MSS primary cancers. Top right: PHBR scores for subtype-specific driver genes (21 MSS primary, 5 MSS metastasis, 37 MSI, 16 POL) in 1,933 CRCs. Bottom left: frequencies of mutations in 18 driver genes common to different locations. Bottom right: PHBR of mutations in the 18 location-common driver mutations in each location. For box plots, centre line shows median, box limits show upper and lower quartiles, and whiskers show 1.5x inter-quartile range. Drivers specific to the distal colon had low overall immunogenic potential (median PHBR > 1) and lower immunogenicity (higher median PHBR) than proximal colon- and rectum-specific drivers (Pproximal v distal = 0.051; Prectum v distal = 0.043). This also suggests that there is a stronger immune selection acting on drivers in the distal colon. Recurrent mutations in MSS driver genes were less frequent in distal than proximal CRCs (P = 0.012). However, the immunogenic potential of these mutations was near-identical between locations, suggesting that the observed depletion was not a consequence of site-specific driver immunogenicity. For example, KRAS G12D was detected in 18%, 7% and 12% of proximal colonic, distal colonic and rectal tumours, respectively (median PHBRs of 3.7, 3.9 and 3.6). Overall, the data are consistent with stronger immune surveillance in the distal colorectum, which lowers the threshold for tolerated immunogenicity, so that mutations that would be tolerated in the proximal colon are pruned in the distal colorectum. (d) Immune escape mutations in MSS primary tumours from proximal colon, distal colon and rectum. Cause of immune escape is colour coded. (e) Neoantigen burdens in MSS primary tumours from proximal colon, distal colon and rectum. n, numbers of cancers in each location. (f) Neoantigen burdens in MSS primary tumours in regions 1-9 from caecum to rectum. P value (two-sided) and correlation R are from Spearman’s rank correlation analysis. n, numbers of cancers in each location. For all panels, box plots are drawn as per panel (c) and statistical analyses used two-sided Wilcoxon tests, unless otherwise stated.
Extended Data Fig. 8
Extended Data Fig. 8. The CRC microbiome.
(a) Microbiome decontamination process. Tumour and blood prevalence of all species are shown, according to methods based on The Cancer Microbiome Atlas. Orange points indicate taxa thought to be contaminants due to presence in both blood and tumour samples. Outlined points indicate species previously associated with CRC. (b) Mean relative abundance of microbial genera for the four main CRC subtypes. The most abundant 20 genera are shown. Other taxa are summed as “Others” for ease of visualisation. (c) Bacterial load and (d) Shannon diversity index for different CRC groupings. The 33 distal and rectal MSI cancers are not included, as the small cohort sizes do not allow meaningful comparisons. P-values for pairwise comparisons are displayed. (e) Adonis PERMANOVA results comparing Bray-Curtis distances against various clinical and genomic factors. R-squared is the percentage of diversity linked to each factor. Adonis P-value (two-sided) is indicated by symbol: * P < 0.05. ** P < 0.01. *** P < 0.001. (f, g) Examples of two taxa distributions significantly associated with anatomical location for Akkermansia and Fusobacterium respectively. Multivariate MaAslin2 P-values had been calculated from all samples and associations identified at P<0.05 (two-sided). Univariable P-values are shown in the panel, as these plots do not include distal or rectal MSI tumours. (h) E. coli anatomical site distribution for pks-positive and -negative MSS CRCs. E.coli proportions in tumours with either ID18 or SBS88 contributing to 5% or more of the mutational burden, compared to tumours with no pks contribution, are shown by anatomical location. No MSI tumours were pks-positive by these thresholds. P-values comparing pks-positive and -negative tumours for each location are shown. For panels (b-g), numbers of cancers were: rectum MSS 350; distal colon MSS 382; proximal colon MSS 454; and proximal colon MSI 282. Where reported, 1,898 primary tumours and 122 metastases were analysed. For panel (h), numbers of cancers were: rectum pks+ 101; rectum pks- 249; distal colon pks+ 51; distal colon pks- 331; proximal colon pks+ 28; and proximal colon pks- 426. For all box plots, the box is 25th to 75th percentile, the central bar is the median, and the whiskers are the largest/smallest values within 1.5 x interquartile range beyond the box. All P values are unadjusted from two-sided Wilcoxon tests unless otherwise stated.
Extended Data Fig. 9
Extended Data Fig. 9. Further details of analyses by anatomical location and age.
(a) Location of primary tumour and number of variants attributed to mutational signatures in microsatellite stable (MSS) primary tumours. Shown are mutational signatures associated with tumour location at a Bonferroni-corrected two-sided P-value of 0.05 using multiple linear regression considering age at sampling, sex, stage, grade and sample purity. n: number of tumour samples from location. (b) Age at sampling and number of variants attributed to mutational signatures in primary MSS tumours. Shown are mutational signatures associated with age at sampling (10 year bins) at a Bonferroni-corrected two-sided P-value of 0.05 using multiple linear regression considering sex, primary tumour location, stage, grade and sample purity. The Yeo-Johnson extension to the Box-Cox-transformation was applied to variant numbers. (c) Numbers of patients included in anatomical location or age analyses. Counts <5 are masked to prevent patient re-identification. In all panels, boxplots show the median value (thick black line), interquartile range (IQR; box bounds), and all outlying values (circles). Boxplot whiskers extend to the most extreme data point which are no more than 1.5 times the IQR from the box.

Similar articles

Cited by

References

    1. Sung, H. et al. Global Cancer Statistics 2020: GLOBOCAN estimates of incidence and mortality worldwide for 36 cancers in 185 countries. CA Cancer J. Clin.71, 209–249 (2021). 10.3322/caac.21660 - DOI - PubMed
    1. Bailey, M. H. et al. Comprehensive characterization of cancer driver genes and mutations. Cell173, 371–385.e18 (2018). 10.1016/j.cell.2018.02.060 - DOI - PMC - PubMed
    1. Giannakis, M. et al. Genomic correlates of immune-cell infiltrates in colorectal carcinoma. Cell Rep.15, 857–865 (2016). 10.1016/j.celrep.2016.03.075 - DOI - PMC - PubMed
    1. Grasso, C. S. et al. Genetic mechanisms of immune evasion in colorectal cancer. Cancer Discov.8, 730–749 (2018). 10.1158/2159-8290.CD-17-1327 - DOI - PMC - PubMed
    1. Liu, Y. et al. Comparative molecular analysis of gastrointestinal adenocarcinomas. Cancer Cell33, 721–735.e8 (2018). 10.1016/j.ccell.2018.03.010 - DOI - PMC - PubMed

MeSH terms