. 2024 Aug 7;15(1):6716.
doi: 10.1038/s41467-024-49898-3.

Motor domain phosphorylation increases nucleotide exchange and turns MYO6 into a faster and stronger motor

Affiliations

Motor domain phosphorylation increases nucleotide exchange and turns MYO6 into a faster and stronger motor

Janeska J de Jonge et al. Nat Commun. .

Abstract

Myosin motors perform many fundamental functions in eukaryotic cells by providing force generation, transport or tethering capacity. Motor activity control within the cell involves on/off switches, however, few examples are known of how myosins regulate speed or processivity and fine-tune their activity to a specific cellular task. Here, we describe a phosphorylation event for myosins of class VI (MYO6) in the motor domain, which accelerates its ATPase activity leading to a 4-fold increase in motor speed determined by actin-gliding assays, single molecule mechanics and stopped flow kinetics. We demonstrate that the serine/threonine kinase DYRK2 phosphorylates MYO6 at S267 in vitro. Single-molecule optical-tweezers studies at low load reveal that S267-phosphorylation results in faster nucleotide-exchange kinetics without change in the working stroke of the motor. The selective increase in stiffness of the acto-MYO6 complex when proceeding load-dependently into the nucleotide-free rigor state demonstrates that S267-phosphorylation turns MYO6 into a stronger motor. Finally, molecular dynamic simulations of the nucleotide-free motor reveal an alternative interaction network within insert-1 upon phosphorylation, suggesting a molecular mechanism, which regulates insert-1 positioning, turning the S267-phosphorylated MYO6 into a faster motor.


Conflict of interest statement

The authors declare no competing interests.

Figures
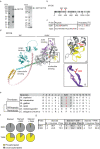
Fig. 1
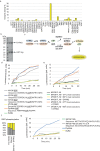
Fig. 1. DYRK2 phosphorylates MYO6 at S267 in the motor domain in vitro.
a SDS-PAGE of GFP-tagged MYO6 immunoprecipitated from RPE cell lysate using GFP nanobodies (right) and endogenous MYO6 immunoprecipitated from A431 cell lysate using MYO6 antibodies (left). A representative image is shown of the experiment performed more than 10 times. The arrows indicate the position of GFP-MYO6 or endogenous MYO6. b MYO6 sequence peptide coverage by mass spectrometry. Identified peptides shown in shades of grey. c Sequence of the identified phosphopeptide LHLSSPDNFR for the S267 and VSLTTRVMLTTAGGTKGTVIK for the T405 and site probabilities for S266 and S267 or T405. d Predicted AlphaFold (v2.0) structure of MYO6: motor domain (grey), neck domain (green/turquoise), neck domain extension (gold), SAH domain (pink) and C-terminal cargo-binding domain (blue). The inset A shows the position of S267 (red) and insert-1 (yellow) and inset B highlights the position of T405 (red) in the surface loop (purple) at the actin binding site. e Conservation of MYO6 at S267 across species. f Pie charts illustrating the percentages of S267 or T405 phosphorylation in MYO6 immunoprecipitated from A431 cells grown in serum-free media (starved) or after stimulation with EGF for 15 min or phorbol 12-myristate 13-acetate (PMA) for 20 min. g Table summarising the percentages of S267 or T405 phosphorylation for MYO6 immunoprecipitated from A431 cells grown in serum-free media (starved) or after stimulation with EGF for 15 min or phorbol 12-myristate 13-acetate (PMA) for 20 min.
Fig. 2
Fig. 2. DYRK2 specifically phosphorylates the MYO6 S267 peptide and the MYO6 full-length protein.
a Activities (HotSpotTM kinase assay) of 31 kinases with respect to the MYO6 peptide, compared with their ideal substrates. b A representative SDS-PAGE image of recombinant DYRK2 purified from E. coli. The purification has been performed several times. c Schematic overview of the ADP-glow assay used to measure DYRK2 activity. d ADP-glowTM kinase assays show that recombinant DYRK2 has ATPase activity with respect to both DYRK-specific substrate and wild-type MYO6 peptide containing the SSP and the ASP sequence, but not to peptides with the mutant SAP or AAP sequence. e DYRK2 shows ATPase activity towards the MYO6 motor domain in vitro. Before the ADP-glow assay full length MYO6 was heat-treated at 37 °C or 60 °C to inactivate endogenous ATPase activity that would interfere with the kinase assay. f MYO6 was immunoprecipitated from A431 cells grown in serum-free media (starved) and incubated with purified DYRK2 for 1 h before determining the level of S267 phosphorylation by mass spectrometry. g DYRK2 does not phosphorylate MYO6 at T405 using the wildtype MYO6 T405 peptide in the ADP-glow assay in vitro.
Fig. 3
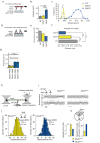
Fig. 3. Increased actin-gliding velocity of MYO6S267E in vitro is achieved by faster nucleotide-exchange rates without change in the W/S of the motor.
a Scheme of the in vitro actin-gliding assay. Monomeric MYO6, immobilised on a nitrocellulose-coated glass surface, translocates rhodamine-phalloidin labelled F-actin in the presence of ATP. b, c Actin-gliding velocity (2 mM ATP, 22 °C) increased 4-fold from 45 nm s−1 (MYO6WT) and 56 nm s−1 (MYO6S267A) to 172 nm s−1 for MYO6S267E. 3 independent experiments from 3 protein purifications were performed; Statistical analysis was performed using an unpaired two-sided t-test. ***P < 0.01. MYO6WT n = 567, average 0.045 µm/s SD ± 0.008283, MYO6S267A n = 557, average 0.0557 µm/s SD ± 0.010488, MYO6S267E n = 569, average 0.1725 µm/s SD ± 0.0345.; d Scheme of the inverted in vitro motility assay. Dimerised MYO6 translocates on fascin-stabilised actin bundles. e Fraction of processive runs of MYO6WT (48.6%), MYO6S267A (36.2%) and MYO6S267E (24%). f Median run-length of MYO6WT, MYO6S267A and MYO6S267E was determined in the inverted motility assay using 3 different flow cells for each protein. Statistical analysis was performed using the Kruskal-Wallis test by ranks, a non-parametric method for testing whether samples originate from the same distribution. It is used for comparing two or more independent samples of equal or different sample sizes. ***P < 0.01. MYO6WT n = 7926, average 0.22 µm SEM ± 0.0047, MYO6S267A n = 3981, average 0.148 µm SEM ± 0.0058 and MYO6S267E n = 2367, average 0.083 µm SEM ± 0.0061. g Actin-gliding velocity (2 mM ATP, 22 °C) for the double mutants MYO6S267A/E plus MYO6T406A/E were determined by the mutation at S267 and independent of the mutation at T405 (S267A+T406A 50 ± 14 nm s−1; S267A+T405E 41 ± 17 nm s−1; S267E+T405A 134 ± 25 nm s−1; S267E+T405E 133 ± 35 nm s−1 mean ± SD, N = 51 filaments for each double mutant, ***P < 0.01, unpaired two-sided t-test; 3 experiments from 3 different protein preparations, Fig. 4). h Scheme of single-molecule mechanical experiments using optical tweezers. i Raw data traces of single MYO6S267A and MYO6S267E molecules interacting with F-actin (single trap-stiffness κtrap ~ 0.02 pN nm−1; 100 µM ATP). MYO6 binding events to actin were detected by changes in the variance of thermal motion. Grey bars indicate actin-attached dwell times. j To determine the working stroke (W/S) for the MYO6S267A and MYO6S267E the displacement distribution of actin-binding events was analysed at 100 µM ATP. k Characterisation of the apparent duty ratio and apparent on-rate of actin binding for the MYO6 A-and E-mutants. Source data are provided as a Source Data file.
Fig. 4
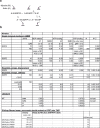
Fig. 4. Kinetics from single molecule mechanical experiments and gliding filament assays on the monomeric MYO6 phospho-mutants.
Kinetics from single molecule mechanical experiments and gliding-filament assay on the monomeric MYO6 phospho-mutants. a Scheme of the chemo-mechanical ATPase cycle of a single motor head. b Rate constants for single molecule MYO6 interactions with F-actin measured using optical tweezers at 22 °C, single trap stiffness ktrap 0.02 pN nm−1. The cumulative dwell time distributions were fitted with a double exponential function, with f(t) = A1 exp(−k1 t) + A2 exp(−k2 t). StdErr = standard error, N = number of binding events in each condition, R2 = regression coefficient for the fit function. The ensemble average displacement data and stiffness data were fitted by single exponentials. The load dependence of the rates k1 and k2 was obtained by fitting, using k = ko exp(−Fd /kBT), with ko rate at zero load, F force, d distance parameter and kBT thermal energy. All single molecule mechanical data were obtained from at least 10 different motor heads in all different conditions. For comparison, values measured here and previously for MYO6WT in single molecule mechanical experiments (SMM) and in bulk solution (stopped-flow, SF) were included in the ‘Literature’ section of the table; (a) Lister et al., (b) Altman et al., (c) DeLaCruz et al., (d) Polypenko et al.. Gliding filament assay for monomeric double mutants S267A/E plus T405A/E; mean velocity and standard deviation SD.
Fig. 5
Fig. 5. Single-molecule mechanics and solution kinetics reveal faster ADP-release and ATP-binding rates for the phosphomimetic MYO6S267E.
a Scheme of the actomyosin ATPase cycle. b Cumulative plots of the actin-attached dwell times for single MYO6S267A (yellow, red) and MYO6S267E (light and dark blue) molecules, measured with 10 µM and 100 µM ATP. Distributions can be described by two exponential components, k1 (ATP-independent) and k2 (ATP-dependent). Mean rates ± StdErr, see Fig. 4; data from > 3 experiments and > 3 different protein preparations. c Ensemble averaging of the displacement events for MYO6S267E, with rates k1 (light grey) and k2 (dark grey) shown in (b), see also Fig. 4. d Scheme of stopped flow experiments. e Time course of ADP displacement from a pyrene-actin.MYO6.ADP complex by ATP excess in the absence of calcium (2 mM ATP, 100 nM MYO6, 200 nM pyrene-actin, 100 µM ADP). Single exponential fits yield ADP dissociation rates (k1) of 3.7 s−1 (MYO6WT, blue), 3.0 s−1 (MYO6S267A, yellow) and 16.3 s−1 (MYO6S267E, blue). f ATP-induced dissociation of pyrene-actin.MYO6 (kobs) in the absence of calcium. k2 values were 20.8 mM−1 s−1 (MYO6WT, grey), 24.2 mM−1 s−1 (MYO6S267A, yellow) and 46.4 mM−1 s−1 (MYO6S267E, blue). Source data are provided as a Source Data file.
Fig. 6
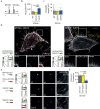
Fig. 6. Intracellular effects of phosphomimic MYO6S267E.
a Scheme highlighting the design of MYO6+, the plus-end directed mutant, in which the insert-2 (reverse gear), lever-arm extension and IQ motif are replaced with six IQ motifs of MYO5. b Filopodia numbers per cell expressing either GFP-tagged MYO6+WT, MYO6+S267A or MYO6+S267E are shown for 3 experiments. Statistical significance was determined using one-way ANOVA and post-hoc testing. ***P < 0.01. MYO6+WT n = 2786, average 65 filopodia/cell SD ± 26.834, MYO6+S267A n = 1824, average 52 filopodia/cell SD ± 9.3, MYO6+S267E n = 6163, average 121 filopodia/cell SD ± 18.62. c Filopodia length was measured in 30–50 cells per construct in 3 experiments expressing either GFP-tagged MYO6+WT, MYO6+S267A or MYO6+S267E. The lengths of filopodia were not significantly different between cells expressing MYO6+S267A n = 50, average 4.72 ± 1.82 SD, MYO6+S267E n = 55, average 5.5 ± 4.43 SD and MYO6+WT n = 56, average 5.05 ± 3.02 SD. The lack of statistical significance was determined using a two-sided t-test. d GFP and actin localisation in HeLa cells transfected with GFP-MYO6+S267A or GFP-MYO6+S267E. The accumulation of either construct in filopodia tips was observed in several independent experiments. A representative image is shown. Scale bar, 10 μm and 5 μm for enlarged images. e HeLa cells co-expressing mCherry-MYO6+WT (red) and either GFP-MYO6+WT, GFP-MYO6+S267A or GFP-MYO6+S267E (green) shown in high-resolution images of single filopodia. This experiment has been performed at least 3 times, representative images are shown. Schemes highlight the relative distribution of mCherry-MYO6+WT and GFP-MYO6+WT, GFP-MYO6+S267A or GFP-MYO6+S267E. Scale bar 5 μm. f Degree of co-localization between mCherry-MYO6+WT and GFP-tagged MYO6+WT, GFP-MYO6+S267A or GFP-MYO6+S267E was determined in 3 independent experiments from confocal images using Pearson’s correlation coefficient with automatic Costes threshold. Statistical significance was determined using a two-sided t-test ***P < 0.01. mCherry-MYO6+WT and GFP-MYO6+WT n = 152, average 0.6569 SD ± 0.1054, mCherry-MYO6+WT and GFP-MYO6+S267A n = 150, average 0.7077 SD ± 0.0961, mCherry-MYO6+WT and GFP-MYO6+ S267E n = 145, average 0.2098 SD ± 0.1123. Source data are provided as a Source Data file.
Fig. 7
Fig. 7. Single molecule stiffness of acto-MYO6S267E/WT through the cycle.
a Schematic of single molecule stiffness measurements. b Schematic and experimental time courses of the ensemble-averaged stiffness of the acto.MYO6 complex measured for MYO6WT and MYO6S267E, see also Fig. 4. c Load-dependent rates k1 and k2 describe the change in stiffness of the acto.MYO6S267E complex at 100 µM ATP at different loads. Light and dark grey circles, k1 and k2 from ≈30 measurements at 100 µM ATP and different loads (mean ± StdErr), see also Fig. 4. Solid lines are fitted using k=ko exp(−Fd/kT), with ko rate at zero load, F force, d distance parameter and kT thermal energy; d1 = 1.8 nm, d2 = 2.8 nm. Extrapolated load-dependent rate k2* at 1 mM ATP (dotted line) and k2** at 2 mM ATP (dashed line). Source data are provided as a Source Data file.
Fig. 8
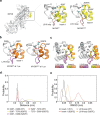
Fig. 8. The S267E mutation disrupts the stability of insert-1.
a MYO6 atomic model used in MD simulations. Insert-1 is highlighted in yellow. Atomic models of the insert-1 domain in WT (left inset) and S267E (right inset) mutant with key residues highlighted after energy minimization. b Snapshots of the insert-1 domain (orange) and 310 loop (magenta) after 1 μs for the WT (replica 2) (left) and S267E (replica 1) (right) trajectories. c Comparison of insert-1 and L310 loop conformations at 0 and 1 μs in WT (replica 2) (left) and S267E (replica 1) (right) mutant trajectories obtained by superposition of residues 260–280 around the insert-1 domain and L310 loop. d, e Probability distribution plots for d the distance between the sidechain oxygens of the indicated pairs of residues and e the RMSD (root mean square deviation) of the insert-1 domain (residues 278–303) and L310 loop (residues 308–312) for the WT and S267E mutant simulations. All distance plots include data from the final 200 ns of all three replicas.

Similar articles

References

    1. Geeves, M. A. The ATPase mechanism of myosin and actomyosin. Biopolymers105, 483–491 (2016). 10.1002/bip.22853 - DOI - PubMed
    1. Foth, B. J., Goedecke, M. C. & Soldati, D. New insights into myosin evolution and classification. Proc. Natl. Acad. Sci. USA103, 3681–3686 (2006). 10.1073/pnas.0506307103 - DOI - PMC - PubMed
    1. Bloemink, M. J. & Geeves, M. A. Shaking the myosin family tree: biochemical kinetics defines four types of myosin motor. Semin. Cell Dev. Biol.22, 961–967 (2011). 10.1016/j.semcdb.2011.09.015 - DOI - PMC - PubMed
    1. Howard, J. Molecular motors: structural adaptations to cellular functions. Nature389, 561–567 (1997). 10.1038/39247 - DOI - PubMed
    1. Menetrey, J. et al. The structure of the myosin VI motor reveals the mechanism of directionality reversal. Nature435, 779–785 (2005). 10.1038/nature03592 - DOI - PMC - PubMed

LinkOut - more resources