. 2024 Oct 1;35(10):ar125.
doi: 10.1091/mbc.E24-05-0209. Epub 2024 Aug 7.

P4-ATPase endosomal recycling relies on multiple retromer-dependent localization signals

Affiliations

P4-ATPase endosomal recycling relies on multiple retromer-dependent localization signals

Mariana Jiménez et al. Mol Biol Cell. .

Abstract

Type IV P-type ATPases (P4-ATPases) are lipid flippases that generate an asymmetric membrane organization essential for cell viability. The five budding yeast P4-ATPases traffic between the Golgi complex, plasma membrane, and endosomes but how they are recycled from the endolysosomal system to the Golgi complex is poorly understood. In this study, we find that P4-ATPase endosomal recycling is primarily driven by the retromer complex and the F-box protein Rcy1. Defects in P4-ATPase recycling result in their mislocalization to the vacuole and a substantial loss of membrane asymmetry. The P4-ATPases contain multiple predicted retromer sorting signals, and the characterization of these signals in Dnf1 and Dnf2 led to the identification of a novel retromer-dependent signal, IPM[ST] that acts redundantly with predicted motifs. Together, these results emphasize the importance of endosomal recycling for the functional localization of P4-ATPases and membrane organization.


Conflict of interest statement

Conflicts of interest: The authors declare no financial conflict of interest.

Figures

FIGURE 1:
FIGURE 1:
Dnf1 is primarily recycled by retromer while Rcy1 and Snx4 significantly contribute to its trafficking. (A) A model of yeast endosome to Golgi retrograde trafficking. (B) Localization of GFP-Dnf1 in retrograde mutants. Orange arrowheads point to GFP-Dnf1 localization at the vacuole limiting membrane. (C) Quantification via Manders’ coefficient of the proportion of GFP-Dnf1 colocalized with FM4-64 (vacuole limiting membrane). For all quantification, data from ∼60 cells from three independent experiments were obtained and analyzed. Comparisons calculated via a one-way ANOVA followed by a Tukey's post hoc test. Colors represent comparison to WT, pairwise comparisons shown with brackets and asterisk. P < 0.01 is ** (orange) and P<0.0001 is **** (green). Error bars represent SD. Scale bars: 5 µm.
FIGURE 2:
FIGURE 2:
Retromer and Rcy1 contribute to Dnf2 recycling out of endosomes. (A) Localization of Dnf2-mNG in retrograde mutants. Orange arrowheads point to the localization of Dnf2-mNG to the vacuole limiting membrane. (B) Quantification via Manders’ coefficient of the proportion of Dnf2-mNG colocalized with FM4-64 (vacuole limiting membrane). For all quantification, data from ∼60 cells from three independent experiments were obtained and analyzed. Comparisons were calculated via a one-way ANOVA followed by Tukey's post hoc test. Colors represent comparison to WT, and pairwise comparisons are shown with brackets and asterisks. Nonsignificant is NS (blue) and P < 0.0001 is **** (green). Error bars represent SD. Scale bars: 5 µm.
FIGURE 3:
FIGURE 3:
Retromer plays a major role in Drs2 recycling with a minor contribution from Rcy1. (A) Localization of GFP-Drs2 in retrograde mutants. Orange arrowheads point to GFP-Drs2 localization at the vacuole limiting membrane. (B) Quantification via Manders’ coefficient of the proportion of GFP-Drs2 colocalized with FM4-64 (vacuole limiting memebrane). For all quantification, data from ∼45 cells from three independent experiments were obtained and analyzed. Comparisons were calculated via a one-way ANOVA followed by Tukey's post hoc test. Colors represent comparison to WT, and pairwise comparisons are shown with brackets and asterisks. Nonsignificant is NS (blue) and P < 0.0001 is **** (green). Error bars represent SD. Scale bars: 5 µm.
FIGURE 4:
FIGURE 4:
AP-1 deletion suppresses Dnf1 mislocalization in rcy1Δsnx4Δ mutant backgrounds. (A) Localization of GFP-Dnf1 in rcy1∆snx4∆ and rcy1∆snx4∆apl4∆ strains expressing WT APL4 or an empty vector (EV). Orange arrowheads point to vacuole limiting membrane GFP-Drs2 localization. Purple arrow points to colocalized dot that is a defect of our microscope. (B) Quantification via Manders’ coefficient of the proportion of GFP-Dnf1 colocalized with FM4-64 (vacuole limiting membrane). For all quantification, data from ∼45 cells from three independent experiments were obtained and analyzed. Comparisons were calculated via a one-way ANOVA followed by Tukey's post hoc test. Pairwise comparisons are shown with brackets and asterisks. P < 0.0001 is ****. Error bars represent SD. Scale bars: 5 µm.
FIGURE 5:
FIGURE 5:
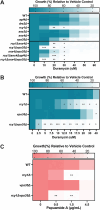
Loss of retromer and Rcy1 leads to disruption of PE and PS plasma membrane asymmetry. (A and B) The blue heat maps display duramycin dose responses at (A) 10 µM interval concentration range and (B) a smaller 2.5 µM interval range in the growth of yeast strains indicated. (C) The pink heat map displays Pap A dose responses at selected concentrations. The data represent growth relative to corresponding yeast strains in the absence of drug. The average of three replicates is plotted and statistical differences of each strain compared with WT at each concentration were calculated with a mixed-effect analysis followed by a Dunnett's post hoc test. P < 0.05 is *, P < 0.01 is **, P < 0.001 is ***.
FIGURE 6:
FIGURE 6:
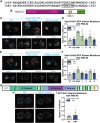
The NT of Dnf1 contains a retromer sorting motif while the Dnf2 NT lacks a recycling signal. (A) Topology of the P4-ATPases with results from the retromer motif pattern matching searches for all the flippases. Dnf3 does not contain any predicted motifs. Bright green labels each transmembrane domain. Other domains are labeled as indicated. (B) Schematic of the Ste13 and the flippase-Ste13 fusion proteins. Orange is Ste13 components, blue signifies the known retromer motif, and white represents flippase components. (C) Localization of GFP-Ste13, GFP-Ste13∆NT, and GFP-flippase-Ste13∆NT fusion proteins in WT and vps35∆ backgrounds. (D) Quantification via Manders’ coefficient of the proportion of GFP-tagged cargo colocalized to FM4-64 (vacuole limiting memebrane). For all quantification, data from ∼30 cells from three independent experiments were obtained and analyzed. Comparisons calculated via a one-way ANOVA followed by Tukey's post hoc test. Colors represent a comparison to WT. P < 0.05 is * (purple) and P < 0.0001 is **** (green). Error bars represent SD. Scale bars: 5 µm.
FIGURE 7:
FIGURE 7:
Mutation of FQFED and FTFND motifs disrupts retromer-dependent recycling of GFP-Dnf1-Ste13 but not GFP-Dnf1. (A) Schematic of the GFP-Dnf1-Ste13 fusion protein with pink labeling FQFED and FTFND motifs. Each phenylalanine is numbered and F>A corresponds to single alanine substitutions as indicated. (B) Localization of GFP-Dnf1-Ste13 fusion protein mutants. (C) Quantification via Manders’ coefficient of the proportion of GFP-Dnf1-Ste13 mutants colocalized with FM4-64 (vacuole limiting membrane). (D) Schematic of GFP-Dnf1 protein with noted FQFED and FTFND motifs in pink. (E) Localization of GFP-Dnf1 with phenylalanine mutations. (F) Quantification via Manders’ coefficient of the proportion of GFP-Dnf1 mutants colocalized to FM4-64 (vacuole limiting membrane). For all quantification, data from ∼30 cells from three independent experiments were obtained and analyzed. Comparisons were calculated via a one-way ANOVA followed by Tukey's post hoc test. Colors represent comparisons to WT. Nonsignificant is NS (blue) and P < 0.0001 is **** (green). Error bars represent SD. Scale bars: 5 µm.
FIGURE 8:
FIGURE 8:
The CTs of Dnf1 and Dnf2 contain a retromer sorting motif. (A) Schematic of Vps10-GFP and Vps10∆CT-GFP. The Dnf1/Dnf2 topology is show as well as the Vps10-Dnf1/2-GFP fusion proteins with either 100%, 75%, 50%, or 25% truncations from the C-terminal side. Purple is the Vps10 component, blue indicates known retromer motifs, and white represents flippase components. (B) Localization of Vps10-GFP and Vps10∆CT-GFP in WT and vps35∆. (C and D) Localization and quantification of Vps10-Dnf1-GFP and listed truncations. (E and F) Localization and quantification of Vps10-Dnf2-GFP and listed truncations. For all quantification, data from ∼45 cells from three independent experiments were obtained and analyzed. Comparisons were calculated via a one-way ANOVA followed by Tukey's post hoc test. Pairwise comparisons are shown with brackets and asterisks. P < 0.0001 is ****. Error bars represent SD. Scale bars: 5 µm.
FIGURE 9:
FIGURE 9:
The CTs of Dnf1 and Dnf2 contain a novel IPM[TS] retromer-dependent sorting motif. (A) Sequence alignment of the 25–50% interval for the Dnf1 CT and Dnf2 CT. (B) Construct used for mutation of potential sorting signals with IPM[TS] motif indicated in orange. (C–F) Localization and quantification of Vps10-Dnf1-GFP (C,D) and Vps10-Dnf2-GFP (E,F) alanine mutation variants in WT cells. (G) Position of IPMT in the Dnf1 construct is indicated in orange. (H and I) Localization and quantification of GFP-Dnf1 CT mutant. Mutation of IPMT to AAAA does not cause Dnf1 mislocalization to the vacuole. For all quantification, data from ∼30 cells from three independent experiments were obtained and analyzed. Comparisons were calculated via a one-way ANOVA followed by Tukey's post hoc test. Colors represent comparisons to WT. Nonsignificant is NS (blue) and P <0. 0001 is **** (green). Error bars represent SD. Scale bars: 5 µm.
FIGURE 10:
FIGURE 10:
Dnf1 uses three retromer sorting motifs for endosomal recycling. (A) Dnf1 diagram with the positions of FXFXD motifs (pink) and IPMT (orange) indicated. (B and C) Localization and quantification of GFP-Dnf1 NT and CT mutations. Double and triple mutations of retromer motifs in Dnf1 cause vacuolar mislocalization. Purple arrow points to colocalized dot that is a defect of our microscope. (D) Final model for recycling pathways traveled by Dnf1 (Blue), Dnf2 (Green), Drs2 (Maroon), and Neo1 (Yellow). Dashed arrow indicated uncertainty. EE – early endosome, LE – late endosome, MVB – multivesicular body. For all quantification, data from ∼30 cells from three independent experiments were obtained and analyzed. Comparisons were calculated via a one-way ANOVA followed by Tukey's post hoc test. Colors represent comparisons to WT. Nonsignificant is NS (blue) and P < 0.0001 is **** (green). Error bars represent SD. Scale bars: 5 µm.

Similar articles

References

    1. Abramson J, Adler J, Dunger J, Evans R, Green T, Pritzel A, Ronneberger O, Willmore L, Ballard AJ, Bambrick J, et al. (2024). Accurate structure prediction of biomolecular interactions with AlphaFold 3. Nature 630, 493–500. - PMC - PubMed
    1. Alder-Baerens N, Lisman Q, Luong L, Pomorski T, Holthuis JCM (2006). Loss of P4 ATPases Drs2p and Dnf3p disrupts aminophospholipid transport and asymmetry in yeast post-Golgi secretory vesicles. Mol Biol Cell 17, 1632–1642. - PMC - PubMed
    1. Aoki Y, Uenaka T, Aoki J, Umeda M, Inoue K (1994). A novel peptide probe for studying the transbilayer movement of phosphatidylethanolamine. J Biochem 116, 291–297. - PubMed
    1. Bai L, You Q, Jain BK, Duan HD, Kovach A, Graham TR, Li H (2020). Transport mechanism of P4 ATPase phosphatidylcholine flippases. Elife 9, e62163. - PMC - PubMed
    1. Baldridge RD, Graham TR (2012). Identification of residues defining phospholipid flippase substrate specificity of type IV P-type ATPases. Proc Natl Acad Sci USA 109, E290–E298. - PMC - PubMed

MeSH terms

Substances

LinkOut - more resources