. 2024 Jul 30:2024:9512251.
doi: 10.1155/2024/9512251. eCollection 2024.

Taz/Tead1 Promotes Alternative Macrophage Activation and Kidney Fibrosis via Transcriptional Upregulation of Smad3

Affiliations

Taz/Tead1 Promotes Alternative Macrophage Activation and Kidney Fibrosis via Transcriptional Upregulation of Smad3

Yizhi Ren et al. J Immunol Res. .

Abstract

Macrophage alternative activation is involved in kidney fibrosis. Previous researches have documented that the transcriptional regulators Yes-associated protein (Yap)/transcriptional coactivator with PDZ-binding motif (Taz) are linked to organ fibrosis. However, limited knowledge exists regarding the function and mechanisms of their downstream molecules in regulating macrophage activation and kidney fibrosis. In this paper, we observed that the Hippo pathway was suppressed in macrophages derived from fibrotic kidneys in mice. Knockout of Taz or Tead1 in macrophages inhibited the alternative activation of macrophages and reduced kidney fibrosis. Additionally, by using bone marrow-derived macrophages (BMDMs), we investigated that knockout of Taz or Tead1 in macrophages impeded both cell proliferation and migration. Moreover, deletion of Tead1 reduces p-Smad3 and Smad3 abundance in macrophages. And chromatin immunoprecipitation (ChIP) assays showed that Tead1 could directly bind to the promoter region of Smad3. Collectively, these results indicate that Tead1 knockout in macrophages could reduce TGFβ1-induced phosphorylation Smad3 via transcriptional downregulation of Smad3, thus suppressing macrophage alternative activation and IRI-induced kidney fibrosis.


Conflict of interest statement

This research was conducted in the absence of any commercial or financial relationships that could be construed as potential conflicts of interest.

Figures
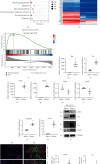
Figure 1
Figure 1
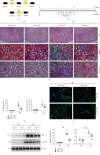
The Hippo signaling pathway is suppressed in fibrotic kidney-derived macrophages. (a) KEGG enrichment pathway bubble diagram of macrophages derived from the spleen and IRI (n = 3). (b) Heatmaps from RNA-seq analysis showing differentially expressed genes in CD115 magnetic bead-sorted monocytes/macrophages from fibrotic kidneys after IRI (n = 3). The expression of Yap, Taz, and Tead in the Hippo signaling pathway was significantly increased. (c) Gene set enrichment analysis (GSEA) for the Hippo signaling pathway in IRI model mice kidneys. (d–k) The mRNA abundance of Yap1 (d), Taz (e), Tead1-4 (f–i), ANKRD1 (j), and CTGF (k). (l) Western blotting showing the expression level of Mst1, Yap, Taz, and Tead1 in CD115 magnetic bead-sorted monocytes/macrophages from fibrotic kidneys after IRI. (m, n) Representative immunofluorescence images (left) and quantitative analysis (right) showing the induction of Tead1 or Taz in F4/80-positive macrophages within the fibrotic kidneys after IRI (n = 5; scale bar, 100 μm). Each point represents the analysis from a randomly selected visual field within a biological sample. CTL, control; IRI, ischemia–reperfusion injury; #p < 0.05. The data are presented as the means ± SDs.
Figure 2
Figure 2
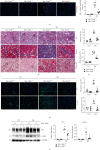
Knockout of Taz in macrophages attenuates IRI-induced kidney fibrosis. (a) Pattern diagram for generating Csf1r-Cre+/− Tazfl/fl mice. (b) Strategy for 4-hydroxytamoxifen injection and IRI surgery in mice. (c) Periodic acid–Schiff (PAS, 100x magnification), Masson's trichrome, and sirius red staining of kidney sections from the indicated groups (n = 6; scale bar, 100 μm). (d) Quantification of the fibrotic area and the percentage of sirius red-positive area. Each point represents the analysis from a randomly selected visual field within a biological sample. (e) Representative immunofluorescence images for FN and α-SMA in IRI kidneys from the indicated groups (n = 6; scale bar, 50 μm). (f) Western blot band (left) and quantitative analysis (right) of FN and α-SMA in IRI kidneys among the indicated groups (n = 4−6).  p < 0.05 versus contralateral kidneys; #p < 0.05 versus Mac-Taz+/+ fibrotic kidneys after IRI. The data are presented as the means ± SDs.
Figure 3
Figure 3
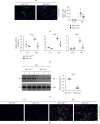
Knockout of Taz in macrophages reduces macrophage infiltration and alternative activation in IRI-induced kidney fibrosis. (a) Representative micrographs of immunofluorescence images for F4/80-positive cells in IRI kidneys among the indicated groups (n = 6; scale bar, 50 μm). Each point represents the analysis from a randomly selected visual field within a biological sample. (b) The mRNA abundance of Arg-1, MR, and Fizz1 in macrophages from contralateral and IRI kidneys at Day 21 after surgery. (c) Western blot assay (left) and quantitative analysis (right) of Arg-1 in IRI kidneys among the indicated groups. (d) Representative immunostaining images for F4/80 and MR in IRI kidneys among the indicated groups. White arrows indicate both F4/80- and MR-positive cells. Scale bar, 50 μm.  p < 0.05 versus Mac-Taz+/+ contralateral kidneys; #p < 0.05 versus Mac-Taz+/+ fibrotic kidneys after IRI. The data are presented as the means ± SDs.
Figure 4
Figure 4
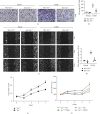
Knockout of Taz in macrophages inhibits macrophage proliferation and migration in BMDMs (a, b). Representative images (a) and quantitative analysis (b) of transwell migration assay in cultured BMDMs treated with or without TGFβ1 (2 ng/mL) for 24 hr among Taz+/+ and Taz−/− groups as indicated (n = 3; scale bar, 100 μm). (c, d) Representative images (c) and quantitative analysis (d) of the wound healing test in cultured BMDMs from different groups as indicated (n = 3; scale bar, 100 μm). Each point represents the analysis from the average of three randomly selected visual fields within a biological sample. (e) Cell counting assay in cultured BMDMs among Taz+/+ and Taz−/− groups as indicated. (f) MTT proliferation assay in cultured BMDMs treated with or without TGFβ1 among the indicated groups.  p < 0.05 versus cultured Taz+/+ BMDMs treated with vehicle; #p < 0.05 versus cultured Taz+/+ BMDMs treated with TGFβ1. The data are presented as the means ± SDs.
Figure 5
Figure 5
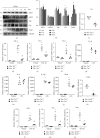
Taz/Tead1 mediates TGFβ1-induced macrophage alternative activation. (a, b) The protein expression level of MST1, MST2, Yap, Taz, and Tead1 in BMDMs that were treated with TGFβ1 (2 ng/mL) for different durations as indicated. (c) Verification of 4-hydroxytamoxifen-induced Taz knockout in cultured BMDMs by qRT-PCR analysis. (d–j) qRT-PCR analysis of Arg-1 (d), Ym1 (e), and Fizz1 (f) in cultured BMDMs treated with or without TGFβ1 (2 ng/mL) for 24 hr among the indicated Taz+/+ and Taz−/− groups. (g–j) qRT-PCR analysis of IL-1β (g), IL-6 (h), IL-12β (i), and iNOS (j) in cultured BMDMs treated with or without LPS (1 μg/mL) among the indicated groups. (k) Verification of 4-hydroxytamoxifen-induced Tead1 knockout in cultured BMDMs by qRT-PCR analysis. (l–n) qRT‒PCR analysis of Arg-1 (l), Ym1 (m), and Fizz1 (n) in cultured BMDMs treated with or without TGFβ1 (2 ng/mL) for 24 hr among the Tead1+/+ and Tead1−/− groups as indicated.  p < 0.05 versus cultured Taz+/+ BMDMs treated with vehicle; #p < 0.05 versus cultured Taz+/+ BMDMs treated with TGFβ1. The data are presented as the means ± SDs.
Figure 6
Figure 6
Knockout of Tead1 in macrophages inhibits macrophage proliferation and migration. (a, b) Ki67 immunofluorescence staining (a) and quantification (b) of Ki67-positive BMDMs treated with or without TGFβ1 (2 ng/mL) for 24 hr among the Tead1+/+ and Tead1−/− groups as indicated (scale bar, 100 μm). (c, d) Representative images (c) and quantitative analysis (d) of the wound healing test in cultured BMDMs from different groups as indicated (n = 3; scale bar, 100 μm). Each point represents the analysis from the average of three randomly selected visual fields within a biological sample.  p < 0.05 versus cultured Tead1+/+ BMDMs treated with vehicle; #p < 0.05 versus cultured Tead1+/+ BMDMs treated with TGFβ1. The data are presented as the means ± SDs.
Figure 7
Figure 7
Knockout of Tead1 in macrophages attenuates IRI-induced kidney fibrosis. (a) Representative confocal immunofluorescence images and quantitative analysis (right) of F4/80 and MR in IRI kidneys among the indicated groups (n = 5). Scale bar, 100 μm. (b) Periodic acid–Schiff (PAS), Masson's trichrome, and sirius red staining of kidney sections from the indicated groups (n = 6; scale bar, 100 μm). (c) Quantification of the fibrotic area and the percentage of sirius red-positive area. (d) Representative immunofluorescence images (left) and quantitative analysis (right) of FN and α-SMA in IRI kidneys from the indicated groups (n = 5−6; scale bar, 100 μm). Each point represents the analysis from a randomly selected visual field within a biological sample. (e) Western blot assay (left) and quantitative analysis (right) of FN and α-SMA in IRI kidneys among the indicated groups.  p < 0.05 versus contralateral kidneys; #p < 0.05 versus Mac-Tead1+/+ fibrotic kidneys after IRI. The data are presented as the means ± SDs.
Figure 8
Figure 8
Knockout of Tead1 reduces p-Smad3/Smad3 abundance in macrophages. (a) Western blot assay for p-Stat3, p-Smad3, and Smad3 expression in BMDMs treated with or without TGFβ1 (2 ng/mL) for 24 hr among the Tead1+/+ and Tead1−/− groups as indicated. (b) Representative confocal immunofluorescence images (left) and quantitative analysis (right) of F4/80 and p-Smad3 in IRI kidneys among the indicated groups (n = 5, scale bar, 100 μm). Each point represents the analysis from a randomly selected visual field within a biological sample. (d, e) qRT-PCR analysis of Smad7 (c) and Smad3 (d) in cultured BMDMs treated with or without TGFβ1 (2 ng/mL) for 24 hr among the Tead1+/+ and Tead1−/− groups as indicated. (e) Predicted Tead1-binding sites in the Smad3 promoter region. (f) ChIP analysis showing that Tead1 binds to the Smad3 promoter region.  p < 0.05 versus cultured Tead1+/+ BMDMs treated with vehicle; #p < 0.05 versus cultured Tead1+/+ BMDMs treated with TGFβ1. The data are presented as the means ± SDs.

Similar articles

References

    1. Mosser D. M., Edwards J. P. Exploring the full spectrum of macrophage activation. Nature Reviews Immunology . 2008;8(12):958–969. doi: 10.1038/nri2448. - DOI - PMC - PubMed
    1. Meng X., Jin J., Lan H. Y. Driving role of macrophages in transition from acute kidney injury to chronic kidney disease. Chinese Medical Journal . 2022;135(7):757–766. doi: 10.1097/CM9.0000000000002100. - DOI - PMC - PubMed
    1. Wu Z., Guan K.-L. Hippo signaling in embryogenesis and development. Trends in Biochemical Sciences . 2021;46(1):51–63. doi: 10.1016/j.tibs.2020.08.008. - DOI - PMC - PubMed
    1. Mannaerts I., Leite S. B., Verhulst S., et al. The Hippo pathway effector YAP controls mouse hepatic stellate cell activation. Journal of Hepatology . 2015;63(3):679–688. doi: 10.1016/j.jhep.2015.04.011. - DOI - PubMed
    1. Szeto S. G., Narimatsu M., Lu M., et al. YAP/TAZ are mechanoregulators of TGF-β-smad signaling and renal fibrogenesis. Journal of the American Society of Nephrology . 2016;27(10):3117–3128. doi: 10.1681/ASN.2015050499. - DOI - PMC - PubMed

MeSH terms

LinkOut - more resources