Pathogenic gene connections in type 2 diabetes and non-alcoholic fatty liver disease: a bioinformatics analysis and mouse model investigations experiments
- PMID: 39107295
- PMCID: PMC11303809
- DOI: 10.1038/s41387-024-00323-0
Pathogenic gene connections in type 2 diabetes and non-alcoholic fatty liver disease: a bioinformatics analysis and mouse model investigations experiments
Abstract
Background: Type 2 diabetes (T2D) and non-alcoholic fatty liver disease (NAFLD) are prevalent metabolic disorders with overlapping pathophysiological mechanisms. A comprehensive understanding of the shared molecular pathways involved in these conditions can advance the development of effective therapeutic interventions.
Methods: We used two datasets sourced from the Gene Expression Omnibus (GEO) database to identify common differentially expressed genes (DEGs) between T2D and NAFLD. Subsequently, we conducted Gene Ontology (GO) and Kyoto Encyclopedia of Genes and Genomes (KEGG) analyses to identify the enriched biological processes and signaling pathways. In addition, we performed a protein-protein interaction (PPI) network analysis to identify hub genes with pivotal roles. To validate our findings, we established a type 2 diabetic mouse model with NAFLD.
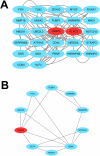
Results: Our analysis identified 53 DEGs shared between T2D and NAFLD. Enrichment analysis revealed their involvement in signal transduction, transcriptional regulation, and cell proliferation as well as in the ferroptosis signaling pathways. PPI network analysis identified ten hub genes, namely CD44, CASP3, FYN, KLF4, HNRNPM, HNRNPU, FUBP1, RUNX1, NOTCH3, and ANXA2. We validated the differential expression of FYN, HNRNPU, and FUBP1 in liver tissues of a type 2 diabetic mouse model with NAFLD.
Conclusions: Our study offers valuable insights into the shared molecular mechanisms underlying T2D and NAFLD. The identified hub genes and pathways present promising prospects as therapeutic targets to address these prevalent metabolic disorders.
© 2024. The Author(s).
Conflict of interest statement
The authors declare no competing interests.
Figures


Similar articles
-
Identification of common signature genes and pathways underlying the pathogenesis association between nonalcoholic fatty liver disease and heart failure.Front Immunol. 2024 Sep 16;15:1424308. doi: 10.3389/fimmu.2024.1424308. eCollection 2024. Front Immunol. 2024. PMID: 39351239 Free PMC article.
-
Diagnostic role of SPP1 and collagen IV in a rat model of type 2 diabetes mellitus with MASLD.Sci Rep. 2024 Jun 17;14(1):13943. doi: 10.1038/s41598-024-64857-0. Sci Rep. 2024. PMID: 38886539 Free PMC article.
-
Identification of genes and key pathways underlying the pathophysiological association between nonalcoholic fatty liver disease and atrial fibrillation.BMC Med Genomics. 2022 Jul 5;15(1):150. doi: 10.1186/s12920-022-01300-1. BMC Med Genomics. 2022. PMID: 35790963 Free PMC article.
-
Microarray-based Detection of Critical Overexpressed Genes in the Progression of Hepatic Fibrosis in Non-alcoholic Fatty Liver Disease: A Protein-protein Interaction Network Analysis.Curr Med Chem. 2024;31(23):3631-3652. doi: 10.2174/0929867330666230516123028. Curr Med Chem. 2024. PMID: 37194229
-
Elucidation of the molecular mechanism of type 2 diabetes mellitus affecting the progression of nonalcoholic steatohepatitis using bioinformatics and network pharmacology: A review.Medicine (Baltimore). 2024 Sep 13;103(37):e39731. doi: 10.1097/MD.0000000000039731. Medicine (Baltimore). 2024. PMID: 39287256 Free PMC article. Review.
References
-
- Elliott P. Joslin. The Prevention of Diabetes Mellitus. JAMA 2021;325:190. - PubMed
Publication types
MeSH terms
Substances
Grants and funding
- 2022J05298/Natural Science Foundation of Fujian Province (Fujian Provincial Natural Science Foundation)
- 2023J05049/Natural Science Foundation of Fujian Province (Fujian Provincial Natural Science Foundation)
- 82301227/National Natural Science Foundation of China (National Science Foundation of China)
LinkOut - more resources
Full Text Sources
Medical
Research Materials
Miscellaneous

