. 2024 Aug 1;4(8):2242-2254.
doi: 10.1158/2767-9764.CRC-24-0016.

ANGPTL4 Suppresses Clear Cell Renal Cell Carcinoma via Inhibition of Lysosomal Acid Lipase

Affiliations

ANGPTL4 Suppresses Clear Cell Renal Cell Carcinoma via Inhibition of Lysosomal Acid Lipase

Zeng Jin et al. Cancer Res Commun. .

Abstract

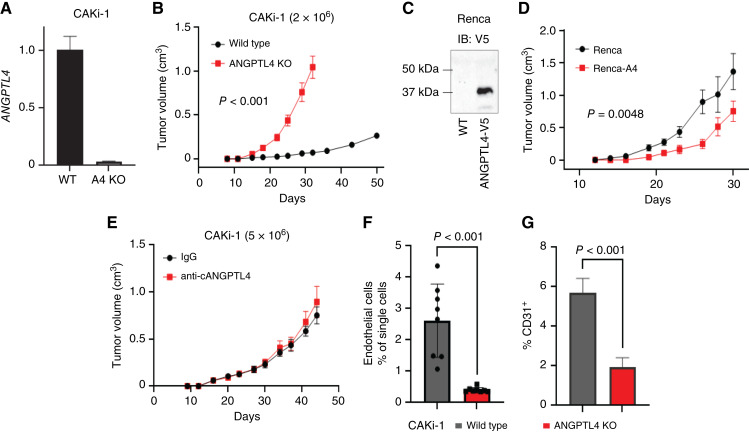
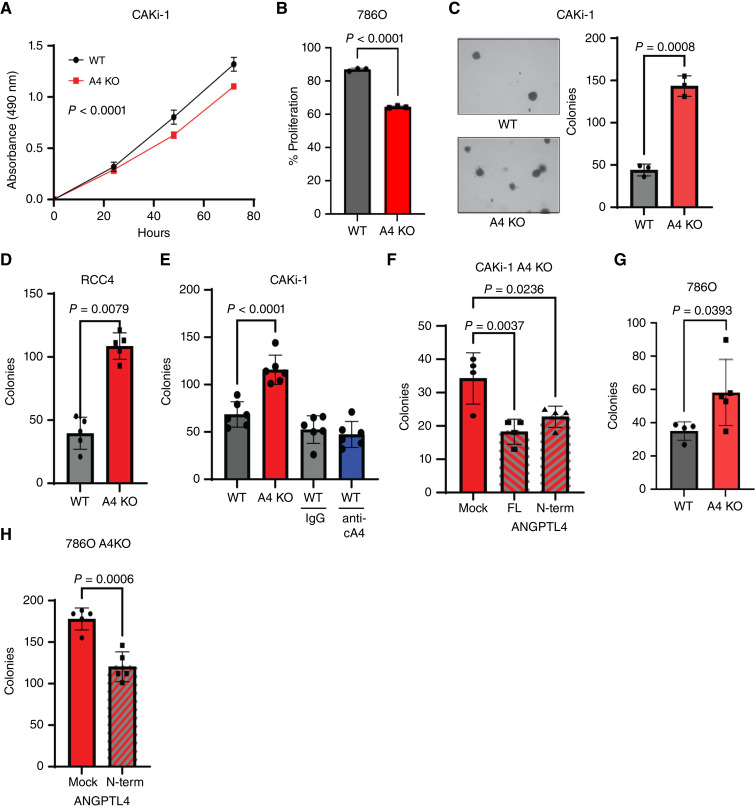
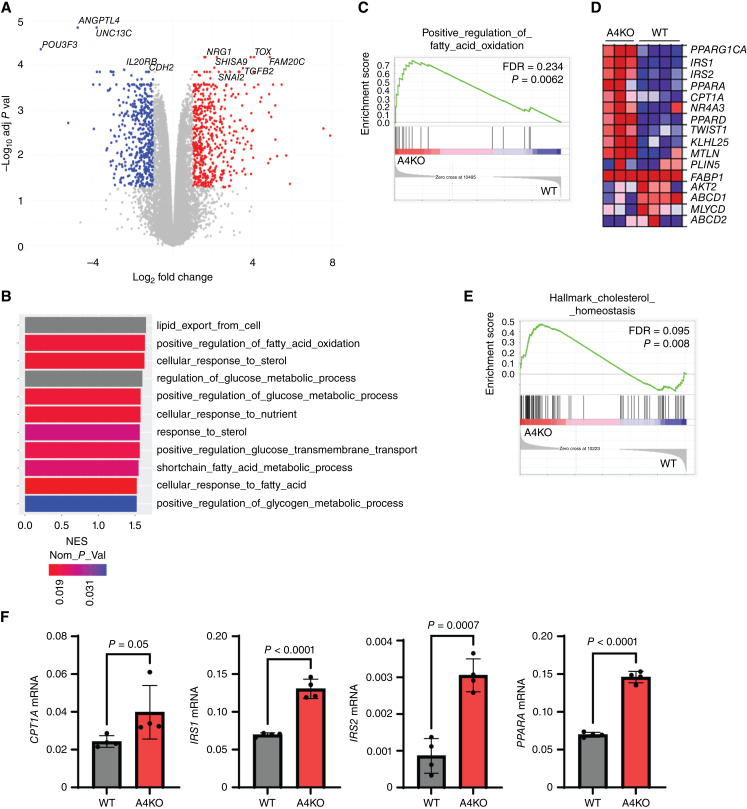
Renal cell carcinoma (RCC), the most common form of kidney cancer, is a heterogeneous disease with clear cell RCC (ccRCC) being the most prevalent and aggressive subtype. While most ccRCC tumors have elevated expression of angiopoietin-like4 (ANGPTL4), in our study we identified a significant subset of patients whose cancers show no increase in ANGPTL4 expression. These patients have a worse prognosis compared to the patients with high expression of ANGPTL4. These ANGPTL4-low cancers are characterized by the increased frequency of wild-type Von Hippel-Lindau(WT VHL), a gene that is commonly mutated in ccRCC, and an enrichment for genes associated with lipid metabolism. Using RCC tumor models with WT VHL, we demonstrate that ANGPTL4 behaves as a tumor suppressor. The loss of ANGPTL4 in ccRCC cell lines results in increased tumor growth and colony formation in a lysosomal acid lipase (LAL)-dependent manner, a phenotype rescued by the expression of N-terminus ANGPTL4. At the mechanistic level, the loss of ANGPTL4 increases LAL activity in ccRCC cells. These data suggest that ANGPTL4 enacts its tumor-suppressive effects in ccRCC by regulating LAL activity. Importantly, the identified patient cohort with low ANGPTL4 expression may exhibit increased reliance on lipid metabolism, which can be a point of target for future therapy.

Significance: Our data indicate angiopoietin-like 4 (ANGPTL4) acts as a tumor suppressor in clear cell renal cell carcinoma via regulating lipid metabolism and identifies a cohort of patients with lower expression of ANGPTL4 that are correlated with shorter survival.


Conflict of interest statement

B.S. Davies reports grants from National Institutes of Health during the conduct of the study. W. Zhang reports a patent to PCT/US2020/057964 issued. R. Kolb reports grants from National Institute of Health, National Institute of Health, and National Institute of Health during the conduct of the study; in addition, R. Kolb has a patent number 62927289 issued. No disclosures were reported by the other authors.

Figures

Figure 1
Figure 1
Subset of patients with ccRCC with low expression of ANGPTL4 is associated with shorter survival and lipid metabolism. A,ANGPTL4 expression in the indicated cancer types. Data generated from TCGA pan-cancer normalized RNAseq data generated using the Human Protein Atlas. B,ANGPTL4 mRNA expression in TCGA ccRCC samples compared to normal kidney tissue samples. C,ANGPTL4 expression in the indicated human ccRCC cell lines or immortalized human proximal tubule cells (HK-2) relative to GAPDH. D, Distribution of ANGPTL4 mRNA levels in TCGA ccRCC (KIRC) samples. Graph depicts the number of samples within the indicated robust Z-score range. A subset of patients with significantly lower ANGPTL4 expression (robust Z-score ≤ −3.5) is indicated as ANGPTL4-low distinguishable from the rest of the samples labeled as bulk samples. E, Kaplan–Meier curve depicting overall survival (OS) of ccRCC samples with low expression of ANGPTL4 compared to the rest of the sample. F, GSEA of TCGA samples comparing ANGPTL4-low (robust Z ≤ −3.5) and bulk samples (robust Z > −3.5). Graph depicts the nominal enrichment score (NES) of indicated gene sets enriched in the indicated group. The FDR is indicated. G and H, Enrichment plot for the indicated gene set from the GSEA in F.
Figure 2
Figure 2
ANGPTL4 suppresses tumor growth of RCC cells with wild-type VHL. A, Graph depicts expression of ANGPTL4 in CAKi-1 WT or A4KO cells relative to PPIA as a fold change compared to WT. B, 2 × 10⁶ of the indicated CAKi-1 cells were implanted into the flank of NOD-SCID/IL2RG (NSG) mice. Graph depicts the average tumor volume ± SEM. Two-way ANOVA was done to determine significance (n = 8 for both groups). C, Renca mouse RCC cells were stably selected for expression of human ANGPTL4-V5. Immunoblot for V5 in the indicated Renca cells. D, Renca or Renca cells expressing human ANGPTL4-V5 (Renca-A4) from (C) were implanted into the mammary gland of Balb/C mice. Graph depicts the average tumor volume ± SEM. Two-way ANOVA was done to determine significance (n = 8 WT, n = 7 Renca-A4). E, 5 × 10⁶ of CAKi-1 cells were implanted into the flank of NSG mice. CAKi-1 tumor–bearing mice were treated with 200 μg anti-cANGPTL4 antibody or rat IgG isotype control twice weekly starting at day 14. Graph depicts the average tumor volume ± SEM. F, Graph depicts the number of CD31+/CD34+ endothelial cells ± SD as a % of single cells from the indicated tumor from (B). Welch’s t test was done to determine significance. G, Tumor sections from the indicated tumors in B, were stained for CD31. Graph depicts the average CD31+ staining as a % of total area ± SD. At least three images from three samples were used for each group. Welch’s t test was done to determine significance.
Figure 3
Figure 3
nANGPTL4 suppresses ccRCC colony formation. A, MTS assay of the indicated CAKi-1 cells. Graph depicts the average absorbance ± SD. Two-way ANOVA was done to determine significance (n = 6 all groups). B, The indicated 786O cells were incubated with CSFE and analyzed by flow cytometry. The graph depicts the average % proliferation of the cells ± SD. Welch’s t test was done to determine significance. C, Soft agar colony assay. The indicated CAKi-1 cells were cultured on soft agar for 30 days and the number of colonies per well was counted. Left: representative images of colonies from the indicated cells (10× magnification). Right: graph depicts the average number of colonies ± SD. Welch’s t test was used to determine significance. D, The indicated RCC4 cell line was incubated in nonadherent conditions for 72 hours. The graph depicts the average number of colonies/well ± SD. Welch’s t test was done to determine significance. E, Graph depicts the average number of colonies/well of the indicated CAKi-1 cells treated as indicated with rat IgG or anti-cANGPTL4 ± SD. One-way ANOVA with Dunnett’s test to correct for multiple comparisons was done to determine significance. F, Graph depicts the average number of colonies per well ± SD. of CAKi-1 A4 KO cells transfected with full length (FL), N-terminus or mock transfected as indicated. One-way ANOVA with Dunnett’s test to correct for multiple comparisons was done to determine significance. G, Graph depicts the average number of colonies/well of the indicated 786O cells ± SD. Welch’s t test was done to determine significance. H, Graph depicts the average number of colonies/well ± SD of 786O A4 KO cells transfected with N-terminus or mock transfected as indicated. One-way ANOVA with Dunnett’s test to correct for multiple comparisons was done to determine significance.
Figure 4
Figure 4
Loss of ANGPTL4 is associated with enrichment for lipid metabolism genes. A, Volcano plot for CAKi1 A4KO versus WT cells. Genes with an absolute value log2 fold change ≥1 and an adjusted P value of ≤0.05 are indicated. Genes upregulated in A4 KO cells are red and genes downregulated in A4KO cells are blue. B, GSEA was performed for CAKi-1 A4KO and WT cells. Graph depicts the nominal enrichment score (NES) of gene sets related to metabolism that were enriched—had a FDR <0.25—with A4KO cells. The nominal P value is indicated by the heat bar. Gray bars had a nominal P value that was lower than the threshold for the package used and thus had a value of 0. C, Enrichment plot for the indicated gene set from the GSEA analysis in B. The FDR and nominal P value are indicated. D, Heatmap of the genes in the gene set from C, for CAKi-1 A4KO and WT cells. E, GSEA analysis was performed for 786O A4KO and WT cells. Enrichment plot for the indicated gene set showing enrichment in A4KO cells. The FDR and nominal P value are indicated. F, Graphs depict the average mRNA expression relative to PPIA of the indicated genes in CAKi-1 WT and A4KO cells ± SD. Welch’s t test was done to determine significance.
Figure 5
Figure 5
nANGPTL4 inhibits LAL to suppress ccRCC colony formation. A–C, Total intracellular lipids in the indicated CAKi-1 or 786O cells were stained with BODIPY 493/503 and the median fluorescence intensity (MFI) was determined. A, Representative histogram is presented for BODIPY staining of CAKi WT (gray) and A4KO (red) cells. B and C, Graph depicts the average BODIPY 493/503 MFI of the indicated CAKi-1 (B) and 786O (C) cells ± SD. Welch’s t test was used to determine significance. D, CAKi-1 WT and A4KO cells were incubated with BODIPY FL C12 and analyzed by flow cytometry to measure lipid uptake. Left: representative histogram showing BODIPY FL C12 fluorescent intensity of WT (gray) and A4KO (red) cells. Right: graph depicts the average BODIPY FL C12 MFI ± SD in the indicated 786O cells. Welch’s t test was done to determine significance. E, LAL activity was determined by incubating the indicated cells with lysolive-green and measuring the fluorescence Intensity by flow cytometry. Left: representative histogram depicting intensity of lysolive-green fluorescence in CAKi-1 WT (gray) and A4KO (red) cells. Right: graph depicts the average lysolive-green MFI as a fold change compared to WT ± SD. Welch’s t test was done to determine significance. F, Graph depicts the average lysolive-green MFI as a fold change compared to WT ± SD. Welch’s t test was done to determine significance. G, CAKi-1 A4KO cells were mock transfected or transfected with full length (FL) or N-terminus (N-term) ANGPTl4 and incubated with lysolive-green. Left representative histrogram depicting lysolive-green fluorescence intensity in the indicated cell lines. The peak fluorescence intensity in mock transfected cells is indicated by the black line. Right: Average lysolive-green MFI as a fold changed compared to mock transfected ± SD. One-way ANOVA with Dunnett’s test to correct for multiple comparisons was done to determine significance. H, Graph depicts the average number of colonies/well of the indicated CAKi-1 cells grown in the presence or absence of the LAL inhibitor lalistat 1. One-way ANOVA with Dunnett’s test to correct for multiple comparisons was done to determine significance. I, Graph depicts the average number of colonies/well of the indicated 786O cells grown in the presence or absence of the LAL inhibitor lalistat 1. One-way ANOVA with Dunnett’s test to correct for multiple comparisons was done to determine significance. J, CAKi-1 A4KO cells were transfected with siRNA targeting LIPA (gene that encodes LAL) or nontargeting control siRNA (−). Cells were plated in non-adherent conditions, cultured for 72 hours and the number of colonies was counted. Top: western blot for LAL at the indicated time point post transfection. GAPDH blot is used as a loading control. Bottom: graph depicts the average number of colonies per well ± SD. Welch’s t test was done to determine significance. K, CAKi-1 A4KO cells were transfected with a lentivirus plasmid containing CRISPR-Cas9 and one of the three guide RNAs targeting LIPA. After selection total lysates were collected and a Western blot for LAL and GAPDH, as a loading control, was done. Arrow indicates LAL band. L, The indicated CAKi-1 cells (A4KO LIPA KO cells are g2 cells from K) were cultured in nonadherent conditions for 72 hours and the number of colonies was counted. Graph depicts the number of colonies per well ± SD. One-way ANOVA with Dunnett’s test to correct for multiple comparisons was done to determine significance. M, The indicated CAKi-1 cells were cultured for 72 hours, stained with annexin V-FITC and PI and analyzed by flow cytometry. Graph depicts the % of FITC-positive cells as a percentage of single cells ± SD. One-way ANOVA with Dunnett’s test to correct for multiple comparisons was done to determine significance.

Similar articles

References

    1. Padala SA, Barsouk A, Thandra KC, Saginala K, Mohammed A, Vakiti A, et al. . Epidemiology of renal cell carcinoma. World J Oncol 2020;11:79–87. - PMC - PubMed
    1. Hsieh JJ, Purdue MP, Signoretti S, Swanton C, Albiges L, Schmidinger M, et al. . Renal cell carcinoma. Nat Rev Dis Primers 2017;3:17009. - PMC - PubMed
    1. Padala SA, Kallam A. Clear cell renal carcinoma. StatPearls. Treasure Island (FL): StatPearls Publishing; 2023. - PubMed
    1. Young AC, Craven RA, Cohen D, Taylor C, Booth C, Harnden P, et al. . Analysis of VHL gene alterations and their relationship to clinical parameters in sporadic conventional renal cell carcinoma. Clin Cancer Res 2009;15:7582–92. - PMC - PubMed
    1. Sanchez DJ, Simon MC. Genetic and metabolic hallmarks of clear cell renal cell carcinoma. Biochim Biophys Acta Rev Cancer 2018;1870:23–31. - PMC - PubMed

Publication types

MeSH terms

Substances