Single-cell peripheral immunoprofiling of lewy body and Parkinson's disease in a multi-site cohort
- PMID: 39090623
- PMCID: PMC11295553
- DOI: 10.1186/s13024-024-00748-2
Single-cell peripheral immunoprofiling of lewy body and Parkinson's disease in a multi-site cohort
Abstract
Background: Multiple lines of evidence support peripheral organs in the initiation or progression of Lewy body disease (LBD), a spectrum of neurodegenerative diagnoses that include Parkinson's Disease (PD) without or with dementia (PDD) and dementia with Lewy bodies (DLB). However, the potential contribution of the peripheral immune response to LBD remains unclear. This study aims to characterize peripheral immune responses unique to participants with LBD at single-cell resolution to highlight potential biomarkers and increase mechanistic understanding of LBD pathogenesis in humans.
Methods: In a case-control study, peripheral mononuclear cell (PBMC) samples from research participants were randomly sampled from multiple sites across the United States. The diagnosis groups comprise healthy controls (HC, n = 159), LBD (n = 110), Alzheimer's disease dementia (ADD, n = 97), other neurodegenerative disease controls (NDC, n = 19), and immune disease controls (IDC, n = 14). PBMCs were activated with three stimulants (LPS, IL-6, and IFNa) or remained at basal state, stained by 13 surface markers and 7 intracellular signal markers, and analyzed by flow cytometry, which generated 1,184 immune features after gating.
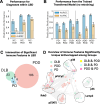
Results: The model classified LBD from HC with an AUROC of 0.87 ± 0.06 and AUPRC of 0.80 ± 0.06. Without retraining, the same model was able to distinguish LBD from ADD, NDC, and IDC. Model predictions were driven by pPLCγ2, p38, and pSTAT5 signals from specific cell populations under specific activation. The immune responses characteristic for LBD were not associated with other common medical conditions related to the risk of LBD or dementia, such as sleep disorders, hypertension, or diabetes.
Conclusions and relevance: Quantification of PBMC immune response from multisite research participants yielded a unique pattern for LBD compared to HC, multiple related neurodegenerative diseases, and autoimmune diseases thereby highlighting potential biomarkers and mechanisms of disease.
Keywords: Alzheimer’s Disease; Biomarkers; Dementia; Inflammation; Parkinson’s Disease.
© 2024. The Author(s).
Conflict of interest statement
The authors declare no competing interests.
Figures


Similar articles
-
Brain-derived and in vitro-seeded alpha-synuclein fibrils exhibit distinct biophysical profiles.Elife. 2024 Nov 25;13:RP92775. doi: 10.7554/eLife.92775. Elife. 2024. PMID: 39584804 Free PMC article.
-
Localized Pantothenic Acid (Vitamin B5) Reductions Present Throughout the Dementia with Lewy Bodies Brain.J Parkinsons Dis. 2024;14(5):965-976. doi: 10.3233/JPD-240075. J Parkinsons Dis. 2024. PMID: 38820022 Free PMC article.
-
Sensitivity and specificity of a seed amplification assay for diagnosis of multiple system atrophy: a multicentre cohort study.Lancet Neurol. 2024 Dec;23(12):1225-1237. doi: 10.1016/S1474-4422(24)00395-8. Lancet Neurol. 2024. PMID: 39577923
-
Investigation of Inflammation in Lewy Body Dementia: A Systematic Scoping Review.Int J Mol Sci. 2023 Jul 28;24(15):12116. doi: 10.3390/ijms241512116. Int J Mol Sci. 2023. PMID: 37569491 Free PMC article.
-
Depressing time: Waiting, melancholia, and the psychoanalytic practice of care.In: Kirtsoglou E, Simpson B, editors. The Time of Anthropology: Studies of Contemporary Chronopolitics. Abingdon: Routledge; 2020. Chapter 5. In: Kirtsoglou E, Simpson B, editors. The Time of Anthropology: Studies of Contemporary Chronopolitics. Abingdon: Routledge; 2020. Chapter 5. PMID: 36137063 Free Books & Documents. Review.
References
-
- Weintraub D. What’s in a name? The time has come to unify Parkinson’s disease and dementia with Lewy bodies. Mov Disord. 2023;38:1977–81. - PubMed
Publication types
MeSH terms
Substances
LinkOut - more resources
Full Text Sources
Medical

