. 2024 Aug 20;98(8):e0085824.
doi: 10.1128/jvi.00858-24. Epub 2024 Jul 30.

Japanese encephalitis virus NS5 protein interacts with nucleolin to enhance the virus replication

Affiliations

Japanese encephalitis virus NS5 protein interacts with nucleolin to enhance the virus replication

Arundhati Deb et al. J Virol. .

Abstract

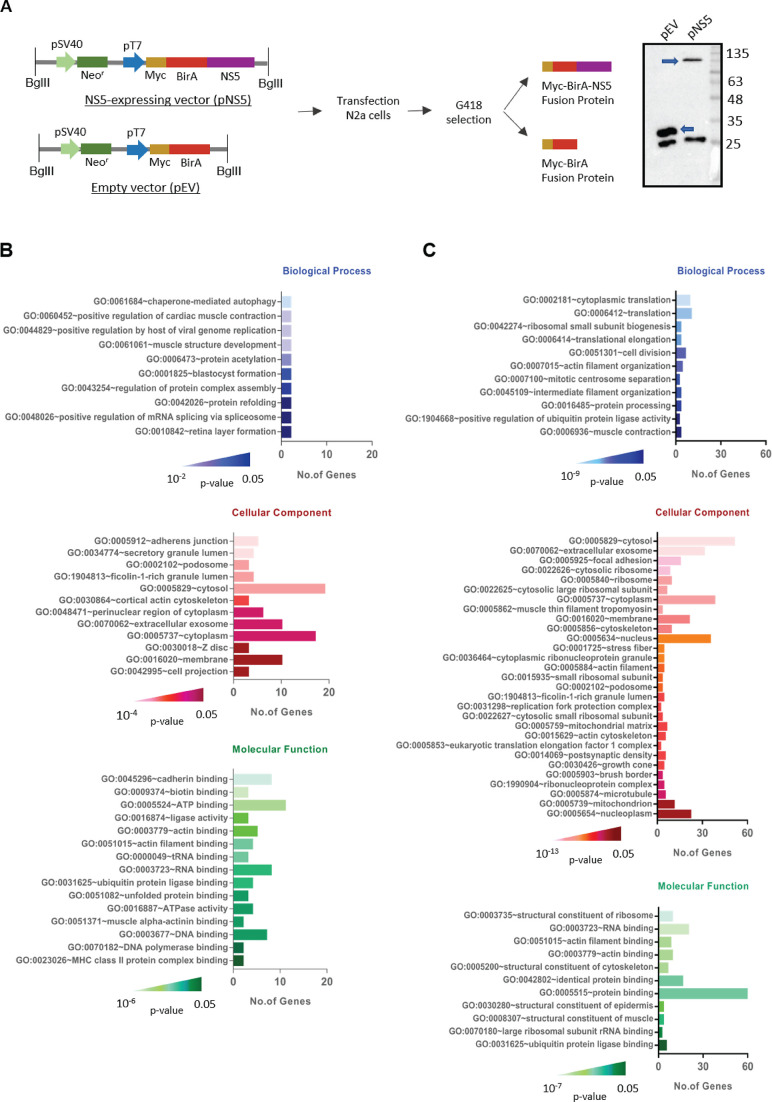
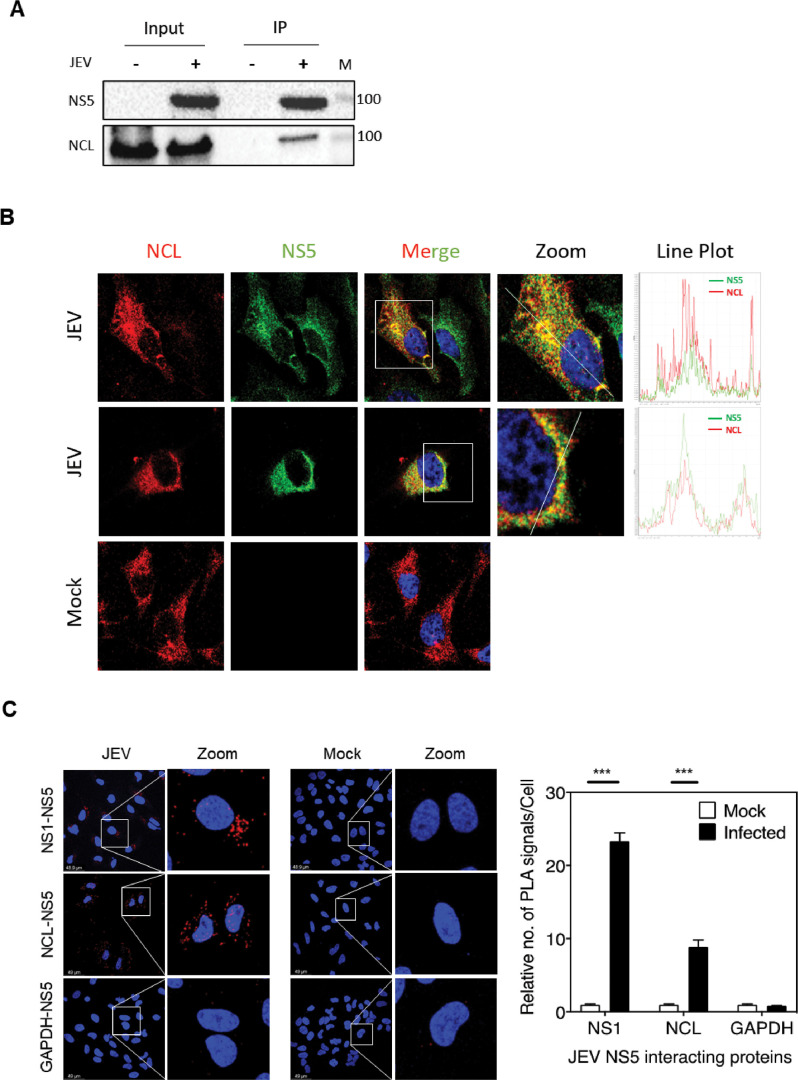
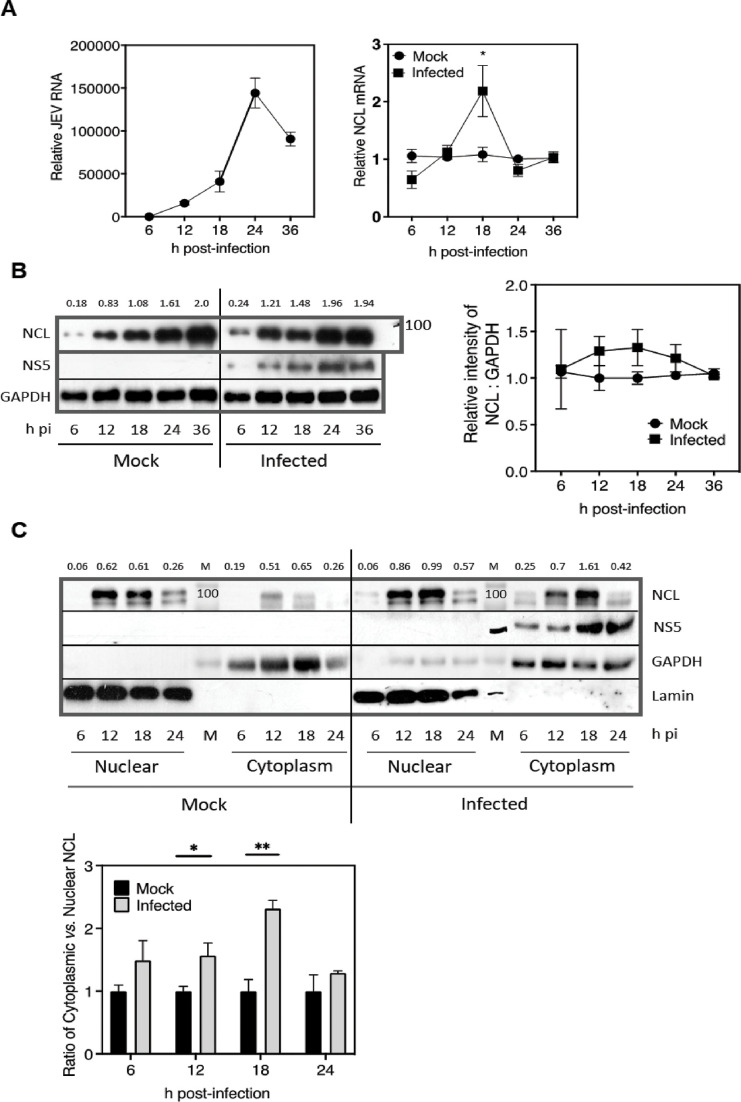
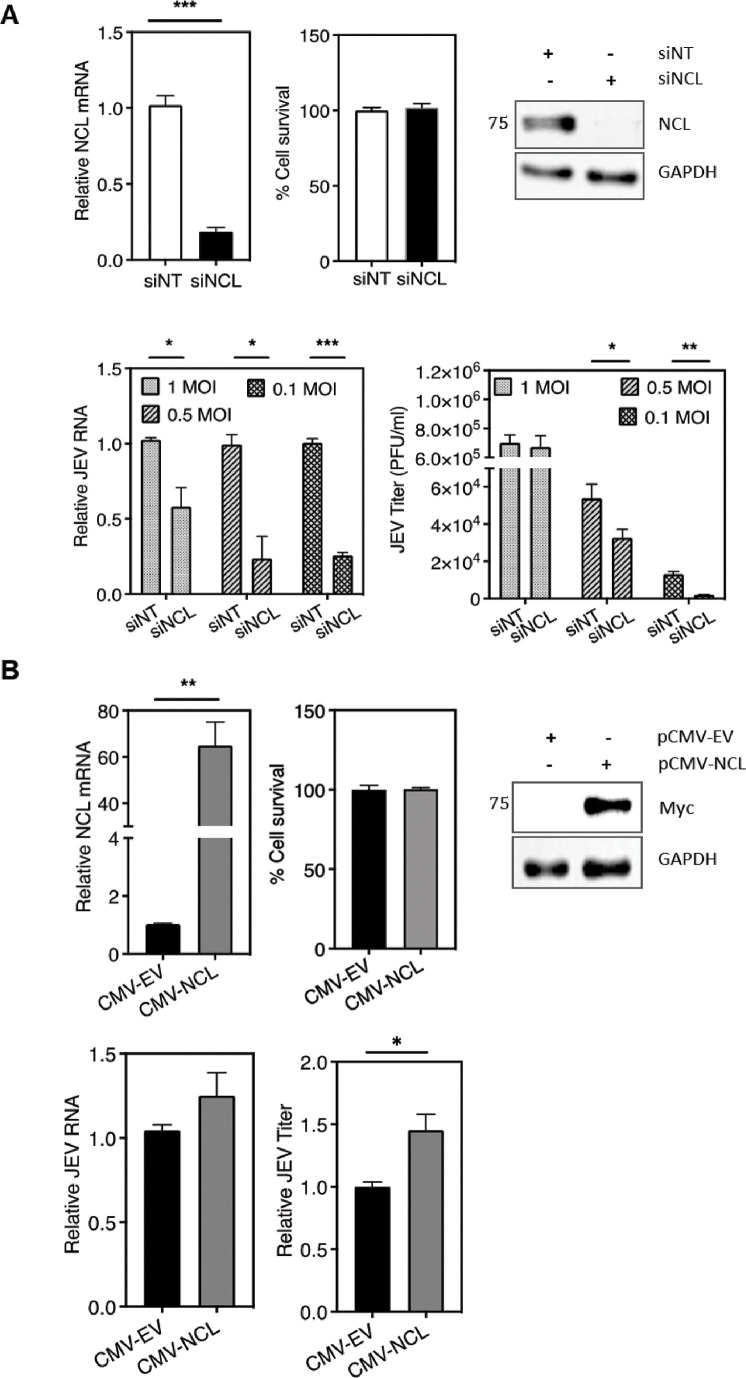
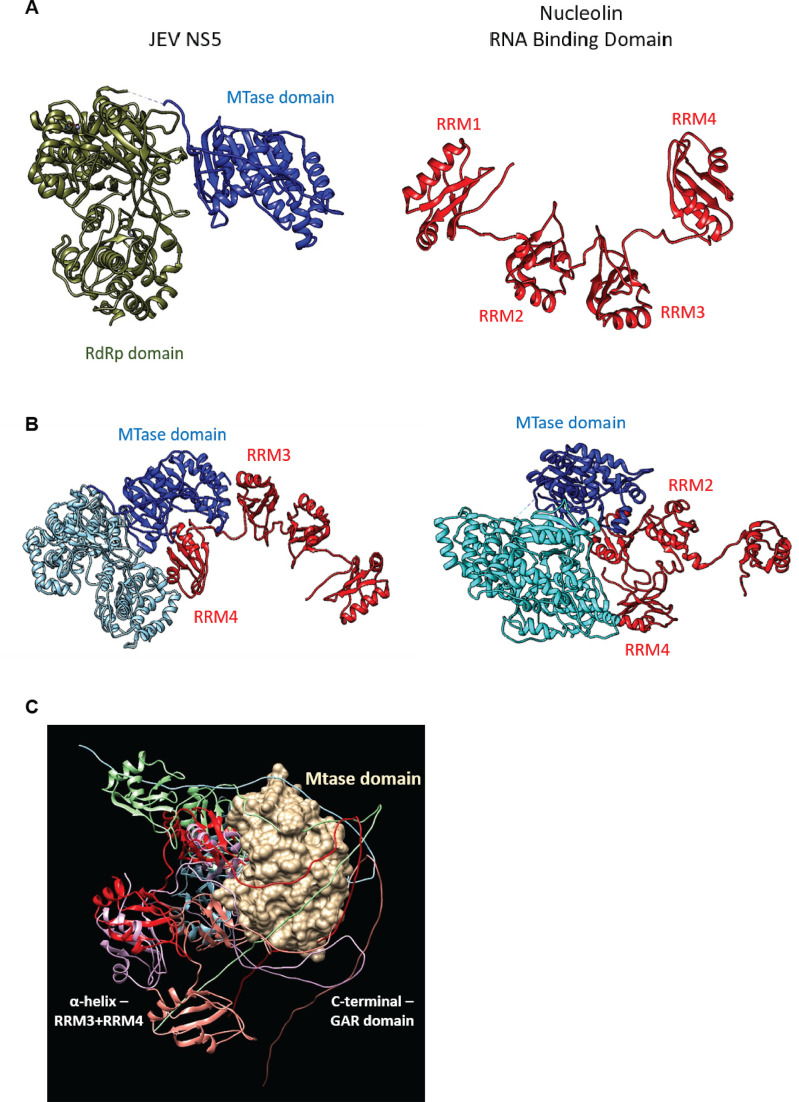
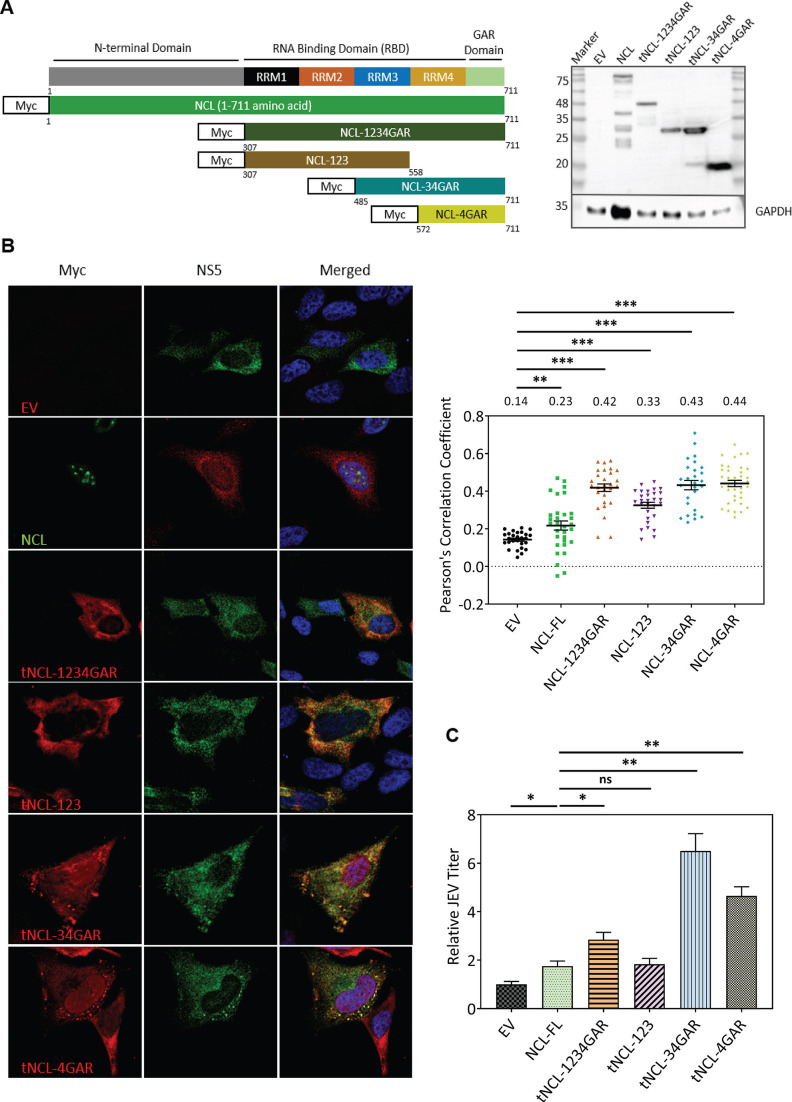
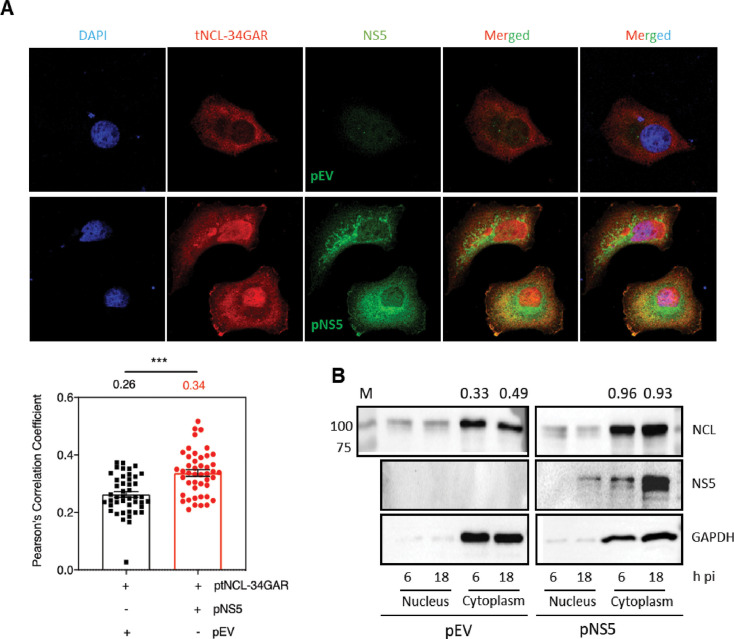
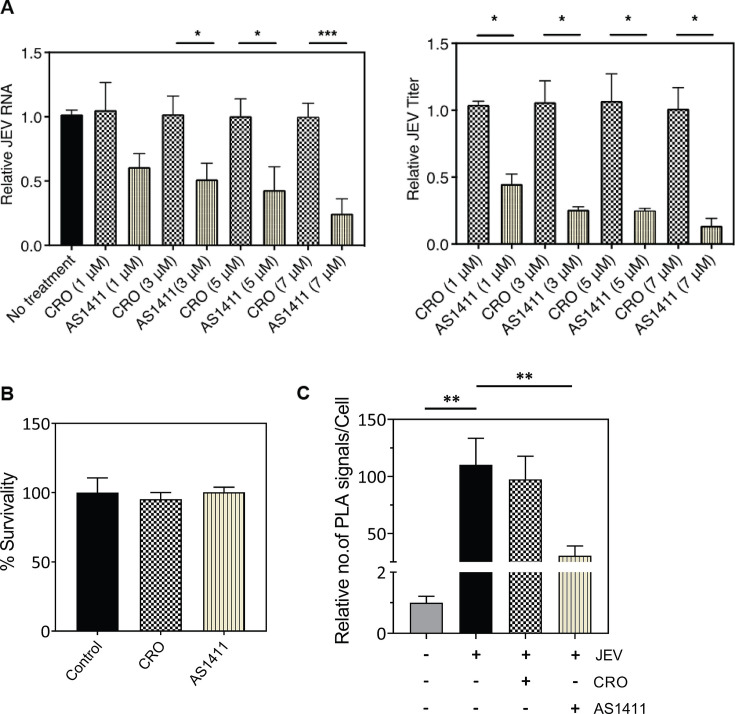
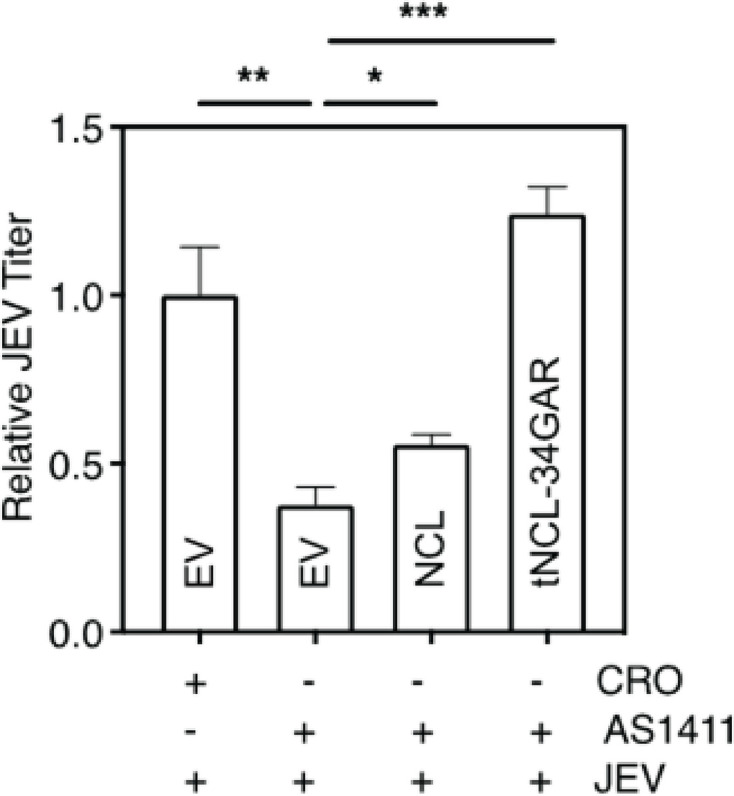
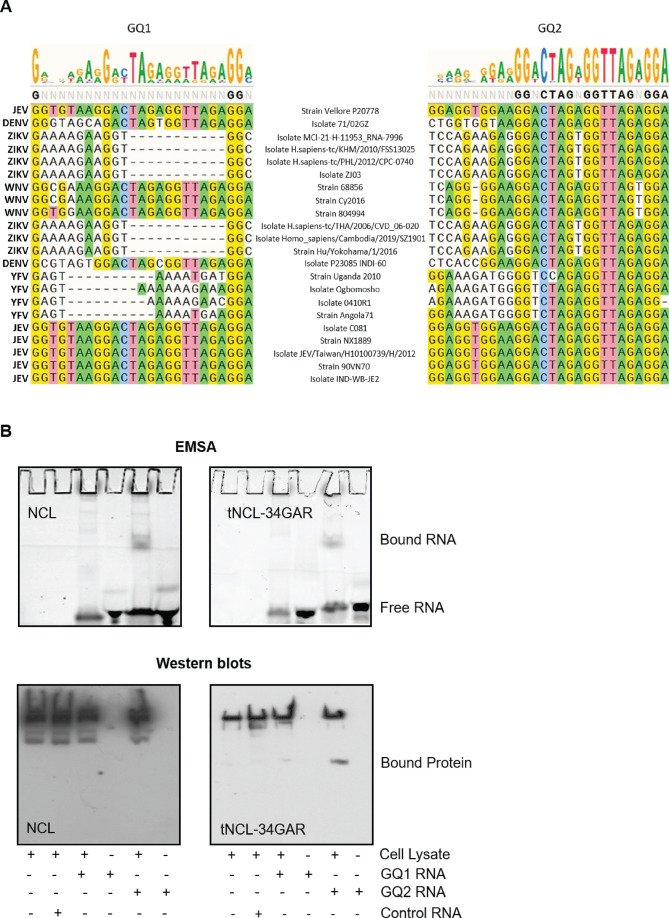
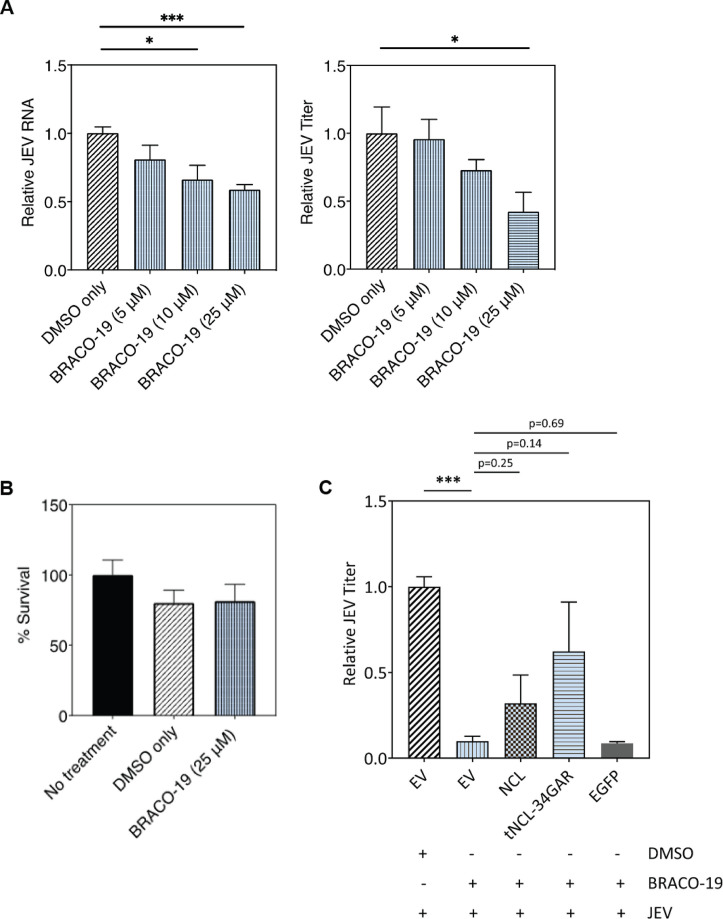
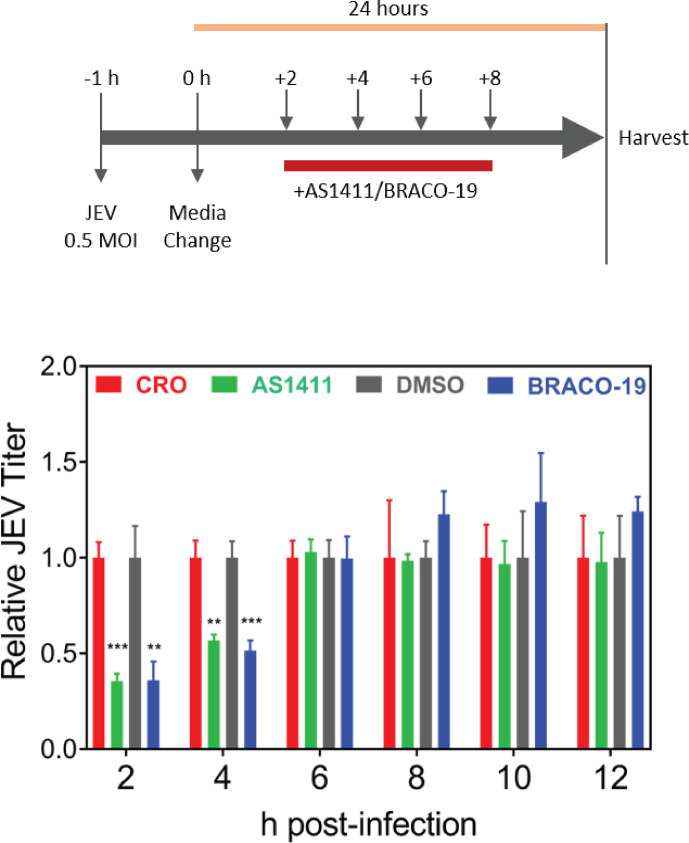
Japanese encephalitis virus (JEV) is an arthropod-borne, plus-strand flavivirus causing viral encephalitis in humans with a high case fatality rate. The JEV non-structural protein 5 (NS5) with the RNA-dependent RNA polymerase activity interacts with the viral and host proteins to constitute the replication complex. We have identified the multifunctional protein Nucleolin (NCL) as one of the several NS5-interacting host proteins. We demonstrate the interaction and colocalization of JEV NS5 with NCL in the virus-infected HeLa cells. The siRNA-mediated knockdown of NCL indicated that it was required for efficient viral replication. Importantly, JEV grew to higher titers in cells over-expressing exogenous NCL, demonstrating its pro-viral role. We demonstrated that NS5 interacted with the RRM and GAR domains of NCL. We show that the NCL-binding aptamer AS1411 containing the G-quadruplex (GQ) structure and the GQ ligand BRACO-19 caused significant inhibition of JEV replication. The antiviral effect of AS1411 and BRACO-19 could be overcome in HeLa cells by the overexpression of exogenous NCL. We demonstrated that the synthetic RNAs derived from the 3'-NCR of JEV genomic RNA containing the GQ sequence could bind NCL in vitro. The replication complex binding to the 3'-NCR is required for the viral RNA synthesis. It is likely that NCL present in the replication complex destabilizes the GQ structures in the genomic RNA, thus facilitating the movement of the replication complex resulting in efficient virus replication.IMPORTANCEJapanese encephalitis virus (JEV) is endemic in most parts of South-East Asia and the Western Pacific region, causing epidemics of encephalitis with a high case fatality rate. While a tissue culture-derived JEV vaccine is available, no antiviral therapy exists. The JEV NS5 protein has RNA-dependent RNA polymerase activity. Together with several host and viral proteins, it constitutes the replication complex necessary for virus replication. Understanding the interaction of NS5 with the host proteins could help design novel antivirals. We identified Nucleolin (NCL) as a crucial host protein interactor of JEV NS5 having a pro-viral role in virus replication. The NS5-interacting NCL binds to the G-quadruplex (GQ) structure sequence in the 3'-NCR of JEV RNA. This may smoothen the movement of the replication complex along the genomic RNA, thereby facilitating the virus replication. This study is the first report on how NCL, a host protein, helps in JEV replication through GQ-binding.

Keywords: RNA-dependent RNA polymerase; cytoplasmic translocation; flavivirus; nuclear protein; protein-protein interaction.


Conflict of interest statement

The authors declare no conflict of interest.

Figures

Fig 1
Fig 1
The JEV NS5 interactome. (A) The schematic shows the linearized BioID plasmid constructs encoding Myc-tagged BirA-NS5 (pNS5) or the empty vector (pEV). N2a cells were transfected with these vectors, and the stable transfected cells were selected using G418. The cell lysates were western blotted with anti-Myc antibody. The unique bands, as indicated by the arrows, of Myc-BirA fusion and Myc-BirA-NS5 fusion were seen in the pEV- or pNS5-transfected cells, respectively (right panel). The molecular weight markers in KDa are shown on the right side of the blot. (B) GO analysis of NS5 interactors from the BioID pull-down assay using DAVID is presented. (C) GO analysis of NS5 interactors from the Co-IP assay using DAVID is presented. The heat maps show significant P-values for each list. The gene count is represented by bars on the y-axis.
Fig 2
Fig 2
Identification of the JEV NS5 interacting proteins. (A) The NS5 interactors that were common between the BioID and Co-IP assays were identified by a Venn diagram in Venny. (B) The StringDB PPI networks (gray edges) between the common interactors in M. Musculus (blue) were compared with their orthologs (dot edges) in H. sapiens (green). (C) The PPI network of 116 interactors of JEV NS5 was created from the combined proteomics data of BioID and CoIP methods using STRING. The network was enriched in StringDB and visualized in Cytoscape. The heat map shows proteins with higher degree of interactions.
Fig 3
Fig 3
Interaction of NCL with JEV-NS5. (A) HeLa cells were mock infected or infected with JEV at 5 MOI. The cells were harvested at 24 h pi, and the lysates were prepared. The immunoprecipitation was performed using the JEV NS5 antibody, and the western blots were stained using the NCL antibody. The molecular weight markers in kDa are shown at the right. (B) HeLa cells were mock infected or infected with JEV at 5 MOI. The cells were fixed and permeabilized with digitonin at 24 h pi and immunostained with the NS5 and NCL antibodies. The images were taken under a Leica SP8 confocal microscope. The zoom image shows the area under the inset. The line plot for the green and red fluorescence is shown at the right. (C) HeLa cells were mock infected or infected with JEV at 5 MOI. The cells were processed 24 h pi for the PLA. The left panel shows the representative images acquired using the Leica SP8 microscope. The red dots signify the interaction or very close proximity between the two proteins. The right panel presents the relative number of red dots observed per cell, where the number of dots in the mock-infected sample was taken as 1. The NS5-NS1 and NS5-GAPDH interactions were taken as the positive and negative controls, respectively. The data presented are from three independent experiments.
Fig 4
Fig 4
JEV infection upregulates NCL expression and affects its cellular distribution. (A) HeLa cells were mock infected or infected with JEV at 1 MOI, and the total RNA was extracted at different time points. The level of JEV RNA and NCL mRNA was determined by qRT-PCR. The left panel shows the JEV RNA where GAPDH was used as the internal control. The right panel shows the NCL mRNA level as fold-change compared to the mock-infected sample at each time point which was assigned as 1. GAPDH was used as the internal control to normalize the data. The data from three independent experiments are shown. (B) JEV-infected (1 MOI) or mock-infected HeLa cells were harvested at different time points pi, and the level of NCL was analyzed by western blot. A representative western blot is shown in the left panel. The NCL expression was quantified relative to GAPDH, and the fold-change in the NCL expression level was calculated compared to that in the mock-infected sample for each time point. The fold change is shown at the top. The molecular weight marker in kDa is shown at the right. The data from three independent experiments are presented in the right panel. (C) The JEV-infected (1 MOI) or mock-infected HeLa cells were harvested at different time points pi, and the nuclear and cytoplasmic fractions were prepared. The levels of NCL and NS5 were analyzed by western blot in both fractions for each time point. GAPDH served as the cytoplasmic marker while Lamin A/C served as the nuclear marker. The NCL distribution in the nucleus and cytoplasm was quantified with respect to Lamin A/C and GAPDH, respectively. The ratio of the cytoplasmic to nuclear NCL in the mock-infected cells at each time point was taken as 1. A representative western blot is shown in the top panel. The lane M has the molecular weight marker in kDa shown at the bottom of the marker band. The data from three independent experiments are presented in the lower panel.
Fig 5
Fig 5
NCL has a pro-viral role during JEV replication. (A) HeLa cells were transfected with non-targeting control siRNA (siNT) or NCL siRNA (siNCL) (30 nM) and incubated for 48 h. The cells were then infected with JEV at different MOIs. The NCL mRNA level at 48 h post-transfection was analyzed by qRT-PCR (upper left panel), and the cell cytotoxicity was measured by the MTT assay (upper middle panel). The upper right panel has the representative picture showing the level of NCL protein by western blotting at 48 h post-transfection. The molecular weight marker in kDa is shown at the left. The left lower panel shows the JEV RNA at 24 h pi as determined by qRT-PCR at different MOI, and the lower right panel shows the virus titers. The data from three independent experiments are presented. (B) HeLa cells were transfected with the plasmid expressing Myc-tagged NCL under the control of the CMV promoter (CMV-NCL) or the empty vector (CMV-EV) and incubated for 48 h. The cells were then infected with JEV (1 MOI). The top panels show the NCL mRNA level at 48 h post-transfection analyzed by qRT-PCR and the cell cytotoxicity measured by the MTT assay from three independent experiments. A representative picture showing the level of the exogenous NCL protein by western blotting at 48 h post-transfection is presented. The molecular weight marker in kDa is shown at the left. The bottom panels show the JEV RNA level at 24 h pi as determined by qRT-PCR and the virus titers. The data from three independent experiments are presented.
Fig 6
Fig 6
In silico interaction of NCL and JEV NS5. (A) The left panel shows the crystal structure of full-length JEV NS5 (PDB ID 4K6M). The structure of human NCL containing central RRMs taken from the AlphaFold protein structure prediction database (P19338) is shown in the right panel. Individual domains of NS5 and NCL are labeled. (B) The top two best-predicted models of NS5-NCL-binding conformations were generated by the Cluspro protein-protein docking tool. The best (left panel) and second best (right panel) conformations show the binding of RRM4 and RRM3 from NCL to NS5. RRM4 shows more interactions than RRM3 with the NS5. (C) The location of the flexible GAR region around the Mtase domain suggests a possible involvement of the GAR region during the NCL-NS5 complex formation. The figure was generated by the superposition of RRM34-GAR from the AlphaFold model on the top-ranked NCL(RRM1234)-NS5 binding conformations.
Fig 7
Fig 7
JEV NS5 interacts with RRM3, RRM4, and GAR domains of NCL. (A) Schematic of the full-length NCL and the tNCL forms is shown in the left panel. The right panel shows the expression of each of the Myc-tagged tNCL forms by transfecting HeLa cells with the respective plasmid and western blotting of the lysates 24 h after transfection using anti-Myc antibody. (B) HeLa cells were transfected with plasmids expressing different tNCL forms and infected 48 h later with JEV at 5 MOI. The cells were fixed a day later and immunostained with NS5 and Myc antibodies. The left panel has the confocal images of the stained cells. The right panel has the bar graph showing Pearson’s Correlation Coefficient depicting the colocalization of NS5 and the NCL forms. The data are from three independent experiments. (C) HeLa cells were transfected with plasmids expressing different tNCL forms and infected 48 h later with JEV at 1 MOI. The culture supernatants were collected at 24 h pi, and the virus titer was determined by plaque assay. Fold change in the virus titer is presented with respect to the control where cells were transfected with EV.
Fig 8
Fig 8
JEV NS5 interacts with NCL and causes its cytoplasmic accumulation. (A) HeLa cells were transfected with the plasmids expressing tNCL-34GAR and JEV NS5 or with the plasmid expressing tNCL-34GAR and the empty vector (pEV) as the negative control. The cells were fixed 48 h later and immunostained with the NS5 and NCL antibodies. The nucleus was stained with DAPI. The images were taken under a Leica SP8 confocal microscope (upper panel). The Pearson’s correlation coefficients determined for the overlapping green and red fluorophores are presented (lower panel). (B) HeLa cells were transfected with the plasmid expressing JEV NS5 or with the empty vector (pEV) as the negative control. The cells were harvested at different time points post-transfection, and the nuclear and cytoplasmic fractions were prepared. The levels of NCL and NS5 were analyzed by western blotting. GAPDH served as the cytoplasmic marker. The NCL distribution in the cytoplasm was quantified with respect to GAPDH; the numbers at the top show the NCL/GAPDH ratio. The lane M has the molecular weight markers shown in kDa at the left.
Fig 9
Fig 9
NCL-binding aptamer AS1411 retards JEV replication in a dose-dependent manner. (A) HeLa cells were infected with JEV at 1 MOI. The cells were treated at 2 h pi with AS1411 or a non-specific random control aptamer CRO at increasing concentrations. The cells were harvested 24 h pi to analyze the level of intracellular JEV RNA by qRT-PCR, and the culture supernatants were used to determine the virus titers. Fold-change in viral RNA levels and titers were calculated with respect to the control for each concentration. (B) To check the cytotoxic effect of oligodeoxynucleotide aptamers on cell viability, HeLa cells were treated with AS1411 or CRO at 7 µM concentration and incubated for 24 h. The cell cytotoxicity was measured by the MTT assay. (C) HeLa cells were infected with JEV at 1 MOI. The cells were treated at 2 h pi with AS1411 or the control aptamer CRO at 3 µM concentration. The co-localization of JEV NS5 and NCL was studied by the PLA at 24 h pi.
Fig 10
Fig 10
AS1411-mediated retardation of JEV replication can be overcome by exogenous NCL. HeLa cells were transfected with the empty vector (EV) or plasmid expressing NCL or tNCL-34GAR. The cells were infected with JEV (MOI 1) 48 h post-transfection and incubated in the presence of 3 µM AS1411 or CRO. The culture supernatants were harvested at 24 h pi, and JEV titers were determined by plaque assay.
Fig 11
Fig 11
GQ sequences in the JEV 3′-NCR bind with NCL. (A) The nucleotide sequence alignment of the two predicted GQ sequences in the 3′-NCR of different flaviviruses, and their strains is shown. The top of the panel has the WebLogo representation of the two predicted GQ sequences in the 3′-NCR of JEV genomic RNA showing the conservation of G-bases among different flaviviruses. The height of the letters represents the frequency of their occurrence at that particular position. (B) Synthetic RNA containing the GQ sequences or a random control RNA was incubated with the cell lysate containing the exogenously expressed Myc-tagged NCL or tNCL-34GAR. The complexes were UV cross-linked and separated by native gel electrophoresis. The NCL-RNA and tNCL-RNA complexes were resolved on an 8% or 10% native PAGE, respectively. The GQ RNA was detected by fluorescence (upper panel). The gel was western blotted with the anti-Myc antibody to detect the exogenous NCL or tNCL-34GAR (lower panel).
Fig 12
Fig 12
GQ-binding ligand BRACO-19 reduces JEV replication in a dose-dependent manner. (A) HeLa cells were infected with JEV at 1 MOI. The cells were treated at 2 h pi with BRACO-19 at increasing concentrations. The cells were harvested 24 h pi to analyze the level of intracellular JEV RNA by qRT-PCR, and the culture supernatants were used to determine the virus titers. Fold-change in viral RNA levels and titers were calculated with respect to the DMSO-only control. (B) HeLa cells were treated with BRACO-19 at 25 µM concentration and incubated for 24 h. The cell cytotoxicity was measured by the MTT assay. (C) HeLa cells were transfected with empty vector (EV) or the plasmid expressing NCL, tNCL-34GAR, or EGFP. The cells were infected 48 h later with JEV (MOI 1) and treated 2 h pi with BRACO-19 at 25 µM concentration. The culture supernatants were harvested at 24 h pi, and the virus titer was determined. The titer shown is relative to that obtained in cells transfected with EV and not treated with BRACO-19.
Fig 13
Fig 13
The time of action of AS1411 and BRACO-19. HeLa cells were infected with JEV at 0.5 MOI, and AS1411 (3 µM) or BRACO-19 (25 µM) was added to the virus-infected cells at different times pi indicated on the x-axis. CRO (3 µM) was added to the cells used as the control for the AS1411-treated cells. DMSO was added to the cells used as control for the BRACO-19-treated cells. The culture supernatants were collected at 24 h pi, and the virus titers were determined. The fold change in the virus titer was calculated in relation to the respective control at each time point. The upper panel depicts the experimental plan. Each experiment had biological triplicates, and data from two independent experiments are shown in the lower panel.

Similar articles

References

    1. Tiwari S, Singh RK, Tiwari R, Dhole TN. 2012. Japanese encephalitis: a review of the Indian perspective. Braz J Infect Dis 16:564–573. doi:10.1016/j.bjid.2012.10.004 - DOI - PubMed
    1. Markoff L. 2003. 5'- and 3'-noncoding regions in flavivirus RNA. Adv Virus Res 59:177–228. doi:10.1016/s0065-3527(03)59006-6 - DOI - PMC - PubMed
    1. van den Elsen K, Quek JP, Luo D. 2021. Molecular insights into the flavivirus replication complex. Viruses 13:956. doi:10.3390/v13060956 - DOI - PMC - PubMed
    1. Brand C, Bisaillon M, Geiss BJ. 2017. Organization of the flavivirus RNA replicase complex. Wiley Interdiscip Rev RNA 8:1–14. doi:10.1002/wrna.1437 - DOI - PMC - PubMed
    1. Sampath A, Padmanabhan R. 2009. Molecular targets for flavivirus drug discovery. Antiviral Res 81:6–15. doi:10.1016/j.antiviral.2008.08.004 - DOI - PMC - PubMed

LinkOut - more resources