[Preprint]. 2024 Sep 2:2024.07.16.600122.
doi: 10.1101/2024.07.16.600122.

Experimental evolution of gene essentiality in bacteria

Affiliations

Experimental evolution of gene essentiality in bacteria

Liang Bao et al. bioRxiv. .

Abstract

Essential gene products carry out fundamental cellular activities in interaction with other components. However, the lack of essential gene mutants and appropriate methodologies to link essential gene functions with their partners poses significant challenges. Here, we have generated deletion mutants in 32 genes previously identified as essential, with 23 mutants showing extremely slow growth in the SK36 strain of Streptococcus sanguinis. The 23 genes corresponding to these mutants encode components of diverse pathways, are widely conserved among bacteria, and are essential in many other bacterial species. Whole-genome sequencing of 243 independently evolved populations of these mutants has identified >1000 spontaneous suppressor mutations in experimental evolution. Many of these mutations define new gene and pathway relationships, such as F1Fo-ATPase/V1Vo-ATPase/TrkA1-H1 that were demonstrated across multiple Streptococcus species. Patterns of spontaneous mutations occurring in essential gene mutants differed from those found in wildtype. While gene duplications occurred rarely and appeared most often at later stages of evolution, substitutions, deletions, and insertions were prevalent in evolved populations. These essential gene deletion mutants and spontaneous mutations fixed in the mutant populations during evolution establish a foundation for understanding gene essentiality and the interaction of essential genes in networks.

Keywords: Experimental evolution; F1Fo-ATPase/V1Vo-ATPase/TrkA1-H1 gene pathway; Gene essentiality; Spontaneous mutations; Streptococcus; Whole-genome sequencing.


Conflict of interest statement

Declaration of interests A patent application has been submitted by P.X. and L.B. and the Virginia Commonwealth University based on these results.

Figures
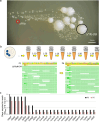
Figure 1.
Figure 1.
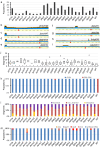
Evolution of mutants deleted for essential genes in passage experiments. (a) Two types of colonies, small and large, as demonstrated for f1fo deletion, appear on selection plates after 5 days of growth. Only the small colonies represent true deletions, denoted as Δf1fo (red circle). The large colonies are “double-band mutants,” containing both the replacement of the original f1fo with a kan gene and a wild-type f1fo copy, or they are mutants that did not contain a kan gene, but contained point mutations in other genes, denoted as Δf1fo-DB (black circle, ‘DB’ for double-band). (b) Schematic representation of the passage experiments (see Materials and Methods). The numbers on the arrows indicate the dilution ratios for each passage. Images inserted below the passages show genome alignments to the reference at P1 or P6, with mismatches marked by a star (demonstrated using the trkH1 mutation in the Δf1fo#104 population shown in Figure 3d). (c) Incubation time (days) required for P0 and P6 mutants to reach an OD600 of 0.1 to 0.5.
Figure 2.
Figure 2.
Identification of suppressors in mutants deleted for essential genes. (a) Number of independently evolved populations of different mutants. (b-i) Evolved populations containing large-scale duplications. Red arrow, site of original essential gene deletion; Y axis indicates number of sequence reads mapped to the reference sequence at the coordinates shown on X axis. (j) Boxplot of mutated segments (≥30% abundance) in the independently evolved populations of mutants deleted for essential genes or WT. Open circles indicate outliers. (k) Stacked proportions of populations containing mutated segments comprising >50% (blue) or 30%−50% (red) of sequence reads. (l) Stacked proportions of mutated segments belonging to intergenic regions, non-essential ORFs, or essential ORFs. (m) Stacked proportions of evolved populations with/without mutations in the multi-drug resistance genes (DRGs: rpsL, gyrB, rpoB and rrs2) shown.
Figure 3.
Figure 3.
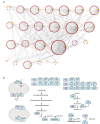
Networks derived from the mutations in the evolved populations. (a) A network was built from the lists of suppressor mutants derived from each essential gene mutant and WT. Yellow-highlighted labels indicate the names of the essential genes mutated and the blue-highlighted label indicates the passaged WT. In total, there are twenty-five groups. Gene names without any marks, mutated segments belonging to essential genes; gene names with an asterisk (*) on the left, conditional essential genes; gene name with two asterisks on the left, non-essential genes; P_ followed by gene names and an asterisk, promoters; In_ followed by gene names and an asterisk and int_ followed by number, intergenic regions; _ followed by number, gene locus. (b) Most commonly mutated segments in the evolved populations deleted of essential genes. Red cross on the rectangle boxes indicates evolved populations deleted of essential genes. Labels within the rectangle boxes indicate the segments with mutations. Numbers on top of the rectangle boxes indicate number of populations with mutations in the segments out of the total populations. Arrows indicate the flow of biochemical reactions.
Figure 4.
Figure 4.
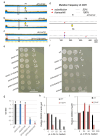
Increasing v1vo copy number and inhibition of trkA1-H1 independently contribute to the fitness improvement of evolved Δf1fo populations. (a) Gene duplication of v1vo region does not occur in P1 population (upper) and appeared in P6 (lower) population of Δf1fo#109. Yellow arrows indicate passaging process. The black box indicates the f1fo region. (b) Population of Δf1fo#4 at P6 that does not contain gene duplication of v1vo region (upper). v1vo region duplication was observed in P15 (lower). (Two out of sixed evolved populations; see S7). Arrows indicate passaging process. (c) v1vo region deleted in WT (upper). Duplication of v1vo region Δf1fo#4, denoted as v1vo-DB/Δf1fo#4. The black box indicates the f1fo region. The red box indicates v1vo region. (d) Mutation frequency in trkH1 increased with passage in P6 compared to P1 in population Δf1f#104. (e) Growth of strains indicated. 0.1 OD600 of cells in a volume of 2 μl were spotted directly (first column) or diluted 20-fold (column 2), or 400-fold (column 3) and grown on BHI-agar for two days. (f) Growth of the strains indicated. 0.1 OD600 of cells in a volume of 2 μl were spotted directly (first column) or diluted 10-fold (column 2), or 100-fold (column 3), or 1000-fold (column 4), and grown for four days. (g) Quantitative growth measurements of WT, ΔtrkA1-H1, ΔtrkA2-H2, Δf1fo in ΔtrkA1-H1 and Δf1fo in ΔtrkA2-H2. Culture is in BHI for 24 hr in anaerobic conditions. Data are shown as means ± SD from three replicate cultures. Different letters indicate statistically significant differences (P≤0.05), determined by one -way ANOVA with Tukey multiple comparisons test. (h) Sensitivity of Δf1fo#4 and WT to low pH (lactic acid: LA). The values are relative OD600 to that of WT grown in plain BHI. X-axis denotes the vol (μL) of 90% LA in 25 mL of BHI. Data are shown as means ± SD from three replicate cultures. (i) Sensitivity of Δf1fo#4 and WT to high pH (NaOH). The values are relative OD600 to that of WT grown in plain BHI. X-axis denotes the vol (μL) of 5 M NaOH in 25 mL of BHI. Data are shown as means ± SD from three replicate cultures.
Figure 5
Figure 5
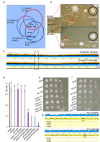
Essentiality of f1fo in S. mutans UA159, S. sanguinis SK36, SK405 and SK1058. (a) Distribution of the genes indicated in S. mutans UA159, S. sanguinis SK36, SK405 and SK1058. (b) Growth of Δf1fo transformants in S. sanguinis SK405 (upper) and SK1058 (lower) on same BHI agar medium for five days. Enlarged images of the transformants are shown. Red circles indicate small colonies, Δf1fo. Black circles indicate big colonies, Δf1fo-DB. (c) Deletion of f1fo in SK405 or SK1058 shown by whole genome sequencing. Black box indicates the location of f1fo region. (d) Quantitative measurements of growth in wild-type SK36, SK405 or SK1058, ΔtrkA1-H1 or Δf1fo mutants in the backgrounds of SK36, SK405 or SK1058. Cells were grown in BHI for 24 hours. Data are shown as means ± SD from three replicate cultures. Different letters indicate statistically significant differences (P≤0.05), determined by one -way ANOVA with Tukey multiple comparisons test. (e) Growth of SK36, SK405 or SK1058, ΔtrkA1-H1 mutant in the backgrounds of SK36, SK405 or SK1058. 0.1 OD600 of cells in a volume of 2 μl were spotted directly (first column) or diluted 10-fold (column 2), or 100-fold (column 3), or 1000-fold (column 4). Growth of Cells were grown on BHI-agar for two days. (f) Growth of SK36, SK405 or SK1058, Δf1fo mutant in the backgrounds of SK36, SK405 or SK1058. Cells were diluted as in Fig. E and grown on BHI-agar for four days. (g) Location of trkA1-H1 suppressor mutations in SK405 and SK1058. Mutation of trkA1-H1 appeared in all evolved Δf1fo populations, three in SK405 and two in SK1058. X-axis indicates the genome coordinates.

Similar articles

References

    1. Xu P., Ge X., Chen L., Wang X., Dou Y., Xu J.Z., Patel J.R., Stone V., Trinh M., Evans K., et al. (2011). Genome-wide essential gene identification in Streptococcus sanguinis. Scientific reports 1, 125. 10.1038/srep00125. - DOI - PMC - PubMed
    1. Rancati G., Moffat J., Typas A., and Pavelka N. (2018). Emerging and evolving concepts in gene essentiality. Nat Rev Genet 19, 34–49. 10.1038/nrg.2017.74. - DOI - PubMed
    1. Zhang Z., and Ren Q. (2015). Why are essential genes essential? - The essentiality of Saccharomyces genes. Microb Cell 2, 280–287. 10.15698/mic2015.08.218. - DOI - PMC - PubMed
    1. D’Elia M.A., Pereira M.P., and Brown E.D. (2009). Are essential genes really essential? Trends Microbiol 17, 433–438. 10.1016/j.tim.2009.08.005. - DOI - PubMed
    1. Brown E.D., and Wright G.D. (2016). Antibacterial drug discovery in the resistance era. Nature 529, 336–343. 10.1038/nature17042. - DOI - PubMed

Publication types

LinkOut - more resources