[Preprint]. 2024 Jul 15:rs.3.rs-4469045.
doi: 10.21203/rs.3.rs-4469045/v1.

Comparison of the Amyloid Plaque Proteome in Down Syndrome, Early-Onset Alzheimer's Disease and Late-Onset Alzheimer's Disease

Affiliations

Comparison of the Amyloid Plaque Proteome in Down Syndrome, Early-Onset Alzheimer's Disease and Late-Onset Alzheimer's Disease

Mitchell Martá-Ariza et al. Res Sq. .

Update in

Abstract

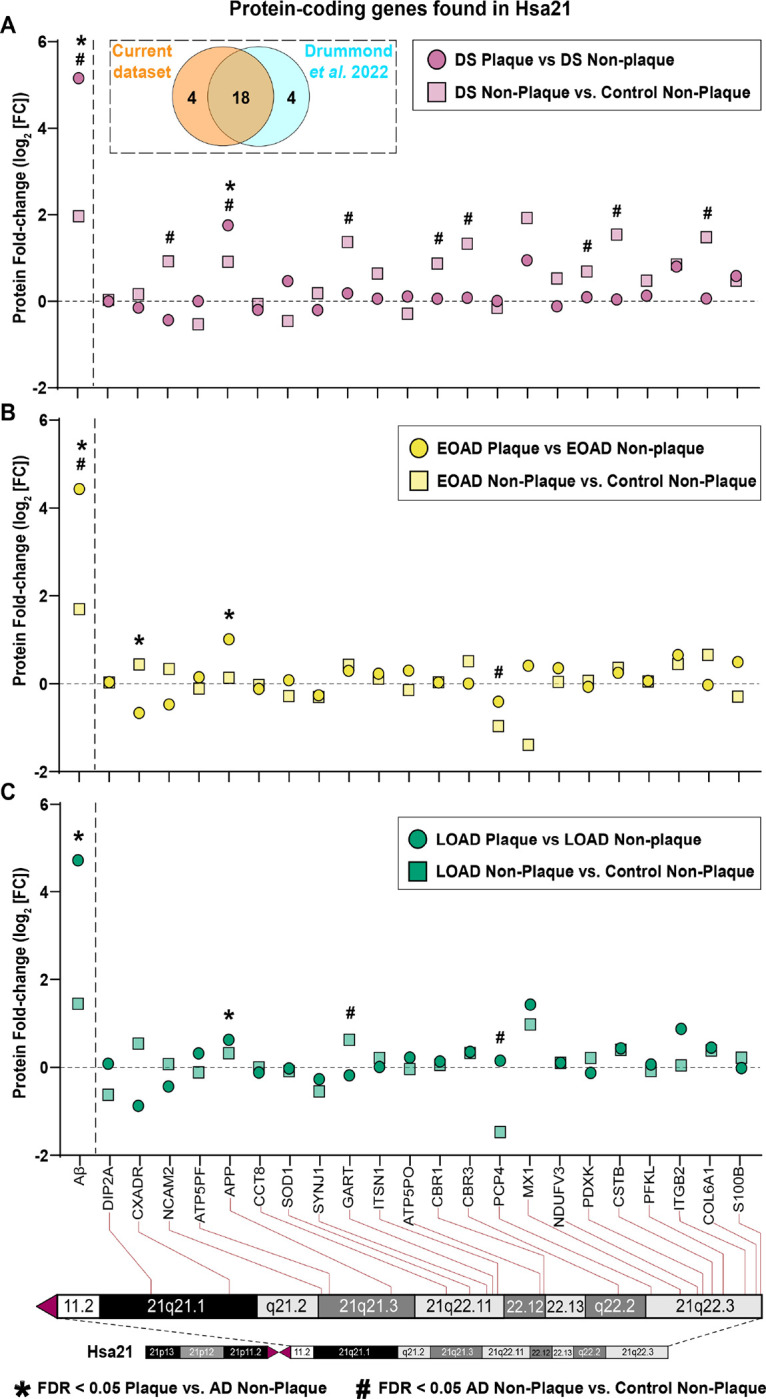
Background: Down syndrome (DS) is strongly associated with Alzheimer's disease (AD), attributable to APP overexpression. DS exhibits Amyloid-β (Aβ) and Tau pathology similar to early-onset AD (EOAD) and late-onset AD (LOAD). The study aimed to evaluate the Aβ plaque proteome of DS, EOAD and LOAD.

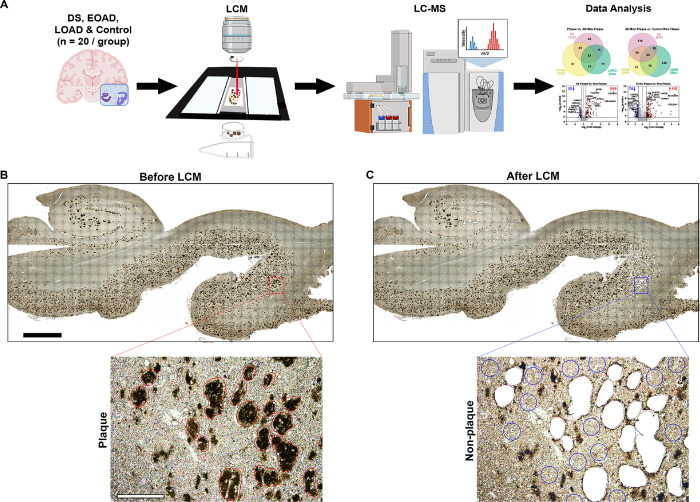
Methods: Using unbiased localized proteomics, we analyzed amyloid plaques and adjacent plaque-devoid tissue ('non-plaque') from post-mortem paraffin-embedded tissues in four cohorts (n = 20/group): DS (59.8 ± 4.99 y/o), EOAD (63 ± 4.07 y/o), LOAD (82.1 ± 6.37 y/o) and controls (66.4 ± 13.04). We assessed functional associations using Gene Ontology (GO) enrichment and protein interaction networks.

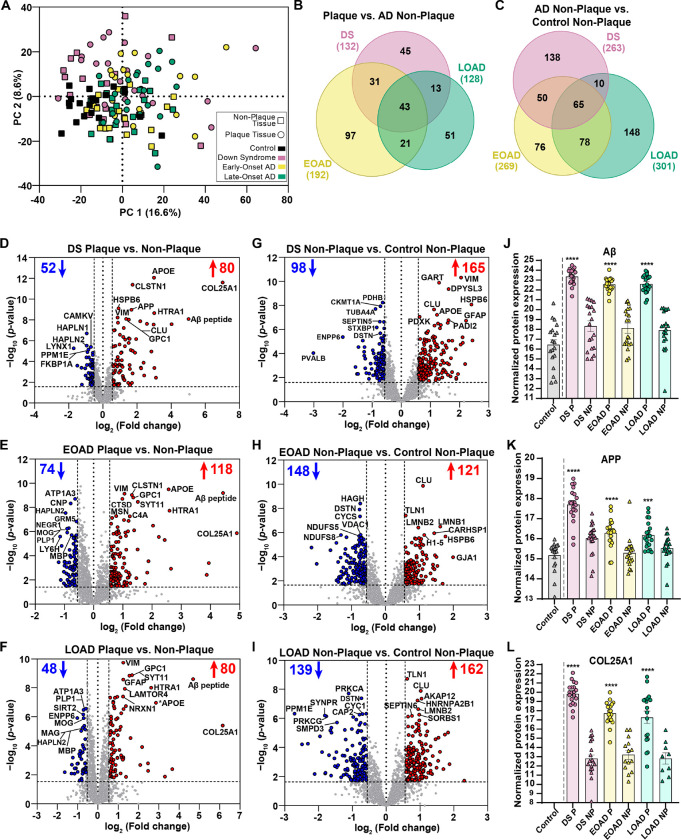
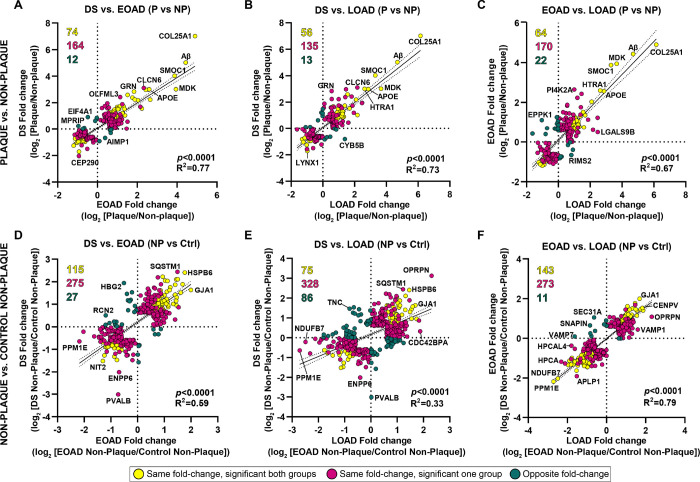
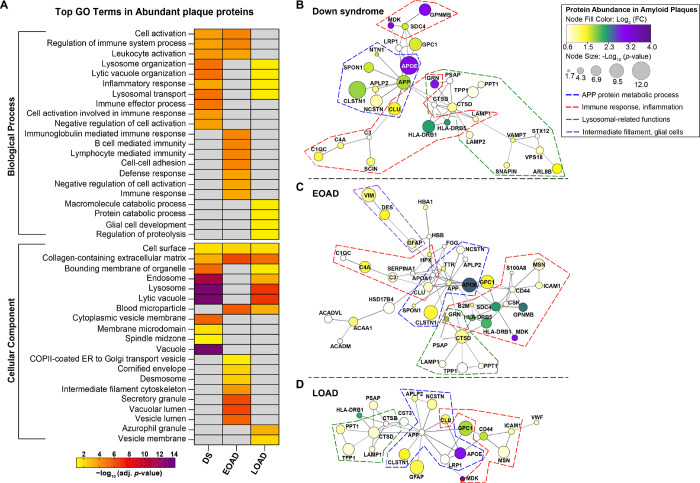
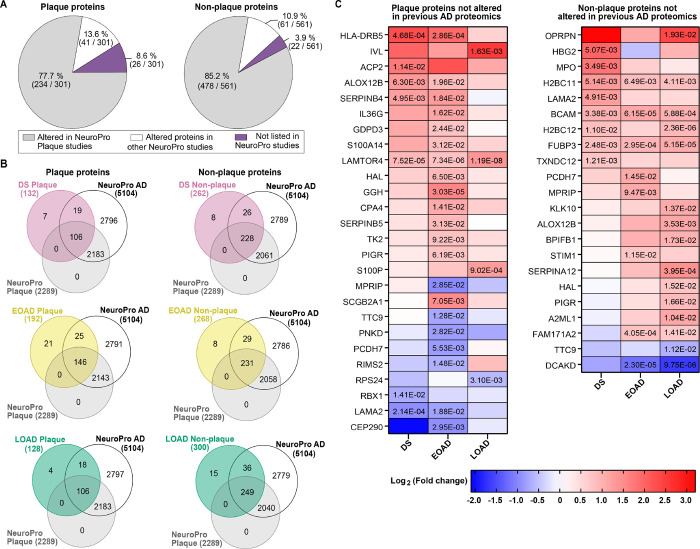
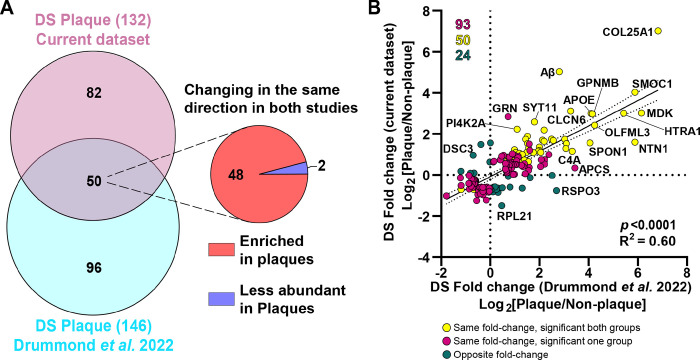
Results: We identified differentially abundant Aβ plaque proteins vs. non-plaques (FDR < 5%, fold-change > 1.5) in DS (n = 132), EOAD (n = 192) and in LOAD (n = 128); there were 43 plaque-associated proteins shared between all groups. Positive correlations (p < 0.0001) were observed between plaque-associated proteins in DS and EOAD (R2 = 0.77), DS and LOAD (R2 = 0.73), and EOAD vs. LOAD (R2 = 0.67). Top Biological process (BP) GO terms (p < 0.0001) included lysosomal transport for DS, immune system regulation for EOAD, and lysosome organization for LOAD. Protein networks revealed a plaque enriched signature across all cohorts involving APP metabolism, immune response, and lysosomal functions. In DS, EOAD and LOAD non-plaque vs. control tissue, we identified 263, 269, and 301 differentially abundant proteins, including 65 altered non-plaque proteins across all cohorts. Differentially abundant non-plaque proteins in DS showed a significant (p < 0.0001) but weaker positive correlation with EOAD (R2 = 0.59) and LOAD (R2 = 0.33) compared to the stronger correlation between EOAD and LOAD (R2 = 0.79). The top BP GO term for all groups was chromatin remodeling (DS p = 0.0013, EOAD p = 5.79×10- 9, and LOAD p = 1.69×10- 10). Additional GO terms for DS included extracellular matrix (p = 0.0068), while EOAD and LOAD were associated with protein-DNA complexes and gene expression regulation (p < 0.0001).

Conclusions: We found strong similarities among the Aβ plaque proteomes in individuals with DS, EOAD and LOAD, and a robust association between the plaque proteomes and lysosomal and immune-related pathways. Further, non-plaque proteomes highlighted altered pathways related to chromatin structure and extracellular matrix (ECM), the latter particularly associated with DS. We identified novel Aβ plaque proteins, which may serve as biomarkers or therapeutic targets.

Keywords: Alzheimer’s disease; Amyloid-β; Down syndrome; Neuropathology; Proteomics.


Conflict of interest statement

Competing interests OD have equity in Regel Therapeutics and Tevard Biosciences. The other authors declare no competing interests.

Figures

Figure 1
Figure 1
Schematic of the localized proteomics protocol. A. Laser-capture microdissection of 2 mm2 total area of amyloid-β plaques from hippocampus and adjacent temporal cortex from FFPE autopsy brain tissue from control, DS, EOAD and LOAD (n=20 cases/experimental group). Amyloid plaque proteins were quantified by label-free mass spectrometry and posteriorly analyzed. B-C. Microphotographs of a typical brain tissue section immunolabeled against Aβ illustrate the precise microdissection of amyloid plaques before (B) and after LCM (C). 2 mm (black bar, top) and 200 μm (white bar, bottom).
Figure 2
Figure 2
Principal component analysis (PCA) and differential protein expression in Aβ plaques and non-plaque tissue. A. PCA shows the distribution of the n=20 cases per each experimental group, with minimal segregation. B. Venn diagram of differentially abundant Aβ plaque proteins shows 43 common proteins for all the AD subtypes evaluated, 45 for DS, 97 for EOAD and 51 for LOAD. C. Venn diagram of differentially abundant non-plaque proteins depicts 138 proteins in DS, 76 proteins in EOAD, 148 proteins in LOAD, and 65 common proteins for all AD subtypes. D-F. Volcano plots indicate differentially expressed proteins (enriched in red, decreased in blue) in Aβ plaques compared to non-plaque tissue in DS (132 proteins, D), EOAD (192 proteins, E) and LOAD (128 proteins, F). G-I. Volcano plots depict differentially expressed proteins in DS non-plaque tissue compared to controls (263 proteins, G), EOAD non-plaques (269 proteins, H) and LOAD non-plaques (301 proteins, I). (J-L). Normalized protein expression obtained from the label-free quantitative mass spectrometry proteomics of Aβ peptide (J), APP protein (K) and COL25A1 (L). Significance was determined using a student’s two-tailed t test (FDR < 5%, fold-change > 1.5). P values are indicated based on the pairwise comparisons. *** p<0.001, *** P<0.0001. Error bars indicate standard error of the mean (SEM). Significant pairwise comparisons are indicated for those analyses that were performed, controls are shown as reference.
Figure 3
Figure 3
Correlation analyses of differentially abundant proteins in Aβ plaques and non-plaque tissue. (A-C) Correlation analyses for significant proteins in Aβ plaques vs non-plaque tissue and (D-F) DS, EOAD and LOAD non-plaque vs control non-plaque tissue. Yellow dots represent proteins changing in the same direction (highly abundant or less abundant proteins in both groups evaluated) and that are significant for both groups compared. Magenta dots represent proteins changing in the same direction, but are significant only in one of the groups evaluated. Green dots represent proteins changing in opposite direction (i.e., abundant in one group and less abundant in the other group evaluated). Numbers are colored to match the dots. Proteins were selected for the correlation analysis if they were significant at least in one of the groups compared and its fold change > 1.5. We observed a positive correlation between DS vs. EOAD (A) (p<0.0001, R2=0.77, (B) DS vs. LOAD (p<0.0001, R2=0.73) and (C) EOAD vs. LOAD (p<0.0001 R2=0.67). There is also a positive correlation when comparing non-plaque proteins in (D) DS vs. EOAD (p<0.0001 R2=0.59) and (E) DS vs. LOAD p<0.0001, R2=0.33). H. Correlation between EOAD and LOAD non-plaque proteins p<0.0001, R2=0.79).
Figure 4
Figure 4
Mapping protein-coding genes to chromosome 21 (Hsa21). A. Dashed box contains Venn diagram of proteins from genes in Hsa21 identified in the current study vs. Drummond et al. 2022, (12). (A-C) The figure depicts fold change (Log2 FC) of the twenty-two Hsa21 genes whose corresponding protein products were found in Aβ plaques (circles) or neighboring non-plaque tissue (squares) in DS (E), EOAD (F) and LOAD (G). Paired two-tailed t tests (plaques vs. non-plaques) or unpaired two-tailed t tests (non-plaques vs. control) with permutation correction at a 5% FDR are indicated. Aβ peptide is shown as reference.
Figure 5
Figure 5
Gene ontology annotation and protein-protein interaction networks of significantly abundant proteins in Aβ plaques. A. GO terms heatmap depicts top 10 enriched BP and CC GO terms for significantly abundant Aβ plaque proteins in DS, EOAD and LOAD. Color indicates the adjusted p-value <0.05 (−Log10 [adj. p-value]). (B-D) Protein networks (PPI Enrichment p=1 × 10⁻¹⁶) show functional and physical amyloid plaques protein associations in DS (B), EOAD (C) and LOAD (D). Node color indicates fold-change (log2 [FC]) and node size depicts adjusted p-value (−log10 [p-value]) from the student’s two-tailed t test. Disconnected nodes are not shown in the network. Colored dotted lines highlight groups of proteins based on functions/pathways observed in the GO terms; Blue: APP protein metabolic process, Red: immune response and inflammation, Green: lysosomal-related functions, Purple: intermediate filament proteins, glial cells. GO terms annotation was performed using R package clusterProfiler v 4.8.2. PPI networks were created in Cytoscape v 3.10.0 using STRING database v 11.5.
Figure 6
Figure 6
Enriched Aβ plaque proteins of interest in DS compared with EOAD and LOAD. (A-F) Normalized protein expression obtained from the label-free quantitative mass spectrometry proteomics of abundant Aβ plaque proteins of interest in DS. Proteins are shown by order of decreasing significance. Proteins of interest were defined as significant (FDR < 5%, fold-change > 1.5) only in DS and also have known or predicted roles in AD and DS. Pairwise comparisons p values are indicated. * p<0.05, **** p<0.0001. Error bars indicate standard error of the mean (SEM). Significant pairwise comparisons are indicated for those analyses that were performed, controls are shown as reference. # † ‡ indicate that the given protein is not significantly abundant in non-plaque AD tissue compared to controls in DS, EOAD and LOAD, respectively.
Figure 7
Figure 7
Comparison of protein changes with previous advanced AD proteomics studies. A. Altered proteins identified in the current study were compared with proteins found altered in previous AD proteomics compiled in NeuroPro (35) (v1.12; https://neuropro.biomedical.hosting/). Pie charts show that 77.7% (234/301) of altered plaque proteins in the present study have been identified in previous AD plaque proteomics studies (gray). 13.6% (41/301) of the proteins have been seen only in bulk tissue proteomics studies (white), and 8.6% (26/301) of the altered proteins observed in the current study have not been described in previous AD proteomics (purple). In a similar fashion, 85.2% (478/561) proteins altered in AD non-plaque tissue have been observed in AD plaque proteomics, 10.9% (61/561) only in bulk tissue proteomics and 3.9% (22/561) have not been described in previous AD proteomics studies. B. Venn diagrams illustrate the altered proteins identified in Aβ plaques and AD non-plaque tissue for each AD subtype evaluated, in comparison to the 5104 altered proteins in advanced AD registered in NeuroPro database. C. Heatmaps depicting the fold change (Log2 [FC]) of the plaque and AD non-plaque altered proteins identified in the present study that have not been described in previous AD proteomics. Numbers in the cells represent the significance (FDR < 0.05) values observed in the pairwise comparisons.
Figure 8
Figure 8
Comparison of protein changes between the DS plaques localized proteomics studies. A. Venn diagram depicts differentially abundant proteins identified in the current study and the previous DS plaque proteomics study (Drummond et al. 2022, (12)). We identified 132 significantly altered proteins compared to 146 identified previously. From the 50 common proteins identified, 48 were enriched in Aβ plaques and 2 proteins were less abundant in both studies. B. Correlation analysis between differentially abundant proteins in the current study and previous DS localized proteomics. Yellow dots represent significant proteins changing in the same direction (highly abundant or less abundant proteins in both groups evaluated) in both groups compared. Magenta dots represent proteins changing in the same direction, but are significant only in one of the groups evaluated. Green dots represent proteins changing in opposite direction (i.e., abundant in one group and less abundant in the other group evaluated). There was a significant positive correlation (p < 0.0001, R2=0.60) between the two datasets.

Similar articles

References

    1. Antonarakis SE, Skotko BG, Rafii MS, Strydom A, Pape SE, Bianchi DW, et al. Down syndrome. Nat Rev Dis Primers. 2020;6(1):9. - PMC - PubMed
    1. de Graaf G, Buckley F, Skotko BG. Estimation of the number of people with Down syndrome in the United States. Genet Med. 2017;19(4):439–47. - PubMed
    1. Doran E, Keator D, Head E, Phelan MJ, Kim R, Totoiu M, et al. Down Syndrome, Partial Trisomy 21, and Absence of Alzheimer's Disease: The Role of APP. J Alzheimers Dis. 2017;56(2):459–70. - PMC - PubMed
    1. Gardiner K, Davisson M. The sequence of human chromosome 21 and implications for research into Down syndrome. Genome Biology. 2000;1(2):reviews0002.1. - PMC - PubMed
    1. Glenner GG, Wong CW. Alzheimer's disease: initial report of the purification and characterization of a novel cerebrovascular amyloid protein. Biochem Biophys Res Commun. 1984;120(3):885–90. - PubMed

Publication types

LinkOut - more resources