. 2024 Jul 15;25(14):7738.
doi: 10.3390/ijms25147738.

PKR Mediates the Mitochondrial Unfolded Protein Response through Double-Stranded RNA Accumulation under Mitochondrial Stress

Affiliations

PKR Mediates the Mitochondrial Unfolded Protein Response through Double-Stranded RNA Accumulation under Mitochondrial Stress

Fedho Kusuma et al. Int J Mol Sci. .

Abstract

Mitochondrial stress, resulting from dysfunction and proteostasis disturbances, triggers the mitochondrial unfolded protein response (UPRMT), which activates gene encoding chaperones and proteases to restore mitochondrial function. Although ATFS-1 mediates mitochondrial stress UPRMT induction in C. elegans, the mechanisms relaying mitochondrial stress signals to the nucleus in mammals remain poorly defined. Here, we explored the role of protein kinase R (PKR), an eIF2α kinase activated by double-stranded RNAs (dsRNAs), in mitochondrial stress signaling. We found that UPRMT does not occur in cells lacking PKR, indicating its crucial role in this process. Mechanistically, we observed that dsRNAs accumulate within mitochondria under stress conditions, along with unprocessed mitochondrial transcripts. Furthermore, we demonstrated that accumulated mitochondrial dsRNAs in mouse embryonic fibroblasts (MEFs) deficient in the Bax/Bak channels are not released into the cytosol and do not induce the UPRMT upon mitochondrial stress, suggesting a potential role of the Bax/Bak channels in mediating the mitochondrial stress response. These discoveries enhance our understanding of how cells maintain mitochondrial integrity, respond to mitochondrial dysfunction, and communicate stress signals to the nucleus through retrograde signaling. This knowledge provides valuable insights into prospective therapeutic targets for diseases associated with mitochondrial stress.

Keywords: PKR; UPRMT; integrated stress response; mitochondrial dsRNAs; mitochondrial stress.


Conflict of interest statement

The authors declare no conflicts of interest.

Figures

Figure 1
Figure 1
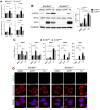
Integrated stress response (ISR) is required for mitochondrial unfolded protein response (UPRMT) activation. Indicated mouse embryonic fibroblasts (MEFs) were treated with mitochondrial chaperone TRAP1 inhibitor gamitrinib-triphenylphosphonium (GTPP; 10 μM), ER stressor thapsigargin (TG; 300 nM), or DMSO control. (A,B) Cell lysates were obtained 2 h (A) and 4 h (B) after stress induction for Western blot analysis. Hsp90αβ was used as loading control. (CE) Total RNAs were isolated from (C,D) indicated MEFs or (E) wildtype MEFs treated in the presence of ISR inhibitor (ISRIB; 500 nM) at 8 h after stress induction for RT-qPCR analysis to measure UPRMT- and ISR-related genes (n = 4). Also, 18S rRNA primers were used as internal control. Data are presented as mean ± SD. * p < 0.0332, ** p < 0.0021, *** p < 0.0002, and **** p < 0.0001.
Figure 1
Figure 1
Integrated stress response (ISR) is required for mitochondrial unfolded protein response (UPRMT) activation. Indicated mouse embryonic fibroblasts (MEFs) were treated with mitochondrial chaperone TRAP1 inhibitor gamitrinib-triphenylphosphonium (GTPP; 10 μM), ER stressor thapsigargin (TG; 300 nM), or DMSO control. (A,B) Cell lysates were obtained 2 h (A) and 4 h (B) after stress induction for Western blot analysis. Hsp90αβ was used as loading control. (CE) Total RNAs were isolated from (C,D) indicated MEFs or (E) wildtype MEFs treated in the presence of ISR inhibitor (ISRIB; 500 nM) at 8 h after stress induction for RT-qPCR analysis to measure UPRMT- and ISR-related genes (n = 4). Also, 18S rRNA primers were used as internal control. Data are presented as mean ± SD. * p < 0.0332, ** p < 0.0021, *** p < 0.0002, and **** p < 0.0001.
Figure 2
Figure 2
Immortalized PkrWT and PkrKO MEFs were generated from PkrWT and PkrKO mice. (A,B) Indicated MEFs transfected with double-stranded RNA (dsRNA) mimic poly(I:C) (5 µg/mL) were analyzed for Western blot (A) at 6 h post-transfection or RT-qPCR (B) at 12 h after transfection. (C,D) Indicated MEFs were treated with 10 μM GTPP and 300 nM TG up to 8 h. (C) Cell lysates were obtained 2 h after treatment for Western blot analysis. (D,E) Total RNA was isolated at 8 h after treatment for RT-qPCR analysis to measure Ifnb1 and UPRMT- and ISR-related genes (n = 4). Hsp90αβ was used as loading control. Also, 18S rRNA primers were used as internal control. Data are presented as mean ± SD. * p < 0.0332, ** p < 0.0021, *** p < 0.0002, and **** p < 0.0001.
Figure 3
Figure 3
Wildtype MEFs were treated with mitochondrial chaperone TRAP1 inhibitor gamitrinib-triphenylphosphonium (GTPP) (A) at 10 µM concentration for indicated times or (B) at indicated concentrations for 1 h. Immunofluorescence staining was performed using monoclonal antibody J2 as marker for double-stranded RNAs (dsRNAs), MitoTracker Red CMXROS for mitochondria, and Hoecsht 33342 for nuclei. Yellow puncta diameter was measured across 3 images. (C) Orthogonal image of confocal microscopy on a single cell treated with GTPP was captured to observe complete localization, as represented by yellow puncta indicated by white arrows. Red and green lines indicate cross-section view on top and side panels. Scale bar, 10 µm. (D) Mitochondrial RNAs were isolated from wildtype MEFs treated with 20 µM GTPP or DMSO control for 1 h. The isolated RNAs were then digested using specific RNases. M, mock digestion. T1, single-stranded RNA-specific endonuclease RNase T1. III, dsRNA-specific endonuclease RNase III. Following digestion, samples were run on 1.5% agarose gel and visualized by EtBr staining (left). Densitometry was performed by measuring signal intensity normalized to the mock digestion (right). Data are presented as mean ± SD. * p < 0.0332, ** p < 0.0021, and **** p < 0.0001.
Figure 4
Figure 4
(A) Wildtype MEFs were treated with 10 µM GTPP alone or in the presence of transcription inhibitor actinomycin D (Act D; 15 µM) or 300 nM TG. Immunofluorescence staining was performed as described in Figure 3. (B) Schematic of mitochondrial polycistronic RNA processing represented by tRNAMet. RNase P and RNase Z cleave tRNAMet at its 5′ and 3′ ends, respectively. (C) Total RNAs were isolated from wildtype MEFs at 8 h after treated with 10 µM GTPP, TG 300 nM, or DMSO control for RT-qPCR analysis to measure mitochondrial RNA processing. Unprocessed mitochondrial tRNAMet fragments were measured by using primer pairs 1 and 3, or 2 and 4, as shown in (B) [for details, please refer to Materials and Methods Section 4.4]. The resulting Ct values were normalized to the Ct values of total mitochondrial tRNAMet as obtained from primer pair 2 and 3 (n = 4). Data values presented as mean ± SD. *** p < 0.0002, and **** p < 0.0001.
Figure 5
Figure 5
Mitochondrial RNAs were isolated from wildtype MEFs treated with 20 µM GTPP or DMSO control for 1 h and were then used to transfect into indicated MEFs. Poly(I:C) was used as positive control. (A) Cell lysates were obtained 6 h after transfection for Western blot analysis. Hsp90αβ was used as loading control. (B,C) Total RNAs were isolated 12 h after transfection for RT-qPCR analysis to measure (B) dsRNA-responsive Ifnb1 and (C) UPRMT- and ISR-related genes. (n = 4). (D) Wildtype MEFs were treated with 20 µM GTPP, 300 nM TG, or DMSO control. Total RNAs were isolated from cytosolic fraction at 1 h after stress induction for RT-qPCR analysis to measure mitochondrial transcript levels (n = 3). Data values presented as mean ± SD. * p < 0.0332, ** p < 0.0021, *** p < 0.0002, and **** p < 0.0001.
Figure 6
Figure 6
(A) Indicated MEFs were treated with mitochondrial chaperone TRAP1 inhibitor gamitrinib-triphenylphosphonium (GTPP; 10 µM) or DMSO control. Cytosolic RNAs were isolated at 8 h after stress induction for RT-qPCR analysis to measure mitochondrial transcript levels. (B,C) Indicated MEFs were treated with 10 µM GTPP, thapsigargin (TG; 300 nM), or DMSO control. (B) Cell lysates were obtained 2 h after stress induction for Western blot analysis. Densitometry was performed by measuring p-eIF2α signal normalized to total eIF2α. Hsp90αβ was used as loading control. (C) Total RNAs were isolated at 8 h after stress induction for RT-qPCR to measure UPRMT- and ISR-related genes (n = 4). (D) Immunofluorescence staining was performed 1 h after stress induction to observe dsRNA accumulation. (E) MEFs were transfected with mitochondrial RNAs isolated from GTPP- or DMSO-treated cells, and total RNAs were isolated 12 h after transfection for RT-qPCR analysis to measure UPRMT- and ISR-related genes (n = 3). Data values presented as mean ± SD. * p < 0.0332, ** p < 0.0021, *** p < 0.0002, and **** p < 0.0001.
Figure 6
Figure 6
(A) Indicated MEFs were treated with mitochondrial chaperone TRAP1 inhibitor gamitrinib-triphenylphosphonium (GTPP; 10 µM) or DMSO control. Cytosolic RNAs were isolated at 8 h after stress induction for RT-qPCR analysis to measure mitochondrial transcript levels. (B,C) Indicated MEFs were treated with 10 µM GTPP, thapsigargin (TG; 300 nM), or DMSO control. (B) Cell lysates were obtained 2 h after stress induction for Western blot analysis. Densitometry was performed by measuring p-eIF2α signal normalized to total eIF2α. Hsp90αβ was used as loading control. (C) Total RNAs were isolated at 8 h after stress induction for RT-qPCR to measure UPRMT- and ISR-related genes (n = 4). (D) Immunofluorescence staining was performed 1 h after stress induction to observe dsRNA accumulation. (E) MEFs were transfected with mitochondrial RNAs isolated from GTPP- or DMSO-treated cells, and total RNAs were isolated 12 h after transfection for RT-qPCR analysis to measure UPRMT- and ISR-related genes (n = 3). Data values presented as mean ± SD. * p < 0.0332, ** p < 0.0021, *** p < 0.0002, and **** p < 0.0001.
Figure 7
Figure 7
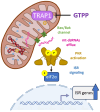
Role of mitochondrial dsRNAs and PKR in mitochondrial stress signal relay for UPRMT. When mitochondrial proteostasis is disturbed, mitochondrial RNA processing is impaired, leading to the accumulation of double-stranded mitochondrial RNAs. These dsRNAs are then exported to the cytosol via the Bax/Bak channel. In the cytosol, PKR binds to these mitochondrial dsRNAs and activates the integrated stress response (ISR) signaling cascade by phosphorylating eIF2α leading to the upregulation of ISR target genes.

Similar articles

References

    1. Giorgi C., Marchi S., Pinton P. The machineries, regulation and cellular functions of mitochondrial calcium. Nat. Rev. Mol. Cell Biol. 2018;19:713–730. doi: 10.1038/s41580-018-0052-8. - DOI - PubMed
    1. King N. Amino Acids and the Mitochondria. In: Schaffer S., Suleiman M., editors. Advances in Biochemistry in Health and Disease, Mitochondria. Volume 2 Springer; New York, NY, USA: 2007.
    1. Nowinski S.M., Solmonson A., Rusin S.F., Maschek J.A., Bensard C.L., Fogarty S., Jeong M.Y., Lettlova S., Berg J.A., Morgan J.T., et al. Mitochondrial fatty acid synthesis coordinates oxidative metabolism in mammalian mitochondria. Elife. 2020;9:e58041. doi: 10.7554/eLife.58041. - DOI - PMC - PubMed
    1. Wang L. Mitochondrial purine and pyrimidine metabolism and beyond. Nucleosides Nucleotides Nucleic Acids. 2016;35:578–594. doi: 10.1080/15257770.2015.1125001. - DOI - PubMed
    1. Mills E.L., Kelly B., O’Neill L.A.J. Mitochondria are the powerhouses of immunity. Nat. Immunol. 2017;18:488–498. doi: 10.1038/ni.3704. - DOI - PubMed

MeSH terms

Substances

LinkOut - more resources