. 2024 Jul 15;16(14):2544.
doi: 10.3390/cancers16142544.

Anticancer Effect of PtIIPHEN SS, PtII5ME SS, PtII56ME SS and Their Platinum(IV)-Dihydroxy Derivatives against Triple-Negative Breast Cancer and Cisplatin-Resistant Colorectal Cancer

Affiliations

Anticancer Effect of PtIIPHEN SS, PtII5ME SS, PtII56ME SS and Their Platinum(IV)-Dihydroxy Derivatives against Triple-Negative Breast Cancer and Cisplatin-Resistant Colorectal Cancer

Maria George Elias et al. Cancers (Basel). .

Abstract

Development of resistance to cisplatin, oxaliplatin and carboplatin remains a challenge for their use as chemotherapies, particularly in breast and colorectal cancer. Here, we compare the anticancer effect of novel complexes [Pt(1,10-phenanthroline)(1S,2S-diaminocyclohexane)](NO3)2 (PtIIPHENSS), [Pt(5-methyl-1,10-phenanthroline)(1S,2S-diaminocyclohexane)](NO3)2 (PtII5MESS) and [Pt(5,6-dimethyl-1,10-phenanthroline)(1S,2S-diaminocyclohexane)](NO3)2 (PtII56MESS) and their platinum(IV)-dihydroxy derivatives with cisplatin. Complexes are greater than 11-fold more potent than cisplatin in both 2D and 3D cell line cultures with increased selectivity for cancer cells over genetically stable cells. ICP-MS studies showed cellular uptake occurred through an active transport mechanism with considerably altered platinum concentrations found in the cytoskeleton across all complexes after 24 h. Significant reactive oxygen species generation was observed, with reduced mitochondrial membrane potential at 72 h of treatment. Late apoptosis/necrosis was shown by Annexin V-FITC/PI flow cytometry assay, accompanied by increased sub-G0/G1 cells compared with untreated cells. An increase in S and G2+M cells was seen with all complexes. Treatment resulted in significant changes in actin and tubulin staining. Intrinsic and extrinsic apoptosis markers, MAPK/ERK and PI3K/AKT activation markers, together with autophagy markers showed significant activation of these pathways by Western blot. The proteomic profile investigated post-72 h of treatment identified 1597 MDA-MB-231 and 1859 HT29 proteins quantified by mass spectroscopy, with several differentially expressed proteins relative to no treatment. GO enrichment analysis revealed a statistically significant enrichment of RNA/DNA-associated proteins in both the cell lines and specific additional processes for individual drugs. This study shows that these novel agents function as multi-mechanistic chemotherapeutics, offering promising anticancer potential, and thereby supporting further research into their application as cancer therapeutics.

Keywords: breast cancer; chemotherapy; cisplatin resistant; colorectal cancer; cytotoxic; mechanism; platinum(II); platinum(IV); proteomics.


Conflict of interest statement

The authors declare no conflicts of interest.

Figures

Scheme 1
Scheme 1
Chemical structures of PtIIPHENSS (A), PtII5MESS (B), PtII56MESS (C), PtIVPHENSS(OH)2 (D), PtIV5MESS(OH)2 (E) and PtIV56MESS(OH)2 (F).
Figure 1
Figure 1
Effect of platinum(II) and platinum(IV) complexes on the survival of cancer and normal epithelial cells: (A). MDA−MB−231, (B). MCF−7, (C). HT29, (D). A2780, (E). ADDP, (F). MCF10A. Cells were treated with 3-fold dilutions of the different agents Cisplatin, PtIIPHENSS, PtII5MESS, PtII56MESS, PtIVPHENSS(OH)2, PtIV5MESS(OH)2 or PtIV56MESS(OH)2 starting with a concentration of 150 µM and assayed for cell viability, as described in Section 2.3. Data points denote mean ± SEM from three independent experiments where samples were run in triplicate.
Figure 2
Figure 2
Effect of platinum(II) complexes on the survival of 3D Embedded (A). MDA−MB−231 networks, (B). MDA−MB−231 and (C). HT29 spheroids. Networks and spheroids were treated with 3-fold dilutions of the different agents (Cisplatin, PtIIPHENSS, PtII5MESS, PtII56MESS, PtIVPHENSS(OH)2, PtIV5MESS(OH)2, PtIV56MESS(OH)2) starting with a concentration of 150 µM and assayed for cell viability, as described in Section 2.4. Data points denote mean ± SEM from three independent experiments where samples were run in triplicate.
Figure 3
Figure 3
Cellular uptake of PtIIPHENSS, PtII5MESS, PtII56MESS, PtIVPHENSS(OH)2, PtIV5MESS(OH)2 and PtIV56MESS(OH)2: ICP-MS analysis of the uptake of platinum in (A). MDA−MB−231 and (B). HT29 cells at 0, 0.5, 1, 3, 6, 12, 24 and 30 h as described in Section 2.5. n = 3 from three independent experiments where samples were run in triplicate. Data points denote mean ± SEM and expressed in nmol/106cells. ** p < 0.01 and **** p < 0.0001 in comparison to cisplatin, as measured by two-way ANOVA.
Figure 4
Figure 4
Mode of cellular uptake of platinum in MDA−MB−231 and HT29. The intracellular amount of platinum was measured by ICP-MS after incubation at 37 °C or 4 °C, as well as following inhibition of the SLC7A5, transferrin receptor or clathrin-mediated endocytosis as described in Section 2.6. Data denote mean ± SEM of three independent experiments where samples were run in triplicate. * p < 0.05, ** p < 0.01, *** p < 0.001 and **** p < 0.0001 in comparison to the optimal conditions, as measured by one-way ANOVA.
Figure 5
Figure 5
Cellular localisation of platinum in MDA−MB−231 and HT29 post-24 h. The intracellular amount of Pt was measured by ICP-MS after cellular fractionation, as described in Section 2.7. Data denote mean ± SEM of three independent experiments where samples were run in triplicate. * p < 0.05, ** p < 0.01, *** p < 0.001 and **** p < 0.0001 in comparison to the fractions, as measured by one-way ANOVA.
Figure 6
Figure 6
Flow cytometric analysis of cell death mediated by Cisplatin, PtIIPHENSS, PtII5MESS, PtII56MESS, PtIVPHENSS(OH)2, PtIV5MESS(OH)2 and PtIV56MESS(OH)2. MDA−MB−231 and HT29 cells were treated with the complex and analysed at 72 h, as described in Section 2.8. Representative dot plots: (A). MDA−MB−231, (B). HT29 and Bar graphs (C). MDA−MB−231 and (D). HT29, representing percent viable, apoptotic and necrotic cells. Data points denote mean ± SEM. n = 3 from three independent experiments where samples were run in triplicate. * p < 0.05, ** p < 0.01, *** p < 0.001 and **** p < 0.0001 compared to control, as measured by one-way ANOVA.
Figure 7
Figure 7
Flow cytometric analysis of cell cycle mediated by Cisplatin, PtIIPHENSS, PtII5MESS, PtII56MESS, PtIVPHENSS(OH)2, PtIV5MESS(OH)2 and PtIV56MESS(OH)2. MDA−MB−231 and HT29 cells were treated with IC30 concentration of each complex and analysed at 72 h, as described in Section 2.9. Representative histogram plots: (A). MDA−MB−231, (B). HT29 and Bar graphs (C). MDA−MB−231 and (D). HT29, representing percent Sub G1, G0/G1, S and G2+M phases of cell cycle. Data points denote mean ± SEM. n = 3 from three independent experiments where samples were run in triplicate. * p < 0.05 compared to control, as measured by one-way ANOVA.
Figure 8
Figure 8
ROS production upon treatment with platinum(II) and (IV) complexes in MDA−MB−231 and HT29 and at 24, 48 and 72 h, as described in Section 2.10. PtIIPHENSS, PtII5MESS, PtII56MESS, PtIVPHENSS(OH)2, PtIV5MESS(OH)2, PtIV56MESS(OH)2, Cisplatin and TBHP: t-butyl hydroperoxide. Data points denote mean ± SEM. n = 3 from three independent experiments where samples were run in triplicate. * p < 0.05, ** p < 0.01, *** p < 0.001 and **** p < 0.0001 compared to control, as measured by one-way ANOVA.
Figure 9
Figure 9
MtMP changes upon treatment with platinum(II) (PtIIPHENSS, PtII5MESS and PtII56MESS) and platinum(IV) (PtIVPHENSS(OH)2, PtIV5MESS(OH)2 and PtIV56MESS(OH)2) complexes, as well as cisplatin in MDA−MB−231 and HT29 cells at 24, 48 and 72 h, as described in Section 2.11. Data points denote mean ± SEM. n = 3 from three independent experiments where samples were run in triplicate. ** p < 0.01 and **** p < 0.0001 compared with control, as measured by one-way ANOVA.
Figure 10
Figure 10
Effect of platinum complexes and cisplatin on β−tubulin and F−actin. Immunofluorescence upon treatment with PtII and PtIV complexes, as well as cisplatin in MDA−MB−231, MCF10A and HT29 cells at 72 h, as described in Section 2.12: (A). MDA−MB−231 airy scan images at 20×. (B). MDA−MB−231 cell size (µm2) (C). Actin expression in MDA−MB−231 (D). Tubulin expression in MDA−MB−231 (E). Edge/Cell ratio of actin expression in MDA−MB−231 (F). Edge/Cell ratio of tubulin expression in MDA−MB−231 (G). Nucleus/Cell ratio of actin expression in MDA−MB−231 (H). Nucleus/Cell ratio of tubulin expression in MDA−MB−231. (I). MCF10A airy scan images at 20×. (J). MCF10A cell size (µm2) (K). Actin expression in MCF10A. (L). Tubulin expression in MCF10A. (M). Edge/Cell ratio of actin expression in MCF10A. (N). Edge/Cell ratio of tubulin expression in MCF10A. (O). Nucleus/Cell ratio of actin expression in MCF10A. (P). Nucleus/Cell ratio of tubulin expression in MCF10A. (Q). HT29 airy scan images at 20×. (R). HT29 cell size (µm2) (S). Actin expression in HT29. (T). Tubulin expression in HT29. (U). Edge/Cell ratio of actin expression in HT29. (V). Edge/Cell ratio of tubulin expression in HT29. (W). Nucleus/Cell ratio of actin expression in HT29. (X). Nucleus/Cell ratio of tubulin expression in HT29. Data points denote mean ± SEM. n = 3 from three independent experiments. * p < 0.05, ** p < 0.01, *** p < 0.001 and **** p < 0.0001, as measured by one-way ANOVA.
Figure 10
Figure 10
Effect of platinum complexes and cisplatin on β−tubulin and F−actin. Immunofluorescence upon treatment with PtII and PtIV complexes, as well as cisplatin in MDA−MB−231, MCF10A and HT29 cells at 72 h, as described in Section 2.12: (A). MDA−MB−231 airy scan images at 20×. (B). MDA−MB−231 cell size (µm2) (C). Actin expression in MDA−MB−231 (D). Tubulin expression in MDA−MB−231 (E). Edge/Cell ratio of actin expression in MDA−MB−231 (F). Edge/Cell ratio of tubulin expression in MDA−MB−231 (G). Nucleus/Cell ratio of actin expression in MDA−MB−231 (H). Nucleus/Cell ratio of tubulin expression in MDA−MB−231. (I). MCF10A airy scan images at 20×. (J). MCF10A cell size (µm2) (K). Actin expression in MCF10A. (L). Tubulin expression in MCF10A. (M). Edge/Cell ratio of actin expression in MCF10A. (N). Edge/Cell ratio of tubulin expression in MCF10A. (O). Nucleus/Cell ratio of actin expression in MCF10A. (P). Nucleus/Cell ratio of tubulin expression in MCF10A. (Q). HT29 airy scan images at 20×. (R). HT29 cell size (µm2) (S). Actin expression in HT29. (T). Tubulin expression in HT29. (U). Edge/Cell ratio of actin expression in HT29. (V). Edge/Cell ratio of tubulin expression in HT29. (W). Nucleus/Cell ratio of actin expression in HT29. (X). Nucleus/Cell ratio of tubulin expression in HT29. Data points denote mean ± SEM. n = 3 from three independent experiments. * p < 0.05, ** p < 0.01, *** p < 0.001 and **** p < 0.0001, as measured by one-way ANOVA.
Figure 11
Figure 11
Cell migration (scratch wound healing assay). Percent relative wound density, wound confluence and wound width measured upon treatment with platinum(II) (PtIIPHENSS, PtII5MESS and PtII56MESS) and platinum(IV) (PtIVPHENSS(OH)2, PtIV5MESS(OH)2 and PtIV56MESS(OH)2) complexes, as well as cisplatin in (A). MDA−MB−231 and (B). HT29 cells up to 72 h, as described in Section 2.13. Data points denote mean ± SEM. n = 3 from three independent experiments where samples were run in triplicate. * p < 0.05, ** p < 0.01, *** p < 0.001 and **** p < 0.0001 compared with control, as measured by one-way ANOVA.
Figure 12
Figure 12
Protein expression upon treatment with platinum(II) (PtIIPHENSS (lane 3), PtII5MESS (lane 4) and PtII56MESS (lane 5)) and platinum(IV) (PtIIPHENSS(OH)2 (lane 6), PtIV5MESS(OH)2 (lane 7) and PtIV56MESS(OH)2 (lane 8)) complexes, as well as cisplatin (lane 2) in MDA−MB−231 and HT29 cells at 72 h, as described in Section 2.14: (A). MDA−MB−231 microtubule cytoskeleton markers (B). MDA−MB−231 cell proliferation markers (C). MDA−MB−231 intrinsic and extrinsic apoptotic cell death markers (D). MDA−MB−231 autophagy markers (E). HT29 microtubule cytoskeleton markers (F). HT29 cell proliferation markers (G). HT29 intrinsic and extrinsic apoptotic cell death markers (H). HT29 autophagy markers. Data points denote mean ± SEM. n = 3 from three independent experiments. * p < 0.05, ** p < 0.01, *** p < 0.001 and **** p < 0.0001 compared with control (lane 1), as measured by unpaired Student’s t-test. The full uncropped Western blot, with its corresponding molecular markers, is represented in Figures S24–S31.
Figure 12
Figure 12
Protein expression upon treatment with platinum(II) (PtIIPHENSS (lane 3), PtII5MESS (lane 4) and PtII56MESS (lane 5)) and platinum(IV) (PtIIPHENSS(OH)2 (lane 6), PtIV5MESS(OH)2 (lane 7) and PtIV56MESS(OH)2 (lane 8)) complexes, as well as cisplatin (lane 2) in MDA−MB−231 and HT29 cells at 72 h, as described in Section 2.14: (A). MDA−MB−231 microtubule cytoskeleton markers (B). MDA−MB−231 cell proliferation markers (C). MDA−MB−231 intrinsic and extrinsic apoptotic cell death markers (D). MDA−MB−231 autophagy markers (E). HT29 microtubule cytoskeleton markers (F). HT29 cell proliferation markers (G). HT29 intrinsic and extrinsic apoptotic cell death markers (H). HT29 autophagy markers. Data points denote mean ± SEM. n = 3 from three independent experiments. * p < 0.05, ** p < 0.01, *** p < 0.001 and **** p < 0.0001 compared with control (lane 1), as measured by unpaired Student’s t-test. The full uncropped Western blot, with its corresponding molecular markers, is represented in Figures S24–S31.
Figure 13
Figure 13
Differential proteins upon treatment with platinum(II) (PtIIPHENSS, PtII5MESS and PtII56MESS) and platinum(IV) (PtIVPHENSS(OH)2, PtIV5MESS(OH)2 and PtIV56MESS(OH)2) complexes, as well as cisplatin in (A). MDA−MB−231 and (B). HT29 cells at 72 h. UpSet plots summarise the differential protein expression analysis for the prodrugs and ligands. The differential protein expression analysis for the prodrugs and ligands is summarised in UpSet plots. Each figure’s bottom-left horizontal bar graph displays the total number of proteins with variations in log 2-fold change in expression for each complex. The same differentially expressed proteins that are shared by the complexes compared on the left are shown by the black circles connected to the right of these bar graphs. The vertical bar graph at the top quantifies the number of proteins with similar log 2-fold change expression differences in the drug comparisons.
Figure 14
Figure 14
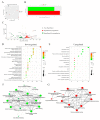
Proteomic analysis of MDA−MB−231 and HT29 upon treatment with PtII5MESS as described in Section 2.15: (A). MDA−MB−231 principal component analysis. (B). MDA−MB−231 number of differentially expressed proteins (DEPs). (C). MDA−MB−231 volcano plot of DEPs upregulated (red) and downregulated (green). GO enriched biological processes, cellular components, and molecular function in MDA−MB−231, (D). Downregulated and (E). Upregulated proteins. MDA−MB−231 pathway enrichment and gene act network analysis with the most significance of (F). Downregulated pathways; mRNA metabolic process, GTP binding and nucleoside activity and (G). Upregulated pathways; nucleotide binding and pyrophosphatase activity. (H). HT29 principal component analysis. (I). HT29 number of differentially expressed proteins (DEPs). (J). HT29 volcano plot of DEPs upregulated (red) and downregulated (green). GO enriched biological processes, cellular components, and molecular function in HT29, (K). Downregulated and (L). Upregulated proteins. HT29 pathway enrichment and gene act network analysis with the most significance of (M). Downregulated pathways; molecular metabolic and catabolic processes and RNA splicing and (N). Upregulated pathways; protein folding, response to toxic substance, detoxification, secretion, and exocytosis activity. Data points denote mean ± SEM. n = 3 from three independent experiments. For clarity, a larger representation is provided in the Supplementary Figure S22.
Figure 14
Figure 14
Proteomic analysis of MDA−MB−231 and HT29 upon treatment with PtII5MESS as described in Section 2.15: (A). MDA−MB−231 principal component analysis. (B). MDA−MB−231 number of differentially expressed proteins (DEPs). (C). MDA−MB−231 volcano plot of DEPs upregulated (red) and downregulated (green). GO enriched biological processes, cellular components, and molecular function in MDA−MB−231, (D). Downregulated and (E). Upregulated proteins. MDA−MB−231 pathway enrichment and gene act network analysis with the most significance of (F). Downregulated pathways; mRNA metabolic process, GTP binding and nucleoside activity and (G). Upregulated pathways; nucleotide binding and pyrophosphatase activity. (H). HT29 principal component analysis. (I). HT29 number of differentially expressed proteins (DEPs). (J). HT29 volcano plot of DEPs upregulated (red) and downregulated (green). GO enriched biological processes, cellular components, and molecular function in HT29, (K). Downregulated and (L). Upregulated proteins. HT29 pathway enrichment and gene act network analysis with the most significance of (M). Downregulated pathways; molecular metabolic and catabolic processes and RNA splicing and (N). Upregulated pathways; protein folding, response to toxic substance, detoxification, secretion, and exocytosis activity. Data points denote mean ± SEM. n = 3 from three independent experiments. For clarity, a larger representation is provided in the Supplementary Figure S22.
Figure 15
Figure 15
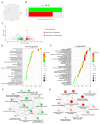
Proteomic analysis of MDA−MB−231 and HT29 upon treatment with PtII56MESS as described in Section 2.15: (A). MDA−MB−231 principal component analysis. (B). MDA−MB−231 number of differentially expressed proteins (DEPs). (C). MDA−MB−231 volcano plot of DEPs upregulated (red) and downregulated (green). GO enriched biological processes, cellular components and molecular function in MDA−MB−231 (D). Downregulated and (E). Upregulated proteins. MDA−MB−231 pathway enrichment and gene act network analysis with the most significance of (F). Downregulated pathways; translational initiation and mRNA metabolic process and (G). Upregulated pathways; localisation in cell, cellular organisation, protein localisation and exocytosis. (H). HT29 principal component analysis. (I). HT29 number of differentially expressed proteins (DEPs). (J). HT29 volcano plot of DEPs upregulated (red) and downregulated (green). GO enriched biological processes, cellular components and molecular function in HT29, (K). Downregulated and (L). Upregulated proteins. HT29 pathway enrichment and gene act network analysis with the most significance of (M). Downregulated pathways; RNA binding and nucleotide binding and (N). Upregulated pathways; ion transmembrane transport, active transport, and oxidoreductase activity. Data points denote mean ± SEM. n = 3 from three independent experiments. For clarity, a larger representation is provided in the Supplementary Figure S23.
Figure 15
Figure 15
Proteomic analysis of MDA−MB−231 and HT29 upon treatment with PtII56MESS as described in Section 2.15: (A). MDA−MB−231 principal component analysis. (B). MDA−MB−231 number of differentially expressed proteins (DEPs). (C). MDA−MB−231 volcano plot of DEPs upregulated (red) and downregulated (green). GO enriched biological processes, cellular components and molecular function in MDA−MB−231 (D). Downregulated and (E). Upregulated proteins. MDA−MB−231 pathway enrichment and gene act network analysis with the most significance of (F). Downregulated pathways; translational initiation and mRNA metabolic process and (G). Upregulated pathways; localisation in cell, cellular organisation, protein localisation and exocytosis. (H). HT29 principal component analysis. (I). HT29 number of differentially expressed proteins (DEPs). (J). HT29 volcano plot of DEPs upregulated (red) and downregulated (green). GO enriched biological processes, cellular components and molecular function in HT29, (K). Downregulated and (L). Upregulated proteins. HT29 pathway enrichment and gene act network analysis with the most significance of (M). Downregulated pathways; RNA binding and nucleotide binding and (N). Upregulated pathways; ion transmembrane transport, active transport, and oxidoreductase activity. Data points denote mean ± SEM. n = 3 from three independent experiments. For clarity, a larger representation is provided in the Supplementary Figure S23.
Figure 16
Figure 16
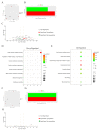
Proteomic analysis of MDA−MB−231 and HT29 upon treatment with cisplatin as described in Section 2.15: (A). MDA−MB−231 principal component analysis. (B). MDA−MB−231 number of differentially expressed proteins (DEPs). (C). MDA−MB−231 volcano plot of DEPs upregulated (red) and downregulated (green). GO enriched biological processes, cellular components and molecular function in MDA−MB−231, (D). Downregulated and (E). Upregulated proteins. (F). HT29 principal component analysis. (G). HT29 number of differentially expressed proteins (DEPs). (H). HT29 volcano plot of DEPs upregulated (red) and downregulated (green). Data points denote mean ± SEM. n = 3 from three independent experiments.

Similar articles

Cited by

References

    1. World Health Organization Cancer. [(accessed on 7 March 2024)]. Available online: https://www.who.int/health-topics/cancer#tab=tab_1.
    1. Roser M., Ritchie H. Cancer. Our World in Data. 2015. [(accessed on 7 March 2024)]. Available online: https://ourworldindata.org/cancer.
    1. Rosenberg B., Vancamp L., Krigas T. Inhibition of cell division in escherichia coli by electrolysis products from a platinum electrode. Nature. 1965;205:698–699. doi: 10.1038/205698a0. - DOI - PubMed
    1. Wiltshaw E. Cisplatin in the treatment of cancer-the first metal anti-tumour drug. Platin. Met. Rev. 1979;23:90–98. doi: 10.1595/003214079X2339098. - DOI
    1. Ghosh S. Cisplatin: The first metal based anticancer drug. Bioorg Chem. 2019;88:102925. doi: 10.1016/j.bioorg.2019.102925. - DOI - PubMed

Grants and funding

The authors thank Western Sydney University for its financial support. M.G.E. was supported through an Australian Postgraduate Award.

LinkOut - more resources