

Genome of the early spider-orchid Ophrys sphegodes provides insights into sexual deception and pollinator adaptation
- PMID: 39060266
- PMCID: PMC11282089
- DOI: 10.1038/s41467-024-50622-4
Genome of the early spider-orchid Ophrys sphegodes provides insights into sexual deception and pollinator adaptation
Abstract
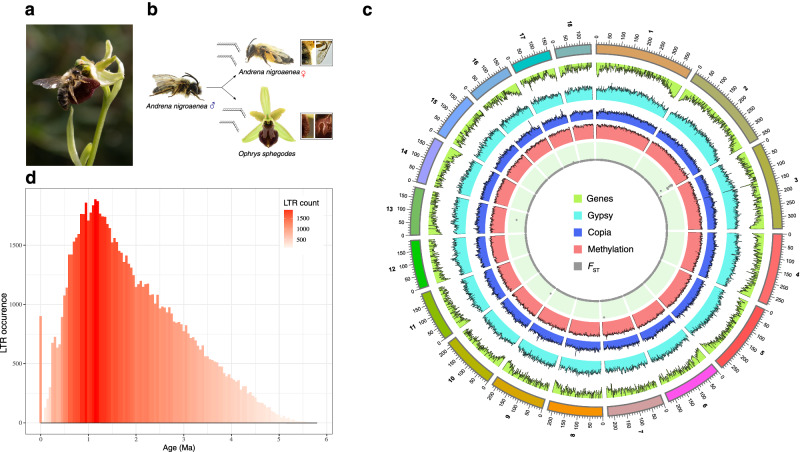
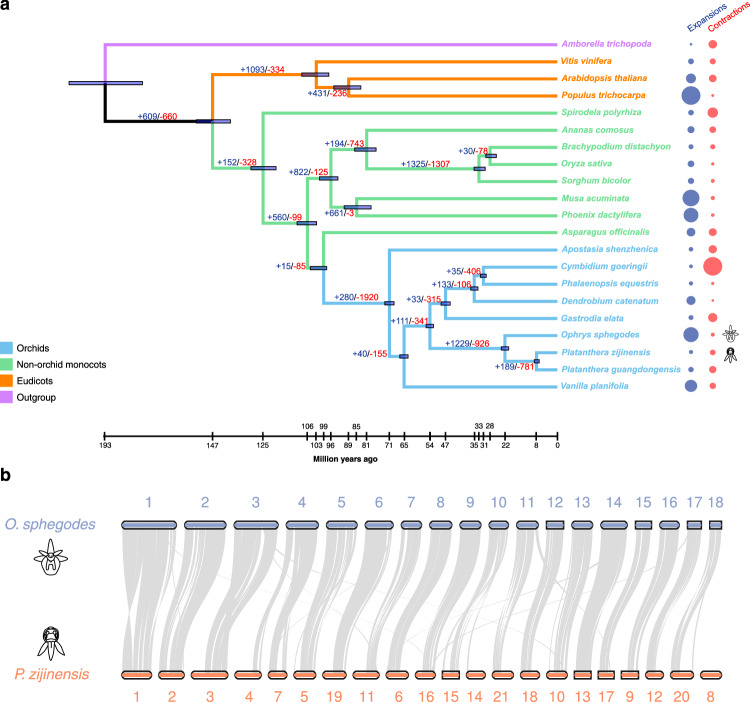
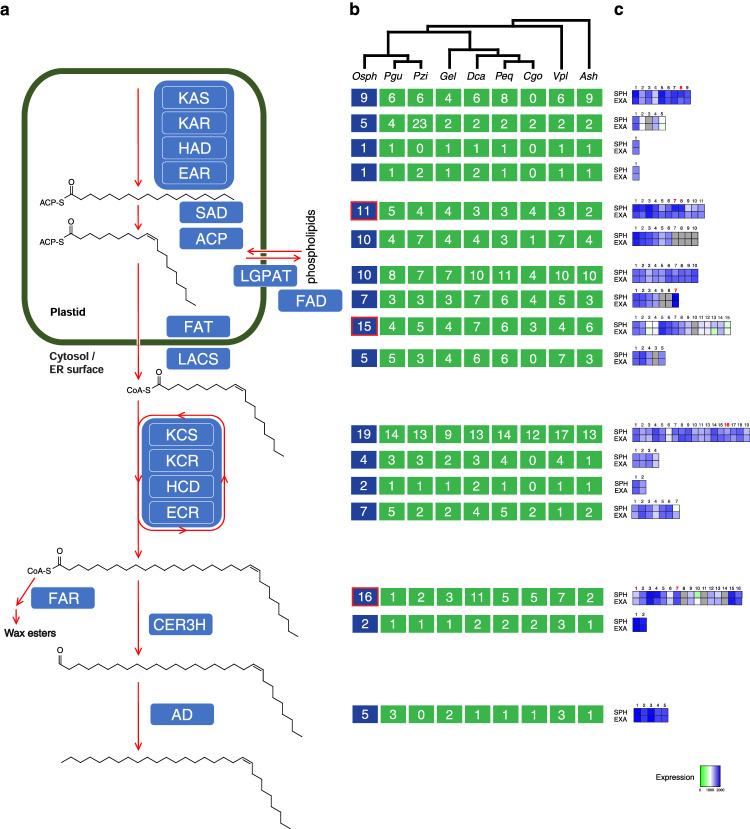
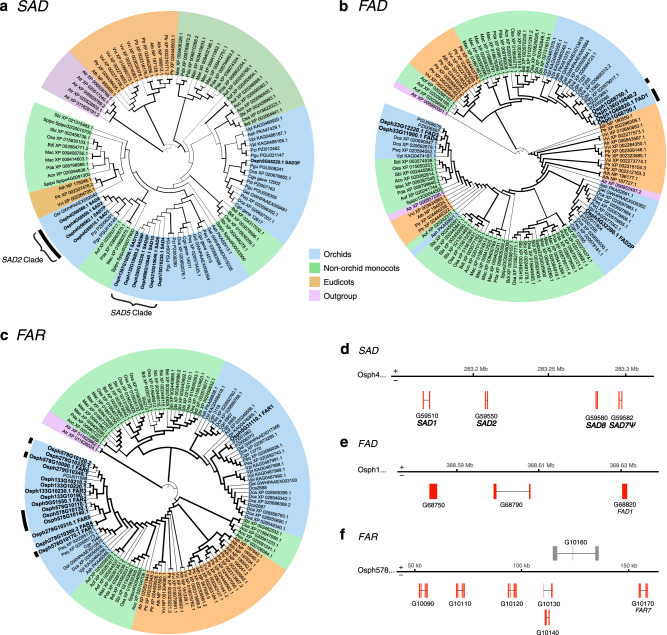
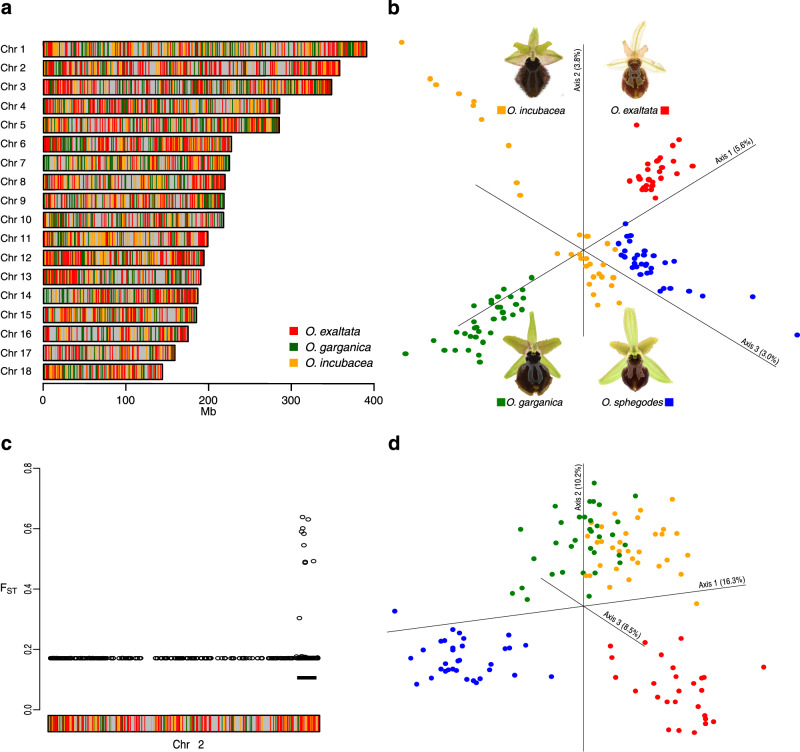
Pollinator-driven evolution of floral traits is thought to be a major driver of angiosperm speciation and diversification. Ophrys orchids mimic female insects to lure male pollinators into pseudocopulation. This strategy, called sexual deception, is species-specific, thereby providing strong premating reproductive isolation. Identifying the genomic architecture underlying pollinator adaptation and speciation may shed light on the mechanisms of angiosperm diversification. Here, we report the 5.2 Gb chromosome-scale genome sequence of Ophrys sphegodes. We find evidence for transposable element expansion that preceded the radiation of the O. sphegodes group, and for gene duplication having contributed to the evolution of chemical mimicry. We report a highly differentiated genomic candidate region for pollinator-mediated evolution on chromosome 2. The Ophrys genome will prove useful for investigations into the repeated evolution of sexual deception, pollinator adaptation and the genomic architectures that facilitate evolutionary radiations.
© 2024. The Author(s).
Conflict of interest statement
The authors declare no competing interests.
Figures
Similar articles
-
Pollinator shifts between Ophrys sphegodes populations: might adaptation to different pollinators drive population divergence?J Evol Biol. 2013 Oct;26(10):2197-208. doi: 10.1111/jeb.12216. Epub 2013 Aug 28. J Evol Biol. 2013. PMID: 23981167
-
The genetic basis of pollinator adaptation in a sexually deceptive orchid.PLoS Genet. 2012;8(8):e1002889. doi: 10.1371/journal.pgen.1002889. Epub 2012 Aug 16. PLoS Genet. 2012. PMID: 22916031 Free PMC article.
-
Why are there so many bee-orchid species? Adaptive radiation by intra-specific competition for mnesic pollinators.Biol Rev Camb Philos Soc. 2020 Dec;95(6):1630-1663. doi: 10.1111/brv.12633. Epub 2020 Sep 21. Biol Rev Camb Philos Soc. 2020. PMID: 32954662 Review.
-
Orchid pollination by sexual deception: pollinator perspectives.Biol Rev Camb Philos Soc. 2011 Feb;86(1):33-75. doi: 10.1111/j.1469-185X.2010.00134.x. Biol Rev Camb Philos Soc. 2011. PMID: 20377574 Review.
-
Pre-adaptations and the evolution of pollination by sexual deception: Cope's rule of specialization revisited.Proc Biol Sci. 2012 Dec 7;279(1748):4786-94. doi: 10.1098/rspb.2012.1804. Epub 2012 Oct 10. Proc Biol Sci. 2012. PMID: 23055065 Free PMC article.
References
-
- Waser, N. M. Pollination, angiosperm speciation, and the nature of species boundaries. Oikos82, 198–201 (1998).10.2307/3546930 - DOI
MeSH terms
Substances
Grants and funding
- University Research Priority Program "Evolution in Action: from Genomes to Ecosystems"/Universität Zürich (University of Zurich)
- University Research Priority Program "Evolution in Action: from Genomes to Ecosystems"/Universität Zürich (University of Zurich)
- 31003A_155943/Schweizerischer Nationalfonds zur Förderung der Wissenschaftlichen Forschung (Swiss National Science Foundation)
- IZLRZ3_163885/Schweizerischer Nationalfonds zur Förderung der Wissenschaftlichen Forschung (Swiss National Science Foundation)
- 446145319/Deutsche Forschungsgemeinschaft (German Research Foundation)
LinkOut - more resources
Full Text Sources
