. 2024 Jul 22:119:e230186.
doi: 10.1590/0074-02760230186. eCollection 2024.

Cytopathic effects in Mimivirus infection: understanding the kinetics of virus-cell interaction

Affiliations

Cytopathic effects in Mimivirus infection: understanding the kinetics of virus-cell interaction

Gabriel Henrique Pereira Nunes et al. Mem Inst Oswaldo Cruz. .

Abstract

Background: Giant viruses have brought new insights into different aspects of virus-cell interactions. The resulting cytopathic effects from these interactions are one of the main aspects of infection assessment in a laboratory routine, mainly reflecting on the morphological features of an infected cell.

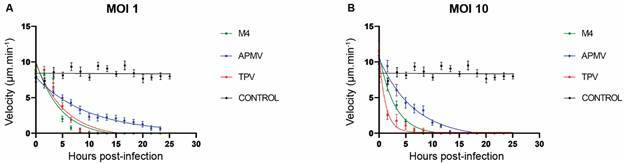
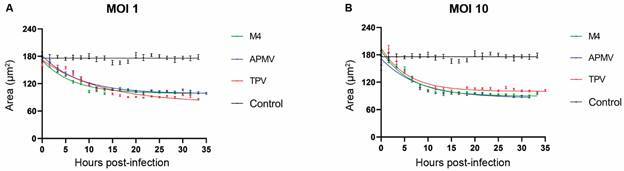
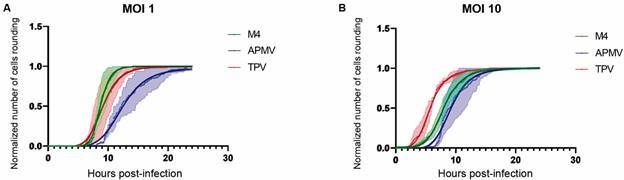
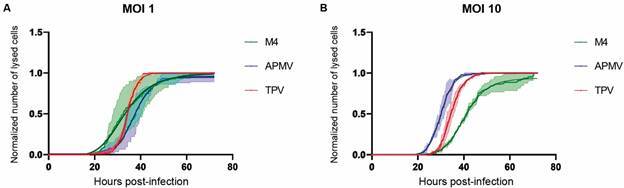
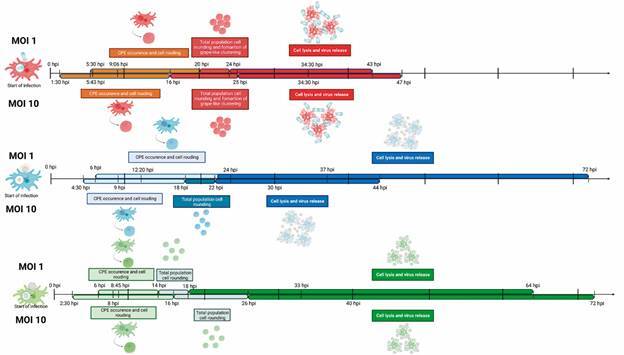
Objectives: In this work, we follow the entire kinetics of the cytopathic effect in cells infected by viruses of the Mimiviridae family, spatiotemporally quantifying typical features such as cell roundness, loss of motility, decrease in cell area and cell lysis.

Methods: Infections by Acanthamoeba polyphaga mimivirus (APMV), Tupanvirus (TPV) and M4 were carried out at multiplicity of infection (MOI) 1 and MOI 10 in Acanthamoeba castellanii. Monitoring of infections was carried out using time lapse microscopy for up to 72 hours. The images were analyzed using ImageJ software.

Findings: The data obtained indicate that APMV is the slowest virus in inducing the cytopathic effects of rounding, decrease in cell area, mobility and cell lysis. However, it is the only virus whose MOI increase accelerates the lysis process of infected cells. In turn, TPV and M4 rapidly induce morphological and behavioral changes.

Main conclusions: Our results indicate that mimiviruses induce different temporal responses within the host cell and that it is possible to use these kinetic data to facilitate the understanding of infection by these viruses.


Conflict of interest statement

All authors have read and agreed to the published version of the manuscript

Figures

Fig. 1:
Fig. 1:. Acanthamoeba castellanii at different stages of giant virus infection showing the steps of cytopathic effects. Images of Acanthamoeba polyphaga mimivirus, Tupanvirus and M4, induced infections at multiplicity of infection 10 were selected. A-D: uninfected A. castellanii trophozoites were used as control. Cell morphology did not change over time of infection. E, I and M: early stages of infection where cells were still in trophozoite morphology. F, J and N: initial stage of the cytopathic effects, where there was a mixture of fully rounded cells (red arrows), with trophozoite cells and also cells between these two stages (white arrows). G, K and O: consolidation of the cell rounding in all cells in the field (red arrows). H, L and P: beginning of cell lysis. Yellow arrows indicate cell debris from lysed cells, red rows indicate fully rounded cells (before cell lysis). The scale bar represents 40 µm.
Fig. 2:
Fig. 2:. cell motility throughout Acanthamoeba castellanii infections by giant virus. Graphs showing the variation in velocity of A. castellanii cells infected by Acanthamoeba polyphaga mimivirus (blue), Tupanvirus (red) and M4 (green) at multiplicity of infection 1 (A) and 10 (B) over time. Uninfected A. castellanii cells were used as control (black curves in A and B). The dots represent the mean velocity value (with its standard error of the mean value represented by the vertical bar) for each timepoint and condition in the graph, while the curves represent the exponential fits according to Eq. (2).
Fig. 3:
Fig. 3:. loss of cellular area throughout the infection of Acanthamoeba castellanii by giant virus. Graphs showing the variation in area of cells infected by Acanthamoeba polyphaga mimivirus (blue), Tupanvirus (red) and M4 (green) in infections with multiplicity of infection 1 (A) and 10 (B) over time. Uninfected A. castellanii cells were used as control (black curves in A and B). The dots represent the mean area value (with its standard error of the mean value represented by the vertical bar) for each time point and condition in the graphs, while the curves represent the exponential fits according to Eq. (3).
Fig. 4:
Fig. 4:. characterization of the rounding kinetics of Acanthamoeba castellanii cells infected by each of the three viruses used in this study. Acanthamoeba polyphaga mimivirus (blue), Tupanvirus (red) and M4 (green) at multiplicity of infection 1 (A) and 10 (B). The green, blue and red curves represent the normalized number of rounded cells (with its range of standard error of the mean values represented by the light green, red or blue region) over time. The dark green, dark blue and dark red curves represent the four-parameter logistic sigmoidal fits according to Eq. (1).
Fig. 5:
Fig. 5:. characterization of the lysis kinetics of Acanthamoeba castellanii cells infected by each of the three viruses used in this study. Acanthamoeba polyphaga mimivirus (blue), Tupanvirus (red) and M4 (green) at multiplicity of infection 1 (A) and 10 (B). The green, blue and red curves represent the normalized number of lysed cells (with its range of standard error of the mean values represented by the light green, blue or red region) over time. The dark green, dark blue and dark red curves represent the four parameter logistic sigmoidal fits according to Eq. (4).
Fig. 6:
Fig. 6:. timeline characterization of cytopathic effects in Tupanvirus (A), Acanthamoeba polyphaga mimivirus (B) and M4 (C) infections in Acanthamoeba castellanii cells at multiplicity of infection 1 (top line) and 10 (bottom line). Description of the morphological changes of the cells throughout the infection and delimitation of the times of occurrence of each cytopathic effect (Table). hpi: hours post-infection.

Similar articles

References

    1. Cassedy A, Parle-McDermott A. O'Kennedy R Virus detection a review of the current and emerging molecular and immunological methods. Front Mol Biosci. 2021;8:1–21. - PMC - PubMed
    1. Wang TE, Chao TL, Tsai HT, Lin PH, Tsai YL, Chang SY. Differentiation of cytopathic effects (CPE) induced by influenza virus infection using deep convolutional neural networks (CNN) PLoS Comput Biol. 2020;16(5):e1007883. - PMC - PubMed
    1. Dornas FP, Khalil JYB, Pagnier I, Raoult D, Abrahão J, La Scola B. Isolation of new Brazilian giant viruses from environmental samples using a panel of protozoa. Front Microbiol. 2015;6:1–9. - PMC - PubMed
    1. Abrahão J, Silva L, Silva LS, Khalil JYB, Rodrigues R, Arantes T. Tailed giant Tupanvirus possesses the most complete translational apparatus of the known virosphere. Nat Commun. 2018;9(1):749–749. - PMC - PubMed
    1. Borges I, Rodrigues RAL, Dornas FP, Almeida G, Aquino I, Bonjardim CA. Trapping the enemy Vermamoeba vermiformis circumvents Faustovirus Mariensis dissemination by enclosing viral progeny inside cysts. J Virol. 2019;93(14):e00312–e00319. - PMC - PubMed

MeSH terms

LinkOut - more resources