. 2024 Jul 24;14(1):17.
doi: 10.1186/s13395-024-00349-z.

AAV-NRIP gene therapy ameliorates motor neuron degeneration and muscle atrophy in ALS model mice

Affiliations

AAV-NRIP gene therapy ameliorates motor neuron degeneration and muscle atrophy in ALS model mice

Hsin-Hsiung Chen et al. Skelet Muscle. .

Abstract

Background: Amyotrophic lateral sclerosis (ALS) is characterized by progressive motor neuron (MN) degeneration, leading to neuromuscular junction (NMJ) dismantling and severe muscle atrophy. The nuclear receptor interaction protein (NRIP) functions as a multifunctional protein. It directly interacts with calmodulin or α-actinin 2, serving as a calcium sensor for muscle contraction and maintaining sarcomere integrity. Additionally, NRIP binds with the acetylcholine receptor (AChR) for NMJ stabilization. Loss of NRIP in muscles results in progressive motor neuron degeneration with abnormal NMJ architecture, resembling ALS phenotypes. Therefore, we hypothesize that NRIP could be a therapeutic factor for ALS.

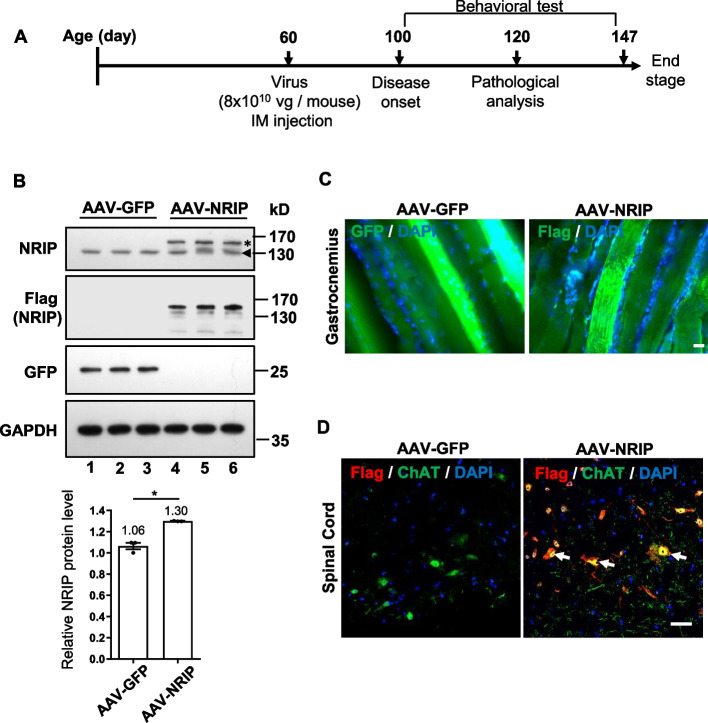
Methods: We used SOD1 G93A mice, expressing human SOD1 with the ALS-linked G93A mutation, as an ALS model. An adeno-associated virus vector encoding the human NRIP gene (AAV-NRIP) was generated and injected into the muscles of SOD1 G93A mice at 60 days of age, before disease onset. Pathological and behavioral changes were measured to evaluate the therapeutic effects of AAV-NRIP on the disease progression of SOD1 G93A mice.

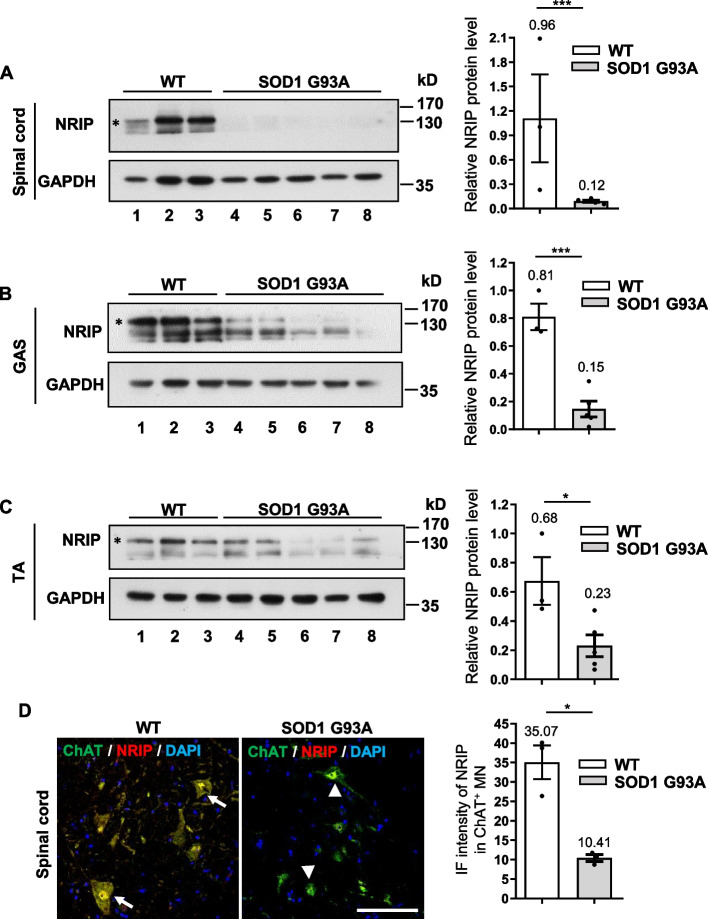
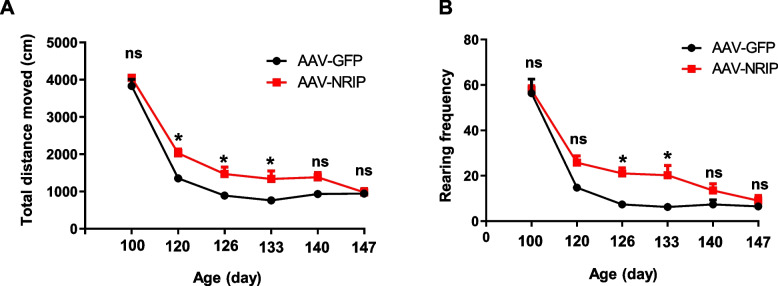
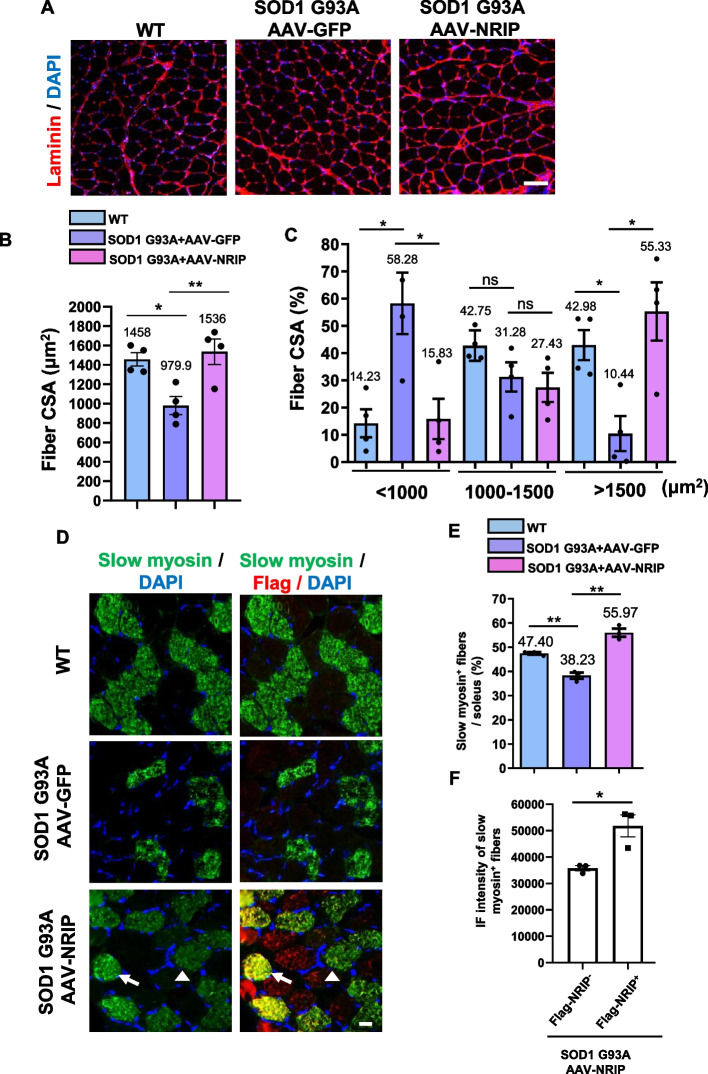
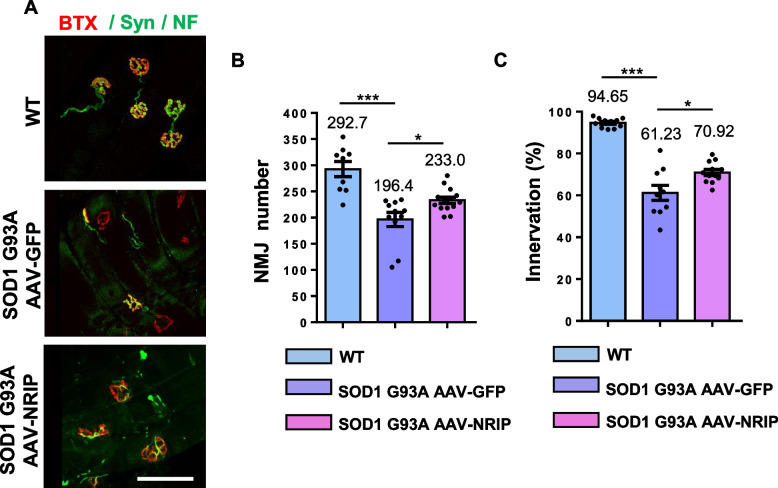
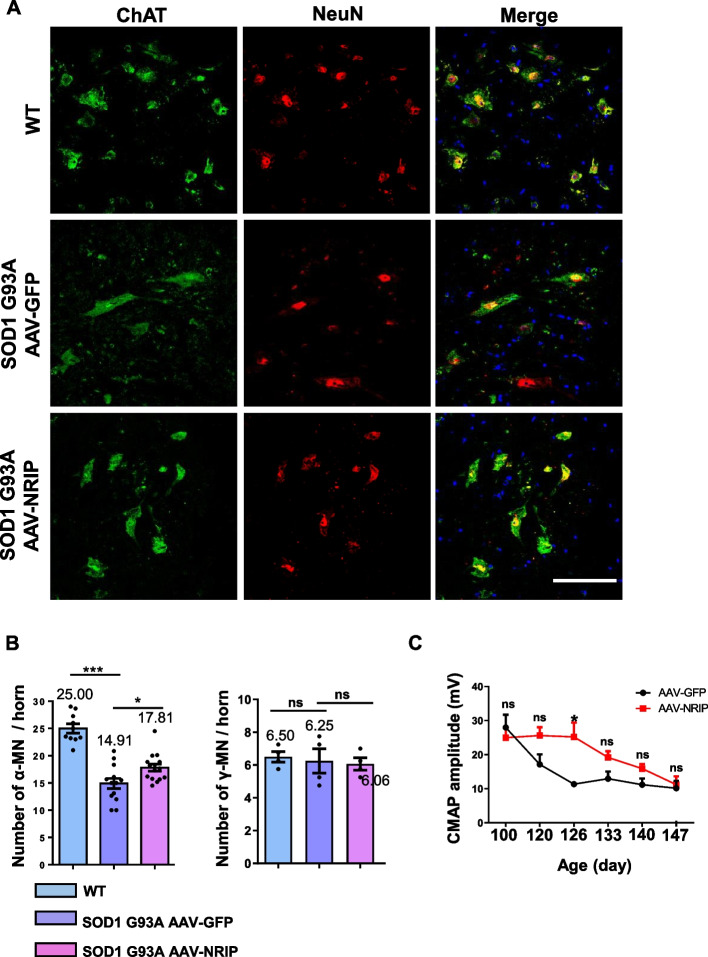
Results: SOD1 G93A mice exhibited lower NRIP expression than wild-type mice in both the spinal cord and skeletal muscle tissues. Forced NRIP expression through AAV-NRIP intramuscular injection was observed in skeletal muscles and retrogradely transduced into the spinal cord. AAV-NRIP gene therapy enhanced movement distance and rearing frequencies in SOD1 G93A mice. Moreover, AAV-NRIP increased myofiber size and slow myosin expression, ameliorated NMJ degeneration and axon terminal denervation at NMJ, and increased the number of α-motor neurons (α-MNs) and compound muscle action potential (CMAP) in SOD1 G93A mice.

Conclusions: AAV-NRIP gene therapy ameliorates muscle atrophy, motor neuron degeneration, and axon terminal denervation at NMJ, leading to increased NMJ transmission and improved motor functions in SOD1 G93A mice. Collectively, AAV-NRIP could be a potential therapeutic drug for ALS.

Keywords: AAV; ALS; Gene therapy; Motor neuron; Muscle; NRIP; Neuromuscular junction; SOD1 G93A.


Conflict of interest statement

The authors declare no competing interests.

Figures

Fig. 1
Fig. 1
Low NRIP expression in the spinal cord and skeletal muscles of SOD1 G93A mice. A NRIP expression in the spinal cord at age of 56 days WT and SOD1 G93A mice. Mice were euthanized, and transcardial perfusion with PBS was performed to remove blood from tissues. Total proteins from L3-L5 spinal cord were subjected to Western blot (WB) analysis for NRIP expression, with GAPDH serving as the loading control. The asterisk indicates the representative band for NRIP expression. The right panel represents the quantification of NRIP expression conducted through densitometry analysis. B NRIP expression in the gastrocnemius (GAS) muscles. The asterisk indicates the representative band for NRIP expression. The right panel illustrates the quantification. C NRIP expression in the tibialis anterior (TA) muscles. The asterisk indicates the representative band for NRIP expression. The right panel shows the quantification. WT, N = 3 mice; SOD1 G93A, N = 5 mice. D NRIP expression in the lumbar segment of the spinal cord at the age of 56 days WT and SOD1 G93A mice. The 30 μm-thick sections were co-stained with anti-ChAT (green) and anti-NRIP (red) antibodies to detect NRIP expression in spinal cord motor neurons. DAPI was used as the nuclear counterstain. Arrows indicate high NRIP expression in ChAT-positive neurons, while arrowheads indicate low NRIP expression in ChAT-positive neurons. Scale bar: 100 μm. Right panel: Quantification of the immunofluorescence intensity of NRIP in ChAT-positive neurons from WT mice (N = 3) and SOD1 G93A mice (N = 3). Data are presented as mean ± SEM. Statistical analysis was conducted using the Student t-test. *P < 0.05 and ***P < 0.001
Fig. 2
Fig. 2
The gene therapy of SOD1 G93A via intramuscular injection of AAV-NRIP (A) Schematic representation of AAV-NRIP gene therapy. AAV-NRIP and AAV-GFP were delivered into the gastrocnemius (GAS) muscles of SOD1 G93A mice at postnatal day 60 through intramuscular injection. Behavioral tests were conducted from the age of 100 days (post-infection day 40) to 147 days (post-infection day 87). B Expression of NRIP in GAS muscles of AAV-NRIP treated SOD1 G93A mice. Protein extracts from the GAS muscles were collected at the end stage of the experiment and assessed for the expression of exogenous NRIP (Flag-NRIP) and GFP. The endogenous NRIP NRIP was detected by the anti-NRIP antibody. The asterisk indicated the Flag-NRIP expression; the arrowhead indicated the endogenous NRIP expression. GAPDH was the loading control. AAV-GFP group, N = 3 mice; AAV-NRIP group, N = 3 mice. C NRIP expression in muscles from AAV-GFP treated or AAV-NRIP treated SOD1 G93A mice. Immunofluorescence (IF) analysis for exogenous NRIP (right) expression with an anti-Flag antibody and GFP (left) expression with the anti-GFP antibody in GAS muscles. D NRIP retrograde expression in cholinergic neurons of the spinal cord from AAV-GFP treated or AAV-NRIP treated SOD1 G93A mice. IF stain for exogenous NRIP expression in the spinal cord. The Flag-NRIP expression was detected using an anti-Flag antibody (red), and the cholinergic neurons were stained using an anti-ChAT antibody (green). ChAT-positive neurons expressing Flag-NRIP are indicated by arrows. DAPI was the nuclear counterstain. Scale bars: 100 μm
Fig. 3
Fig. 3
AAV-NRIP gene therapy improves locomotor activity in SOD1 G93A mice. A Total distance moved by SOD1 G93A mice with AAV-GFP or AAV-NRIP treatment. From the age of 100 days (post-infection day 40) to 147 days (post-infection day 87), the movement of the mice for 10 min was recorded using EthoVision Video Tracking Software (Noldus). The total distance moved (total distance mice traveled in the box) was measured during the test. Data are presented as mean ± SEM. *P = 0.019 at the age of 120 days; *P = 0.0452 at the age of 126 days; *P = 0.0494 at the age of 133 days; ns, no significance; one-way ANOVA with Tukey’s post hoc test. B Rearing frequency (frequency at which the mice stand on their hindlimbs in the box). The number of rearing was measured from the age of 100 days to 147 days. Data are presented as mean ± SEM. *P = 0.0496 at the age of 126 days; *P = 0.0382 at the age of 133 days; ns, no significance; one-way ANOVA with Tukey’s post hoc test
Fig. 4
Fig. 4
AAV-NRIP treated SOD1 G93A mice increase myofiber size and slow myosin expression. A Myofiber size in SOD1 G93A mice treated with AAV-NRIP. Soleus muscles were stained with anti-laminin (red) to define the muscle fiber borders. DAPI was used for nuclear staining. Scale bars: 50 μm. B The average myofiber cross-sectional area (CSA) was measured from WT and SOD1 G93A mice treated with AAV-GFP or AAV-NRIP. The CSA of all myofibers circumscribed by laminin was measured using ImageJ software (N = 4 for each group). Data are presented as mean ± SEM. *P = 0.0214 (WT vs. SOD1 G93A + AAV-GFP); **P = 0.0093 (SOD1 G93A + AAV-GFP vs. SOD1 G93A + AAV-NRIP); one-way ANOVA with Tukey’s post hoc test. C Distribution of different myofiber sizes in soleus muscles from WT and SOD1 G93A mice treated with AAV-GFP and AAV-NRIP. The CSA of myofibers was categorized into three groups based on size (< 1000 μm2, 1000–1500 μm2, or > 1500 μm2). The percentage of each categorized myofiber size relative to the total myofibers was calculated to assess the effect of AAV-NRIP on myofiber CSA (N = 4 for each group). Data are presented as mean ± SEM. *P = 0.0146 (< 1000 μm2, WT vs. SOD1 G93A + AAV-GFP); *P = 0.0168 (< 1000 μm2, SOD1 G93A + AAV-GFP vs. SOD1 G93A + AAV-NRIP); *P = 0.0390 (> 1500 μm2, WT vs. SOD1 G93A + AAV-GFP); *P = 0.0137 (> 1500 μm2, SOD1 G93A + AAV-GFP vs. SOD1 G93A + AAV-NRIP); one-way ANOVA with Tukey’s post hoc test. D AAV-NRIP increases slow myosin expression in the soleus muscle of SOD1 G93A mice. The soleus muscles were co-stained with anti-slow myosin and anti-Flag antibodies to visualize oxidative fibers (green) and Flag-NRIP expression (red). DAPI was used for nuclear staining. Scale bars: 50 μm. E Proportion of slow myosin-positive myofibers relative to the total myofibers (N = 3 for each group). Data are presented as mean ± SEM. **P = 0.0053 (WT vs. SOD1 G93A + AAV-GFP); **P = 0.0012 (SOD1 G93A + AAV-GFP vs. SOD1 G93A + AAV-NRIP); one-way ANOVA with Tukey’s post hoc test. F Fluorescence intensity of slow myosin in myotubes with or without Flag-NRIP expression in AAV-NRIP treated SOD1 G93A mice (N = 3 mice). Data are presented as mean ± SEM. Statistical analysis was conducted using Student t-test for panel F. *P < 0.05
Fig. 5
Fig. 5
AAV-NRIP gene therapy increases NMJ number and axon terminal innervation at NMJ in SOD1 G93A mice. A Immunofluorescence analysis of NMJ and axon terminal innervation at NMJ. GAS muscles were incubated with α-BTX (red) and anti-Syn/NF antibodies (green). Scale bar: 100 μm. B Quantification of NMJ number in GAS muscles from WT mice (N = 9) and SOD1 G93A mice treated with AAV-GFP (N = 11) and AAV-NRIP (N = 14) at the age of 120 days. Quantification analysis of NMJ number was counted from the sum of three Sects. (30 μm thickness) of GAS muscles from each mouse. Data are presented as mean ± SEM. ***P = 0.0002 (WT vs. SOD1 G93A + AAV-GFP); *P = 0.0481 (SOD1 G93A + AAV-GFP vs. SOD1 G93A + AAV-NRIP); one-way ANOVA with Tukey’s post hoc test. C Axon terminal innervation at NMJ. The co-staining of α-BTX and synaptophysin indicated axon terminal innervation at NMJ of GAS muscles. WT mice (N = 11), SOD1 G93A mice infected with AAV-GFP (N = 10), and AAV-NRIP (N = 12) were analyzed. Quantification analysis of NMJ innervation is defined as the percentage of innervated NMJ to total NMJ number. Data are presented as mean ± SEM. ***P = 0.0002 (WT vs. SOD1 G93A + AAV-GFP); *P = 0.0183 (SOD1 G93A + AAV-GFP vs. SOD1 G93A + AAV-NRIP); one-way ANOVA with Tukey’s post hoc test
Fig. 6
Fig. 6
AAV-NRIP gene therapy improves α-MN survival and muscle electrophysiology in SOD1 G93A mice. A The therapeutic effect on MN number. Tissue sections from the L3-L5 spinal cord were stained with anti-NeuN and anti-ChAT antibodies to detect α-MN expression and were analyzed by confocal microscopy. Sizes larger than 500 μm2 were counted as α-MN. Scale bar: 100 μm. B Left panel: Quantification of α-MN numbers per spinal anterior horn in WT mice (N = 9) and SOD1 G93A mice treated with AAV-GFP (N = 11) and AAV-NRIP (N = 14). Data are presented as mean ± SEM. ***P = 0.0003 (WT vs. SOD1 G93A + AAV-GFP); *P = 0.0302 (SOD1 G93A + AAV-GFP vs. SOD1 G93A + AAV-NRIP); one-way ANOVA with Tukey’s post hoc test. Right panel: Quantification of γ-MN numbers per spinal anterior horn in WT mice and SOD1 G93A mice treated with AAV-GFP and AAV-NRIP (N = 4 for each group). Data are presented as mean ± SEM. ns, no significance; one-way ANOVA with Tukey’s post hoc test. C Compound muscle action potential (CMAP) analysis. The stimulation electrode was placed at the lumbar root, and the active recorder was placed at the GAS muscles of the mice, and the reference recorder was placed at the paw of the hindlimb. Data are presented as mean ± SEM. *P = 0.0147 at the age of 126 days; ns, no significance; one-way ANOVA with Tukey’s post hoc test

Similar articles

Cited by

References

    1. Kanning KC, Kaplan A, Henderson CE. Motor neuron diversity in development and disease. Annu Rev Neurosci. 2010;33:409–40. 10.1146/annurev.neuro.051508.135722 - DOI - PubMed
    1. Pasinelli P, Brown RH. Molecular biology of amyotrophic lateral sclerosis: insights from genetics. Nat Rev Neurosci. 2006;7(9):710–23. 10.1038/nrn1971 - DOI - PubMed
    1. Rothstein JD. Current hypotheses for the underlying biology of amyotrophic lateral sclerosis. Ann Neurol. 2009;65 Suppl 1:S3–9. - PubMed
    1. Bensimon G, Lacomblez L, Meininger V. A controlled trial of riluzole in amyotrophic lateral sclerosis. ALS/Riluzole Study Group. N Engl J Med. 1994;330(9):585–91. 10.1056/NEJM199403033300901 - DOI - PubMed
    1. Jiang J, Wang Y, Deng M. New developments and opportunities in drugs being trialed for amyotrophic lateral sclerosis from 2020 to 2022. Front Pharmacol. 2022;13:1054006. 10.3389/fphar.2022.1054006 - DOI - PMC - PubMed

MeSH terms

Substances

LinkOut - more resources