. 2024 Jul 5:15:1388517.
doi: 10.3389/fimmu.2024.1388517. eCollection 2024.

Suppression of interferon α and γ response by Huwe1-mediated Miz1 degradation promotes SARS-CoV-2 replication

Affiliations

Suppression of interferon α and γ response by Huwe1-mediated Miz1 degradation promotes SARS-CoV-2 replication

Vinothini Arunagiri et al. Front Immunol. .

Abstract

Severe Acute Respiratory Syndrome Coronavirus 2 (SARS-CoV-2) has been demonstrated to limit the host interferon response; however, the underlying mechanism remains unclear. Here, we found that SARS-CoV-2 infection upregulated the E3 ubiquitin ligase Huwe1, which in turn facilitated the degradation of the transcription factor Miz1. The degradation of Miz1 hampered interferon alpha and gamma responses, consequently fostering viral replication and impeding viral clearance. Conversely, silencing or inhibiting Huwe1 enhanced the interferon responses, effectively curbing viral replication. Consistently, overexpressing Miz1 augmented the interferon responses and limited viral replication, whereas silencing Miz1 had the opposite effect. Targeting Huwe1 or overexpressing Miz1 elicited transcriptomic alterations characterized by enriched functions associated with bolstered antiviral response and diminished virus replication. Further study revealed Miz1 exerted epigenetic control over the transcription of specific interferon signaling molecules, which acted as common upstream regulators responsible for the observed transcriptomic changes following Huwe1 or Miz1 targeting. These findings underscore the critical role of the Huwe1-Miz1 axis in governing the host antiviral response, with its dysregulation contributing to the impaired interferon response observed during COVID-19.

Keywords: HUWE1; Miz1; SARS-CoV-2; interferon alpha and gamma responses; transcriptional regulation.


Conflict of interest statement

The authors declare that the research was conducted in the absence of any commercial or financial relationships that could be construed as a potential conflict of interest. The author(s) declared that they were an editorial board member of Frontiers, at the time of submission. This had no impact on the peer review process and the final decision.

Figures
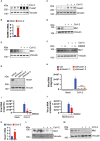
Figure 1
Figure 1
SARS-CoV-2 infection upregulates Huwe1 leading to the degradation of Miz1 protein. (A) Huwe1 protein expression and (B) Huwe1 mRNA expression in mock- or SARS-CoV-2 infected A549/hACE2 cells at 24 h post-infection. (C) Huwe1 protein expression in mock- or SARS-CoV-2 infected Vero E6 cells at 24 h post-infection. Miz1 protein expression in mock- or SARS-CoV-2 infected (D) A549/hACE2 cell and (E) Vero E6 cells at 24 h post-infection. (F) Miz1 protein expression in mock- or SARS-CoV-2 infected A549/hACE2 cells without or with BI8622 at 24 h post-infection. (G) Huwe1 protein expression in A549/hACE2 cells expressing shRNAs targeting Huwe1 at three different sites. (H) Viral titers in the cell culture supernatants from mock- or SARS-CoV-2 infected A549/hACE2 cells expressing shRNAs targeting Huwe1 at three different sites at 48 h post-infection. (I) Viral titers in the cell culture supernatants from mock- or SARS-CoV-2 infected A549/hACE2 cells without or with different doses of BI8622 at 48 h post-infection. +, 10 μM; ++, 20 μM. (J) Viral titers in the cell culture supernatants from mock- or SARS-CoV-2 infected Vero E6 cells without or with BI8622 at 48 h post-infection. (K) Huwe1 mRNA expression in untreated or SARS-CoV-2 infected K18-hACE2 mice. (L, M) Miz1 protein expression in untreated or SARS-CoV-2 infected K18-hACE2 mice at 2 d post-infection (L) or BALB/c mice at 3 d post-infection (M). In (B, H–J, K), values represent the mean ± SEM. n=3. Unpaired Student’s t-test was used. *p < 0.05; **p < 0.01; ***p < 0.001; ****p < 0.0001.
Figure 2
Figure 2
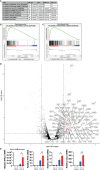
Silencing Huwe1 augments interferon signaling during SARS-CoV-2 infection. (A) GSEA showing enriched gene sets (FDR <0.25) by Huwe1 KD in SARS-CoV-2-infected A549/hACE2 cells at 24 h post-infection. (B, C) GSEA showing enrichment plots of the gene sets of “Interferon alpha response” (B) and “Interferon gamma response” (C) by Huwe1 KD in SARS-CoV-2 infected A549/hACE2 cells at 24 h post-infection. (D) Volcano plots showing fold change and p-values of the top differentially expressed genes enriched in the interferon pathways by Huwe1 KD in SARS-CoV-2 infected A549/hACE2 cells at 24 h post-infection. The horizontal line represents the q-value threshold of 0.05, while vertical lines indicate log fold change (log2FC) thresholds at 0.5 and -0.5. (E) mRNA expression of IFNL3, IFIT3, ISG15, and CCL5 by Huwe1 KD in mock- or SARS-CoV-2-infected A549/hACE2 cells at 24 h post-infection as analyzed by qRT-PCR. Values represent the mean ± SEM. n=3. Unpaired Student’s t-test was used. *p < 0.05; **p < 0.01.
Figure 3
Figure 3
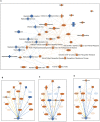
Silencing Huwe1 enhances the antiviral response during SARS-CoV-2 infection. (A) Using IPA core analysis, a visual representation of the most significant canonical pathways and biological networks resulting from Huwe1 KD in A549/hACE2 cells at 24 h post SARS-CoV-2 infection revealed interferon signaling and antiviral response. IPA upstream analysis revealed (B) IFNL1, (C) IFNA2, and (D) Interferon alpha gene cluster among the top upstream regulators responsible for the gene expression changes by Huwe1 KD in A549/hACE2 cells at 24 h post SARS-CoV-2 infection.
Figure 4
Figure 4
Inhibition of Huwe1 with BI8622 recapitulates the effects of HUWE1 silencing on interferon signaling and antiviral response during SARS-CoV-2 infection. (A) GSEA showing enriched gene sets (FDR <0.25) by inhibition of Huwe1 with BI8622 in SARS-CoV-2 infected A549/hACE2 cells at 24 h post-infection. (B, C) GSEA showing enrichment plots of the gene sets of “Interferon alpha response” and “Interferon gamma response” by inhibition of Huwe1 with BI8622 in SARS-CoV-2-infected A549/hACE2 cells at 24 h post-infection. (D) mRNA expression of IL6, CCL5, GCSF, and IL8 by inhibition of Huwe1 with BI8622 in mock- or SARS-CoV-2-infected A549/hACE2 cells at 24 h post-infection. Values represent the mean ± SEM. N=3. Unpaired Student’s t-test was used. *p < 0.05; **p < 0.01.
Figure 5
Figure 5
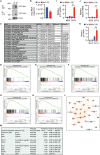
Miz1 overexpression enhances interferon signaling and antiviral response during SARS-CoV-2 infection. (A) Western blot analysis of exogenous GFP-Miz1 in stable A549/hACE2 cells overexpressing lentiviral GFP-tagged Miz1 (Miz1 OE cells). (B) Viral titers in the cell culture supernatants from SARS-CoV-2-treated A549/hACE2 cells expressing control lentiviral vector or lentiviral vector containing GFP-Miz1 at 48 h post infection. (C) GSEA showing enriched gene sets (FDR <0.25) by Miz1 overexpression in SARS-CoV-2-infected A549/hACE2 cells at 24 h post infection. (D-H) GSEA showing enrichment plots of the gene sets of “Interferon alpha response”, “Interferon gamma response”, “Inflammatory response”, “TNF signaling via NF-κB”, and “IL6 signaling” by Miz1 overexpression in SARS-CoV-2-infected A549/hACE2 cells at 24 h post infection. (I-K) mRNA expression of IFIT3, ISG15, and IL6 in mock- or SARS-CoV-2-infected control and Miz1 OE cells at 24 h post infection. (L) IPA core analysis identified interferon signaling and antiviral response as the most significant canonical pathways and biological networks affected by Miz1 overexpression in SARS-CoV-2-infected A549/hACE2 cells at 24 h post infection. (M) IPA upstream analysis revealed the top ten upstream regulators responsible for the gene expression changes by Miz1 overexpression in SARS-CoV-2-infected A549/hACE2 cells at 24 h post infection. In (B, I-K), Values represent the mean ± SEM. n=3. Unpaired Student’s t-test was used. **p < 0.01; ***p < 0.001.
Figure 6
Figure 6
Miz1 silencing suppresses interferon response during SARS-CoV-2 infection. (A) Protein expression of Miz1 in stable A549/hACE2 cells expressing shRNAs targeting Miz1 at three different sites. (B) GSEA showing downregulated enriched gene sets (FDR <0.25) in SARS-CoV-2-infected A549/hACE2 cells with Miz1 KD at 24 h post infection. (C) mRNA expression of IFNA1, IFIT3, ISG15, IFNG, GCSF, IL8 in mock- or SARS-CoV-2-infected A549/hACE2 cells with Miz1 KD at 24 h post infection. Values represent the mean ± SEM. N=3. Unpaired Student’s t-test was used. *p < 0.05; **p < 0.01; ***p < 0.001. (D) IPA upstream analysis revealing the top ten upstream regulators responsible for the gene expression changes by Miz1 KD in SARS-CoV-2-infected A549/hACE2 cells at 24 h post infection. (E) Causal Network Analysis in IPA identifying the top ten master regulators in the resulting causal networks.
Figure 7
Figure 7
Comparison analysis of RNA-seq data from Huwe1 KD or inhibitor, Miz1 OE, and Miz1 KD during SARS-CoV-2 infection using IPA. (A) Diseases and Functions Analysis of the RNA-seq data showing the top biological functions and diseases affected by Huwe1 KD or inhibition, Miz1 OE, and Miz1 KD in SARS-CoV-2-infected A549/hACE2 cells at 24 h post infection. (B) Upstream Regulator Analysis of the RNA-seq data showing the top upstream regulators responsible for the gene expression changes in each condition. (C) Causal Network Analysis of the RNA-seq data showing the top master regulators and their interactions in the resulting causal networks for each condition.
Figure 8
Figure 8
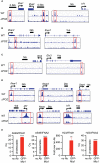
Miz1 epigenetically regulates interferon signaling molecules. (A-C) ChIP-seq tracks showing Miz1 binding on the promoter region (A), intronic region (B), or downstream (C) of the interferon signaling molecules as indicated. (D) ChIP-seq tracks showing H3K9/14ac on the promoter region of the interferon signaling molecules in MLE-12/Miz1(WT) and MLE-12/Miz1(ΔPOZ) as indicated. (E) ChIP-qPCR showing enrichment of Miz1 binding on the promoters of IFNA1 and IFNA2 in comparison to the no antibody (no Ab) control in A549 and NCI-H23 cells stably expressing GFP-Miz1 as indicated. Values represent the mean ± SEM. N=3. Unpaired Student’s t-test was used. **p < 0.01; ****p < 0.0001. In cases where the “no Ab” control yielded undetectable results, quantification cycle (Cq) values are presented instead of “Fold over no-Ab”.
Figure 9
Figure 9
Illustration of suppression of the interferon response by Huwe1-mediated degradation of Miz1. Upon SARS-CoV-2 infection, the RIG-I pathway activates the downstream IRF3/7 pathways. Concurrently, Huwe1 is upregulated, resulting in the ubiquitination and degradation of Miz1. In the absence of degradation, Miz1 facilitates the epigenetic upregulation of interferon signaling molecules through histone acetylation, effectively inhibiting viral replication.

Similar articles

References

    1. Lamers MM, Haagmans BL. SARS-coV-2 pathogenesis. Nat Rev Microbiol. (2022) 20:270–84. doi: 10.1038/s41579-022-00713-0 - DOI - PubMed
    1. Zhu N, Zhang D, Wang W, Li X, Yang B, Song J, et al. . A novel coronavirus from patients with pneumonia in China, 2019. N Engl J Med. (2020) 382:727–33. doi: 10.1056/NEJMoa2001017 - DOI - PMC - PubMed
    1. Murakami N, Hayden R, Hills T, Al-Samkari H, Casey J, Sorbo Del L, et al. . Therapeutic advances in COVID-19. Nat Rev Nephrol. (2023) 19:38–52. doi: 10.1038/s41581-022-00642-4 - DOI - PMC - PubMed
    1. Blanco-Melo D, Nilsson-Payant BE, Liu WC, Uhl S, Hoagland D, Møller R, et al. . Imbalanced host response to SARS-coV-2 drives development of COVID-19. Cell. (2020) 181:1036–1045.e9. doi: 10.1016/j.cell.2020.04.026 - DOI - PMC - PubMed
    1. Acharya D, Liu G, Gack MU. Dysregulation of type I interferon responses in COVID-19. Nat Rev Immunol. (2020) 20:397–8. doi: 10.1038/s41577-020-0346-x - DOI - PMC - PubMed

MeSH terms

Grants and funding

The author(s) declare financial support was received for the research, authorship, and/or publication of this article. JL is supported by the US National Institutes of Health (HL141459 to JL).

LinkOut - more resources