. 2024 Jul 20;15(1):6131.
doi: 10.1038/s41467-024-50464-0.

Ca2+ transients on the T cell surface trigger rapid integrin activation in a timescale of seconds

Affiliations

Ca2+ transients on the T cell surface trigger rapid integrin activation in a timescale of seconds

Yue Li et al. Nat Commun. .

Abstract

One question in lymphocyte homing is how integrins are rapidly activated to enable immediate arrest of fast rolling lymphocytes upon encountering chemokines at target vascular beds given the slow chemokine-induced integrin inside-out activation. Herein we demonstrate that chemokine CCL25-triggered Ca2+ influx induces T cell membrane-proximal external Ca2+ concentration ([Ca2+]ex) drop in 6 s from physiological concentration 1.2 mM to 0.3 mM, a critical extracellular Ca2+ threshold for inducing αLβ2 activation, triggering rapid αLβ2 activation and T cell arrest before occurrence of αLβ2 inside-out activation. Talin knockdown inhibits the slow inside-out activation of αLβ2 but not [Ca2+]ex drop-triggered αLβ2 quick activation. Blocking Ca2+ influx significantly suppresses T cell rolling-to-arrest transition and homing to skin lesions in a mouse psoriasis model, thus alleviating skin inflammation. [Ca2+]ex decrease-triggered rapid integrin activation bridges the gap between initial chemokine stimulation and slow integrin inside-out activation, ensuring immediate lymphocyte arrest and subsequent diapedesis on the right location.


Conflict of interest statement

The authors declare no competing interests.

Figures
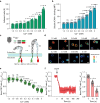
Fig. 1
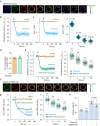
Fig. 1. Low extracellular Ca2+ condition induces rapid activation of integrin αLβ2.
Mouse splenic T cells were suspended in a buffer containing 0.6 mM Mg2+ plus the indicated concentration of Ca2+. 0 mM [Ca2+] means a Ca2+ concentration below the detection limit (2.34 μM Ca2+) of the Calcium Quantitation Kit (36361, AAT Bioquest). a ICAM-1 (20 μg/ml) was immobilized on petri dishes. Adhesion of T cells to the immobilized ICAM-1 substrates at a wall shear stress of 1 dyn/cm2 was examined (n = 6). b Binding of soluble ICAM-1 to T cells was calculated with the specific mean fluorescence intensity (MFI) (n = 6). c Schematic diagrams of the experimental setup for integrin αLβ2 tail FRET system (αLCloverβ2mRuby2) to monitor the separation of αLβ2 cytoplasmic domains (bottom) and the strategy to generate Itgal-LSL-Clover;Itgb2-LSL-mRuby2;CD4-Cre mice bearing T cells expressing αLCloverβ2mRuby2 (top). d Representative pseudocolored αLβ2 tail FRET ratio (FmRuby2/FClover) images of T cells expressing αLCloverβ2mRuby2 on the immobilized ICAM-1 (20 μg/ml) substrates. Scale bar, 6 µm. Images are from one representative experiment out of three. e Quantification of αLβ2 tail FRET ratio. The FRET ratio of each cell was normalized to the mean value of cells in 1.2 mM Ca2+. Data are presented as box-and-whisker plots showing the median (central line), 25th–75th percentile (bounds of the box), and 5th–95th percentile (whiskers) (n = 30 cells for each condition from 3 experiments). f Time course of αLβ2 tail FRET ratio change in T cells on the immobilized ICAM-1 (20 μg/ml) substrates upon chelation of Ca2+ with 5 mM EGTA in buffer containing 1.2 mM Ca2+ plus 0.6 mM Mg2+ (left). EGTA was added at time point 0. The FRET ratio change was normalized to the mean value of cells before EGTA treatment. The solid lines represent the mean; shaded areas, s.e.m. (n = 50 cells from 3 experiments). The statistic results at representative time points were shown (right). Data represent the mean ± s.e.m. in (a, b and f). ns, not significant (one-way ANOVA with Dunnett’s test in (a), Brown-Forsythe and Welch one-way ANOVA with Dunnett’s test in (b) and (e) to compare the means of different Ca2+ concentration groups to the mean of 1.2 mM Ca2+ group; one-way ANOVA with Dunnett’s test in (f) to compare the means of 15 s and 30 s groups to the mean of 0 s group). Source data are provided as a Source Data file.
Fig. 2
Fig. 2. Establishing a cell membrane-anchored CEPIAexternal to monitor T cell surface Ca2+ dynamics.
a Schematic diagrams of the experimental setup for the membrane-anchored CEPIAexternal (bottom) and the strategy to generate R26-LSL-CEPIAexternal;Itgal-LSL-Clover;Itgb2-LSL-mRuby2;CD4-Cre mice bearing T cells expressing both the CEPIAexternal and αLCloverβ2mRuby2 (top). b Representative fluorescence images of mouse splenic T cells showing the distribution of CEPIAexternal on the plasma membrane in Em450 and Em510 channels. Scale bar, 3 µm. Images are from one representative experiment out of three. c Immunoblot analysis of CEPIAexternal, integrin β1, and β-actin in the whole-cell lysate (total), cytosol or membrane fraction of mouse splenic T cells. Images are from one representative experiment out of three. d Representative fluorescence images of mouse splenic T cells showing the distribution of CEPIAexternal and the plasma membrane indicated by FM 4-64FX. Scale bar, 3 µm. Images are from one representative experiment out of three. e Representative pseudocoloured FEm450/FEm510 images of mouse splenic T cells in the indicated extracellular Ca2+ concentrations. Scale bar, 6 µm. Images are from one representative experiment out of three. f Fitted curve of CEPIAexternal ratio (FEm450/FEm510) in response to a series of concentrations of Ca2+. n = 60 cells from 3 experiments, the bars represent mean ± s.e.m. Source data are provided as a Source Data file.
Fig. 3
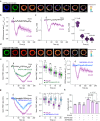
Fig. 3. Ionomycin induces [Ca2+]ex drop and integrin αLβ2 activation on T cell surface.
Splenic T cells were isolated from R26-LSL-CEPIAexternal;Itgal-LSL-Clover;Itgb2-LSL-mRuby2;CD4-Cre mice and suspended in buffer containing 1.2 mM Ca2+ and 0.6 mM Mg2+. Ionomycin (final concentration 1 μM) was added at time point 0. a Representative pseudocolor image of CEPIAexternal ratio on the T cell surface in response to ionomycin stimulation. The first two images show the distribution of CEPIAexternal in Em450 and Em510 channels. Scale bar, 3 µm. Images are from one representative experiment out of three. b Time course of CEPIAexternal ratio change on the T cell surface in response to ionomycin stimulation (n = 30 cells from 3 experiments). c [Ca2+]ex curve was plotted by converting the CEPIAexternal ratio in (b) to Ca2+ concentration according to the Ca2 calibration curve in Fig. 2f (left), and [Ca2+]ex values at the representative time points were shown (right) (n = 65 cells from 3 experiments). d Ca2+ concentration in the buffer was measured using a Calcium Colorimetric Assay Kit (S1063S, Beyotime) before and after ionomycin treatment (n = 6). e Time course of CEPIAexternal ratio change in T cells pretreated with 100 µM BAPTA-AM or DMSO vehicle control in response to ionomycin stimulation (left) and CEPIAexternal ratios at the representative time points were shown (right) (n = 60 cells from 3 experiments). f Representative pseudocolor images of the αLβ2 tail FRET ratio on the T cell surface in response to ionomycin stimulation. The first two images show the Clover and mRuby2 signals. Scale bar, 3 µm. Images are from one representative experiment out of three. g Time course of αLβ2 tail FRET ratio change in T cells pretreated with 100 µM BAPTA-AM or DMSO vehicle control in response to ionomycin stimulation (left), and the normalized FRET ratios at the representative time points were shown (right) (n = 60 cells from 3 experiments). The FRET ratio is normalized to the mean value of cells before the addition of stimuli (R/R0). h Effect of ionomycin treatment on the adhesion of T cells pretreated with 100 µM BAPTA-AM or DMSO vehicle control to the immobilized ICAM-1 (20 μg/ml) substrates at a wall shear stress of 1 dyn/cm2 (n = 3). The solid lines represent the mean; shaded areas, s.e.m. in (b, c, e, and g). Data represent the mean ± s.e.m. in (c, d, e, g and h). ns, not significant (unpaired two-tailed Student’s t test and unpaired two-tailed Welch’s unequal variance t test in (d, e, and g); one-way ANOVA with Dunnett’s test in (h). Source data are provided as a Source Data file.
Fig. 4
Fig. 4. Effects of ionomycin treatment on intracellular Ca2+ dynamics in T cells.
Splenic T cells from WT mice transfected with CEPIAer were suspended in a buffer containing 1.2 mM Ca2+ and 0.6 mM Mg2+. Ionomycin (final concentration 1 μM) was added at time point 0. a Cytosolic Ca2+ ([Ca2+]cyto) change was detected by Fluo-4 in T cells pretreated with 100 µM BAPTA-AM or DMSO vehicle control in response to stimulation with 1 µM ionomycin. b Representative pseudocolor images of CEPIAer ratio in response to stimulation with 1 µM ionomycin. The first two images show the distribution of CEPIAer in Em450 and Em510 channels. Scale bar, 3 µm. Images are from one representative experiment out of three. c Time course of CEPIAer ratio change (left panel) and the corresponding change of Ca2+ in ER ([Ca2+]er) (right panel) in response to stimulation with 1 µM ionomycin. The solid lines represent the mean; shaded areas, s.e.m. in (a) and (c). n = 12 cells from 3 experiments. Source data are provided as a Source Data file.
Fig. 5
Fig. 5. CCL25 induces [Ca2+]ex drop and integrin αLβ2 activation on T cell surface.
Splenic T cells were isolated from R26-LSL-CEPIAexternal;Itgal-LSL-Clover;Itgb2-LSL-mRuby2;CD4-Cre mice and suspended in buffer containing 1.2 mM Ca2+ and 0.6 mM Mg2+. CCL25 (final concentration 0.5 μg/ml) were added at time point 0. a Representative pseudocolor images of CEPIAexternal ratio on the T cell surface in response to CCL25 treatment. The first two images show the distribution of CEPIAexternal in Em450 and Em510 channels. Scale bar, 3 µm. Images are from one representative experiment out of three. b Time course of CEPIAexternal ratio change on the T cell surface in response to CCL25 stimulation. Untreated T cells were used as control (None) (n = 30 cells from 3 experiments). c [Ca2+]ex curve was plotted by converting the CEPIAexternal ratio in (b) to Ca2+ concentration according to the calibration curve in Fig. 2f (left), and [Ca2+]ex values at the representative time points were shown (right) (n = 65 cells from 3 experiments). d Representative pseudocolor images of the αLβ2 tail FRET ratio on the T cell surface in response to CCL25 stimulation. The first two images show the Clover and mRuby2 signals. Scale bar, 3 µm. Images are from one representative experiment out of three. e Time course of αLβ2 tail FRET ratio change in T cells pretreated with 100 µM BAPTA-AM or vehicle control in response to CCL25 stimulation and the normalized FRET ratios at the representative time points were shown. The FRET ratio is normalized to the mean value of cells before the addition of stimuli (R/R0) (n = 60 cells from 3 experiments). f Time course of CEPIAexternal ratio change in T cells pretreated with 100 µM SKF96365 or vehicle control in response to stimulation with 0.5 μg/ml CCL25 (n = 60 cells from 3 experiments). g Time course of αLβ2 tail FRET ratio change in T cells pretreated with 100 µM SKF96365 or vehicle control in response to CCL25 stimulation and the normalized FRET ratios at the representative time points were shown. The FRET ratio is normalized to the mean value of cells before the addition of stimuli (R/R0) (n = 60 cells from 3 experiments). h Adhesion of T cells pretreated with 100 µM BAPTA-AM, 100 µM SKF96365, or vehicle control to the immobilized ICAM-1 (20 μg/ml) alone or ICAM-1 (20 μg/ml) plus CCL25 (2 μg/ml) substrates at a wall shear stress of 1 dyn/cm2 (n = 3). The solid lines represent the mean; shaded areas, s.e.m. in (b, c, e, f, and g). Data represent the mean ± s.e.m. in (c, e, g, and h). ns, not significant (unpaired two-tailed Student’s t test and unpaired two-tailed Welch’s unequal variance t test in (e) and (g); one-way ANOVA with Dunnett’s test in (h). Source data are provided as a Source Data file.
Fig. 6
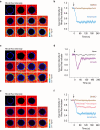
Fig. 6. Ionomycin and CCL25 induce [Ca2+]ex drop on T cell surface using Rhod Red indicator.
Splenic T cells isolated from WT mice were suspended in a buffer containing 1.2 mM Ca2+ and 0.6 mM Mg2+, and 1× Rhod Red stock solution. Ionomycin (final concentration 1 μM) or CCL25 (final concentration 0.5 μg/ml) were added at time point 0. T cells were pretreated with 1000 units/ml PNGase F in (e)and (f). a Representative pseudocolour images of Rhod Red ratio in the solution in response to stimulation with 1 µM ionomycin. The plasma membrane was indicated by FM 4-64FX. Scale bar, 3 µm. Images are from one representative experiment out of three. b Time course of Rhod Red intensity in T cell surface region in response to stimulation with 1 µM ionomycin. c Representative pseudocolor images of Rhod Red ratio in the solution in response to stimulation with 0.5 μg/ml CCL25. The plasma membrane was indicated by FM 4-64FX. Scale bar, 3 µm. Images are from one representative experiment out of three. d Time course of Rhod Red intensity in T cell surface region in response to stimulation with 0.5 μg/ml CCL25. e Representative pseudocolor images of Rhod Red ratio in the solution in response to stimulation with 1 µM ionomycin. The plasma membrane was indicated by FM 4-64FX. Scale bar, 3 µm. Images are from one representative experiment out of three. f Time course of Rhod Red intensity in PNGase F-treated T cell surface region in response to stimulation with 1 µM ionomycin. The solid lines represent the mean; shaded areas, s.e.m. in (b, d, and f). n = 12 cells from 3 experiments. Source data are provided as a Source Data file.
Fig. 7
Fig. 7. [Ca2+]ex drop-induced integrin αLβ2 activation is independent of integrin inside-out activation signaling.
Splenic T cells were isolated from R26-LSL-CEPIAexternal;Itgal-LSL-Clover;Itgb2-LSL-mRuby2;CD4-Cre mice and suspended in buffer containing 1.2 mM Ca2+ and 0.6 mM Mg2+. 1 μM ionomycin or 0.5 μg/ml CCL25 was added at time point 0. a Effect of talin knockdown (Talin KD) on αLβ2 tail FRET ratio change in T cells in response to ionomycin stimulation (left) and the normalized FRET ratios at the representative time points were shown (right) (n = 60 cells from 3 experiments). b Effect of talin knockdown (Talin KD) on αLβ2 tail FRET ratio change in T cells in response to CCL25 stimulation (left) and the normalized FRET ratios at the representative time points were shown (right) (n = 60 cells from 3 experiments). The FRET ratio is normalized to the mean value of cells before the addition of stimuli (R/R0). The solid lines represent the mean; shaded areas, s.e.m. Data represent the mean ± s.e.m. ns, not significant (unpaired two-tailed Student’s t test and unpaired two-tailed Welch’s unequal variance t test in the right panels). Source data are provided as a Source Data file.
Fig. 8
Fig. 8. [Ca2+]ex dynamics and integrin αLβ2 activation on the surface of homing T cells in mice.
Splenic T cells from R26-LSL-CEPIAexternal;Itgal-LSL-Clover;Itgb2-LSL-mRuby2;CD4-Cre mice were labeled with Cell-tracer 647 or Cell-tracer 405 for cell tracking in CEPIAexternal imaging and integrin tail FRET imaging respectively, and then injected via tail vein into recipient mice. a Two-photon intravital micrographs of T cells in the psoriasis skin vascular network. Mice were injected with dextran Texas Red and CD31-Alexa Fluor 594 to identify vessels (red). Images are representative of three independent intravital movies. b Intravital micrographs of representative rolling T cells labeled with Cell-tracer 647 (red) in vessels of recipient mice. Square highlights rolling cell. Images are from Supplementary Movie 1. Time is shown in min:s. c Time series showing the dynamic changes of CEPIAexternal ratio and αLβ2 tail FRET in representative T cells during rolling to arrest transition. Pseudocolor signals were shown as an iso-surface (lower left) pattern based on the original fluorescence (upper right) of T cells. Images are from Supplementary Movie 2. Scale bars, 6 µm. d, e Quantification of CEPIAexternal ratio shown in (d) and αLβ2 tail FRET ratio dynamic changes of the cells shown in (e). The αLβ2 tail FRET ratio is normalized to the mean value of cells in a rolling state (R/R0). Solid lines represent the mean; shaded areas, s.e.m. (n = 12). f Correlation among [Ca2+]ex, αLβ2 activation amplitude and rolling velocity of T cells during rolling to arrest transition. Integrin activation amplitude was defined as the extent of a decrease in the normalized FRET ratio compared with the value of rolling T cells. Solid lines represent the mean; shaded areas, s.e.m. (n = 12). Source data are provided as a Source Data file.
Fig. 9
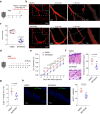
Fig. 9. SKF96365 blocks [Ca2+]ex drop and alleviates IMQ-induced psoriasis.
ac 10-week-old mice were treated with 62.5 mg cream containing 5% IMQ onto abdominal skin daily for 2 days (n = 6 mice). DMSO and 100 µM SKF96365-pretreated T cells were transferred into mice via tail vein injection. The transferred T cells were labeled with Cell Tracer 647. a Schematic diagram of IMQ-induced psoriasis mouse model. b Representative intravital micrographs of the transferred T cells arrested in skin postcapillary venules at psoriasiform lesions. Vessels were visualized by dextran Texas Red and CD31-Alexa Fluor 594 (red). Images are from Supplementary Movie 3. Time is shown in min:s. c Quantification of the arrested T cells in skin postcapillary venules. Data are presented as box-and-whisker plots showing the median (central line), 25th–75th percentile (bounds of the box), and 5th–95th percentile (whiskers). Each dot represents an individual movie. dh 10-week-old R26-LSL-CEPIAexternal;Itgal-LSL-Clover;Itgb2-LSL-mRuby2;CD4-Cre mice were treated with 18 mg cream containing 5% IMQ onto each ear and injected with 10 mg/kg SKF96365 or DMSO daily for 7 days (n = 6 mice). d Schematic diagram of IMQ-induced psoriasis and SKF96365 treatment. e Changes in ear thickness relative to day 0 of IMQ application. f Representative H&E staining of ear sections of DMSO or SKF96365 treated mice on day 7 after IMQ treatment (left). Scale bar: 50 μm. Quantification of epidermal thickness (right). An average of at least 3 measurements per sample was calculated. g Quantification of αLβ2+ T cells in the ear on day 7 after IMQ treatment. h Representative immunofluorescent images of ear skin of mice treated with DMSO or SKF96365 (left). Scale bar: 100 μm. Right: Quantification of αLβ2+ T cells in each field (right). An average of at least 3 measurements per sample was calculated. Data represent the mean ± SD. ns, not significant (unpaired two-tailed Student’s t test). Source data are provided as a Source Data file.

Similar articles

References

    1. Reglero-Real, N., Rolas, L. & Nourshargh, S. Leukocyte trafficking: time to take time seriously. Immunity50, 273–275 (2019). 10.1016/j.immuni.2019.01.013 - DOI - PubMed
    1. Kameritsch, P. & Renkawitz, J. Principles of leukocyte migration strategies. Trends Cell Biol.30, 818–832 (2020). 10.1016/j.tcb.2020.06.007 - DOI - PubMed
    1. Lin, C. D. et al. Fever promotes T lymphocyte trafficking via a thermal sensory pathway involving heat shock protein 90 and alpha 4 integrins. Immunity50, 137–13 (2019). 10.1016/j.immuni.2018.11.013 - DOI - PMC - PubMed
    1. Weninger, W., Biro, M. & Jain, R. Leukocyte migration in the interstitial space of non-lymphoid organs. Nat. Rev. Immunol.14, 232–246 (2014). 10.1038/nri3641 - DOI - PubMed
    1. Dustin, M. L. Integrins and their role in immune cell adhesion. Cell177, 499–501 (2019). 10.1016/j.cell.2019.03.038 - DOI - PubMed

LinkOut - more resources