. 2024 Jul 19;16(1):160.
doi: 10.1186/s13195-024-01527-3.

Alpha-lipoic acid alleviates cognitive deficits in transgenic APP23/PS45 mice through a mitophagy-mediated increase in ADAM10 α-secretase cleavage of APP

Affiliations

Alpha-lipoic acid alleviates cognitive deficits in transgenic APP23/PS45 mice through a mitophagy-mediated increase in ADAM10 α-secretase cleavage of APP

Jie Zhang et al. Alzheimers Res Ther. .

Abstract

Background: Alpha-lipoic acid (ALA) has a neuroprotective effect on neurodegenerative diseases. In the clinic, ALA can improve cognitive impairments in patients with Alzheimer's disease (AD) and other dementias. Animal studies have confirmed the anti-amyloidosis effect of ALA, but its underlying mechanism remains unclear. In particular, the role of ALA in amyloid-β precursor protein (APP) metabolism has not been fully elucidated.

Objective: To investigate whether ALA can reduce the amyloidogenic effect of APP in a transgenic mouse model of AD, and to study the mechanism underlying this effect.

Methods: ALA was infused into 2-month-old APP23/PS45 transgenic mice for 4 consecutive months and their cognitive function and AD-like pathology were then evaluated. An ALA drug concentration gradient was applied to 20E2 cells in vitro to evaluate its effect on the expression of APP proteolytic enzymes and metabolites. The mechanism by which ALA affects APP processing was studied using GI254023X, an inhibitor of A Disintegrin and Metalloproteinase 10 (ADAM10), as well as the mitochondrial toxic drug carbonyl cyanide m-chlorophenylhydrazone (CCCP).

Results: Administration of ALA ameliorated amyloid plaque neuropathology in the brain tissue of APP23/PS45 mice and reduced learning and memory impairment. ALA also increased the expression of ADAM10 in 20E2 cells and the non-amyloidogenic processing of APP to produce the 83 amino acid C-terminal fragment (C83). In addition to activating autophagy, ALA also significantly promoted mitophagy. BNIP3L-knockdown reduced the mat/pro ratio of ADAM10. By using CCCP, ALA was found to regulate BNIP3L-mediated mitophagy, thereby promoting the α-cleavage of APP.

Conclusions: The enhanced α-secretase cleavage of APP by ADAM10 is the primary mechanism through which ALA ameliorates the cognitive deficits in APP23/PS45 transgenic mice. BNIP3L-mediated mitophagy contributes to the anti-amyloid properties of ALA by facilitating the maturation of ADAM10. This study provides novel experimental evidence for the treatment of AD with ALA.

Keywords: AD; ADAM10; ALA; Cognitive deficits; Mitophagy.


Conflict of interest statement

The authors declare no competing interests.

Figures
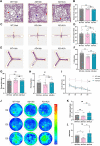
Fig. 1
Fig. 1
Behavioural experiments showed that cognitive deficits in APP23/PS45 transgenic mice were alleviated by ALA. (A) Representative movement trajectories of mice in open field test. (B) Percentages of entries into the central area by WT + Veh, AD + Veh and AD + ALA mice. (C) Representative movement trajectories of mice in elevated plus maze. (D) Percentages of entries into open arms from three groups. (E) Representative movement trajectories of mouse in Y maze. (F) Scores for SAP. (G, H) Escape latency and path length to a visual platform in the visible platform period. (I) AD + ALA group mice showed shorter latency to escape onto the hidden platform during day 2 to 5 compared with the AD + Veh group (AD + Veh vs. WT + Veh, ###P < 0.001; AD + ALA vs. AD + Veh, ***P < 0.001). (J) Motion track heat maps from three groups tested on day 2, 5 and 6. (K, L) During the no platform period, the entries into SW3 quadrant for AD + ALA mice were significantly more than the AD + Veh mice. n = 10. *P < 0.05, **P < 0.01, ***P < 0.001
Fig. 2
Fig. 2
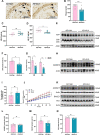
The amyloid pathologies of brain tissue in APP23/PS45 transgenic mice were ameliorated by ALA. (A) Representative images of senile plaques detected by 4G8 immunostaining from AD + Veh and AD + ALA mice. Black arrows indicate plaques. (B) Mean numbers of senile plaques, n = 10. ***P < 0.001. (C, D) ELISA was performed to measure the levels of Aβ40 and Aβ42 in the brain tissue of AD + Veh and AD + ALA mice. n = 8, *P < 0.05. (E-G) Immunoblot bands and protein levels of APP, C99 and C89. n = 6. **P < 0.01, ***P < 0.001. (H, I) Western blots analysis of ADAM10. (J) The α-cleavage activity of ADAM10 was increased in AD + ALA compared with AD + Veh mice. n = 3. *P < 0.05. (K-N) Immunoblot bands and protein levels of ADAM17, BACE1 and PS1. n = 6
Fig. 3
Fig. 3
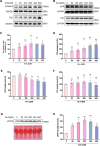
The α-secretase cleavage of APP in 20E2 cells was increased by ALA. 20E2 cells was treated with ALA (0, 50, 100, 200, 400 or 600 µM) for 24 h, and then total cell lysates and culture media were subjected to immunoblotting. (A-F) Western blots and corresponding quantification were performed for ADAM10, C83, APP and PS1 in 20E2 cell lysates. (G-H) The sAPPα from media was detected with 6E10 primary antibody, and total protein was stained with Ponceau S as an internal reference. Relative levels of sAPPα in media. n = 3–7. *P < 0.05, **P < 0.01, ***P < 0.001
Fig. 4
Fig. 4
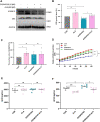
The crucial role of ADAM10 in promoting α-secretase cleavage of APP following ALA treatment of 20E2 cells. 20E2 cells were treated with ALA (400 µM) or GI254023 × (10 µM) for 24 h. (A-C) Representative Western blot bands and protein levels of C83 and ADAM10. n = 4. *P < 0.05, **P < 0.01. (D) Evaluation of ADAM10 protease activity in 20E2 cell lysates, ***P < 0.001. (E, F) The levels of Aβ40 and Aβ42 in the culture media of 20E2 cells were measured by ELISA. n = 5. *P < 0.05, ***P < 0.001
Fig. 5
Fig. 5
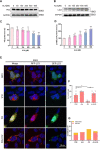
Autophagy was activated in 20E2 cells after ALA treatment. (A-D) 20E2 cells were treated with ALA (0, 50, 100, 200, 400 or 600 µM) for 24 h. Representative Western blot bands are shown for P62 and LC3. Protein levels for P62 and bar plot summary of LC3-B/LC3-A. n = 4. **P < 0.01, ***P < 0.001. (E) 20E2 cells were transfected with mRFP-eGFP-LC3 plasmid for 24 h, then treated with ALA (400 µM) or CQ (25 µM) for 24 h. Representative images of CON, ALA, CQ and ALA + CQ groups cells were showed. (F) The proportion of red LC3 dots to total LC3 dots (sum of red and yellow LC3 dots) among four groups. (G) The number of yellow and red LC3 dots per cell was quantified. At least 30 cells were counted in each group. *P < 0.05, **P < 0.01, ***P < 0.001
Fig. 6
Fig. 6
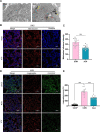
The mitophagy in 20E2 cells was improved by ALA treatment. (A) TEM images of 20E2 cells in CON and ALA (400 µM) groups. Autophagosomes (red arrows) and autolysosomes (yellow arrows) were observed in the ALA group. In the ALA-treated 20E2 cell, two mitochondria are seen wrapped within the bilayer limiting membrane of an autophagosome. These structures were early AVi (black dashed circle). AVd contained partially degraded mitochondria and endosomal/lysosomal particles. The yellow arrows indicate mitochondrial vesicles in which partially degraded mitochondria (red dashed circles) were also observed. mi, mitochondrion. (B, C) Mitochondrial mass was detected using the Mito-Tracker fluorescent probe. (D, E) MMP was performed with the JC-1 dual fluorescence probe. ***P < 0.001
Fig. 7
Fig. 7
BNIP3L-mediated mitophagy is involved in the regulation of ADAM10. (A-C) Three different siRNAs were used to knockdown BNIP3L in 20E2 cells. Representative Western blot bands and protein levels for BNIP3L and ADAM10 were shown. (D-I) Representative Western blot bands and protein levels for BNIP3L, ADAM10 and C83 in 20E2 cells treated with ALA (400 µM) or CCCP (10 µM). n = 3–5. *P < 0.05, **P < 0.01, ***P < 0.001

Similar articles

References

    1. McKhann G, Drachman D, Folstein M, Katzman R, Price D, Stadlan EM. Clinical diagnosis of Alzheimer’s disease: report of the NINCDS-ADRDA Work Group under the auspices of Department of Health and Human Services Task Force on Alzheimer’s Disease. Neurology. 1984;34(7):939–44. 10.1212/wnl.34.7.939. 10.1212/wnl.34.7.939 - DOI - PubMed
    1. Hardy JA, Higgins GA. Alzheimer’s disease: the amyloid cascade hypothesis. Science. 1992;256(5054):184–5. 10.1126/science.1566067. 10.1126/science.1566067 - DOI - PubMed
    1. Glenner GG, Wong CW. Alzheimer’s disease: initial report of the purification and characterization of a novel cerebrovascular amyloid protein. Biochem Biophys Res Commun. 1984;120(3):885–90. 10.1016/s0006-291x(84)80190-4. 10.1016/s0006-291x(84)80190-4 - DOI - PubMed
    1. Selkoe DJ. Alzheimer’s disease: genes, proteins, and therapy. Physiol Rev. 2001;81(2):741–66. 10.1152/physrev.2001.81.2.741. 10.1152/physrev.2001.81.2.741 - DOI - PubMed
    1. Ito K, Tatebe T, Suzuki K, Hirayama T, Hayakawa M, Kubo H, et al. Memantine reduces the production of amyloid-β peptides through modulation of amyloid precursor protein trafficking. Eur J Pharmacol. 2017;798:16–25. 10.1016/j.ejphar.2017.02.001. 10.1016/j.ejphar.2017.02.001 - DOI - PubMed

MeSH terms

LinkOut - more resources