. 2024 Sep;41(9):2419-2439.
doi: 10.1007/s10815-024-03189-4. Epub 2024 Jul 18.

The DNA double-strand break repair proteins γH2AX, RAD51, BRCA1, RPA70, KU80, and XRCC4 exhibit follicle-specific expression differences in the postnatal mouse ovaries from early to older ages

Affiliations

The DNA double-strand break repair proteins γH2AX, RAD51, BRCA1, RPA70, KU80, and XRCC4 exhibit follicle-specific expression differences in the postnatal mouse ovaries from early to older ages

Gunel Talibova et al. J Assist Reprod Genet. 2024 Sep.

Abstract

Purpose: Ovarian aging is closely related to a decrease in follicular reserve and oocyte quality. The precise molecular mechanisms underlying these reductions have yet to be fully elucidated. Herein, we examine spatiotemporal distribution of key proteins responsible for DNA double-strand break (DSB) repair in ovaries from early to older ages. Functional studies have shown that the γH2AX, RAD51, BRCA1, and RPA70 proteins play indispensable roles in HR-based repair pathway, while the KU80 and XRCC4 proteins are essential for successfully operating cNHEJ pathway.

Methods: Female Balb/C mice were divided into five groups as follows: Prepuberty (3 weeks old; n = 6), puberty (7 weeks old; n = 7), postpuberty (18 weeks old; n = 7), early aged (52 weeks old; n = 7), and late aged (60 weeks old; n = 7). The expression of DSB repair proteins, cellular senescence (β-GAL) and apoptosis (cCASP3) markers was evaluated in the ovaries using immunohistochemistry.

Result: β-GAL and cCASP3 levels progressively increased from prepuberty to aged groups (P < 0.05). Notably, γH2AX levels varied in preantral and antral follicles among the groups (P < 0.05). In aged groups, RAD51, BRCA1, KU80, and XRCC4 levels increased (P < 0.05), while RPA70 levels decreased (P < 0.05) compared to the other groups.

Conclusions: The observed alterations were primarily attributed to altered expression in oocytes and granulosa cells of the follicles and other ovarian cells. As a result, the findings indicate that these DSB repair proteins may play a role in the repair processes and even other related cellular events in ovarian cells from early to older ages.

Keywords: DNA double-strand break; Female infertility; Follicles; HR repair; Oocytes; Ovarian aging; cNHEJ.


Conflict of interest statement

The authors declare that there is no conflict of interest.

Figures
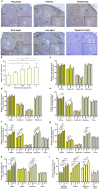
Fig. 1
Fig. 1
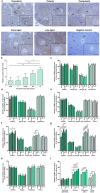
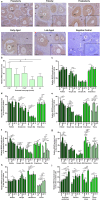
Cellular distribution and relative levels of β-GAL protein in the postnatal mouse ovaries. a Representative microscopic micrographs of β-GAL immunostaining of prepuberty (PreP, n = 6), puberty (P, n = 7), postpuberty (PostP, n = 7), early aged (EA, n = 7), and late aged (LA, n = 7) groups. Expression of β-GAL protein was observed in oocytes and granulosa cells of the follicles from primordial to antral stages, as well as in the other ovarian cells, including germinal epithelium, stromal cells, granulosa lutein and theca lutein cells. The asterisks indicate small spaces between granulosa cells, the red arrows show germinal epithelium. The micrographs and their inserts were captured at 200 × and 400 × original magnifications, respectively. Scale bars represent 50 µm. O, Oocyte; TL, Theca layer; S, Stroma; SF, Secondary follicle; PAF, Preantral follicle; AF Antral follicle; CL, Corpus luteum. b Relative β-GAL protein levels in the total area of the prepuberty, puberty, postpuberty, early aged, and late aged groups. It increased progressively from prepuberty to late aged groups (P < 0.05). c-h Relative β-GAL protein levels in c primordial, d primary, e secondary, f preantral, g antral, and h atretic follicles, and in their oocyte’s cytoplasm (C) and nucleus (N), granulosa cells, and theca cells. Although no significant change was noted in primordial and primary follicles, we observed an increasing expression in the follicles, their oocyte’s cytoplasm, and granulosa cells from prepuberty to late aged groups (P < 0.05). i Relative β-GAL protein levels in the ovarian cells located in germinal epithelium, stroma, and corpus luteum. Likewise, there was a gradual increase from the prepuberty to the late aged groups (P < 0.05). Data were analyzed using one-way ANOVA and Tukey’s post hoc test and are presented as the mean ± standard deviation (SD). Asterisks above the columns indicate significant differences as follows: *P < 0.05, **P < 0.01, and ***P < 0.001
Fig. 2
Fig. 2
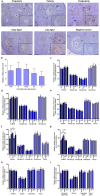
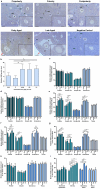
Cellular distribution and relative level of cCASP3 protein in the postnatal mouse ovaries. a Representative microscopic micrographs of cCASP3 immunostaining of the prepuberty (PreP, n = 6), puberty (P, n = 7), postpuberty (PostP, n = 7), early aged (EA, n = 7), and late aged (LA, n = 7) groups. cCASP3 protein was intensively expressed in granulosa cells of the growing follicles and stromal cells. The asterisks indicate small spaces between granulosa cells, the red arrows show germinal epithelium. The micrographs and their inserts were captured at 200 × and 400 × original magnifications, respectively. Scale bars represent 50 µm. O, Oocyte; TL, Theca layer; S, Stroma; SF, Secondary follicle; PAF, Preantral follicle; AF Antral follicle; AtF, Atretic follicle; CL, Corpus luteum. b Relative cCASP3 protein levels in the total area of the prepuberty, puberty, postpuberty, early aged, and late aged groups. It increased progressively from the prepuberty to the late aged groups (P < 0.05). c-h Relative cCASP3 protein levels in c primordial, d primary, e secondary, f preantral, g antral, and h atretic follicles, and in their oocyte’s cytoplasm (C) and nucleus (N), granulosa cells, and theca cells. Although no significant difference was observed in the primordial, primary, secondary, and atretic follicles, the cCASP3 expression reached the highest levels in the preantral and antral follicles and their granulosa cells in the late aged group compared to the early groups (P < 0.05). i Relative cCASP3 protein levels in the ovarian cells located in germinal epithelium, stroma, and corpus luteum. There was a gradual increase in the expression of stromal cells, granulosa lutein and theca lutein cells from the prepuberty to the late aged groups (P < 0.05). Data were analyzed using one-way ANOVA and Tukey’s post hoc test and are presented as the mean ± standard deviation (SD). Asterisks above the columns indicate significant differences as follows: *P < 0.05, **P < 0.01, and ***P < 0.001
Fig. 3
Fig. 3
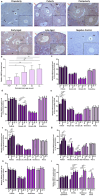
Cellular distribution and relative levels of γH2AX protein in the postnatal mouse ovaries. a Representative microscopic micrographs of γH2AX immunostaining of the prepuberty (PreP, n = 6), puberty (P, n = 7), postpuberty (PostP, n = 7), early aged (EA, n = 7), and late aged (LA, n = 7) groups. γH2AX protein was intensively expressed in granulosa cells of the follicles from primordial to antral stages. The asterisks indicate small spaces between granulosa cells, the red arrows show germinal epithelium. The micrographs and their inserts were captured at 200 × and 400 × original magnifications, respectively. Scale bars represent 50 µm. O, Oocyte; TL, Theca layer; S, Stroma; SF, Secondary follicle; PAF, Preantral follicle; AF, Antral follicle; AtF, Atretic follicle; CL, Corpus luteum. b Relative γH2AX protein levels in the total area of the prepuberty, puberty, postpuberty, early aged, and late aged groups. We observed no significant differences among the groups. c-h Relative γH2AX protein levels in c primordial, d primary, e secondary, f preantral, g antral, and h atretic follicles, and in their oocyte’s cytoplasm (C) and nucleus (N), granulosa cells and theca cells. Although no significant change was noted in primordial, primary, secondary, and atretic follicles, the γH2AX expression exhibited changes in preantral and antral follicles among the groups (P < 0.05). i Relative γH2AX protein levels in ovarian cells located in the germinal epithelium, stroma, and corpus luteum. We found no changes in these cells. Data were analyzed using one-way ANOVA and Tukey’s post hoc test and are presented as the mean ± standard deviation (SD). Asterisks above the columns indicate significant differences as follows: *P < 0.05, **P < 0.01, and ***P < 0.001
Fig. 4
Fig. 4
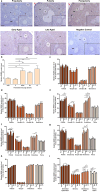
Cellular distributions and relative levels of RAD51 protein in the postnatal mouse ovaries. a Representative microscopic micrographs of RAD51 immunostaining of prepuberty (PreP, n = 6), puberty (P, n = 7), postpuberty (PostP, n = 7), early aged (EA, n = 7), and late aged (LA, n = 7) groups. The RAD51 protein was intensively expressed in granulosa cells of the follicles from primordial to antral stages, and in stromal cells. The asterisks indicate small spaces between granulosa cells, the red arrows show the germinal epithelium. The micrographs and their inserts were captured at 200 × and 400 × original magnifications, respectively. The scale bars represent 50 µm. O, Oocyte; TL, Theca layer; S, Stroma; SF, Secondary follicle; PAF, Preantral follicle; AF, Antral follicle; CL, Corpus luteum. b Relative RAD51 protein levels in the total area of the prepuberty, puberty, postpuberty, early aged, and late aged groups. It was at high levels in the postpuberty, early aged, and late aged groups (P < 0.05). c-h Relative RAD51 protein levels in c primordial, d primary, e secondary, f preantral, g antral, and h atretic follicles, and in cytoplasm (C) and nucleus (N) of oocytes, granulosa cells, and theca cells. Although no significant change was observed in primordial, primary, and atretic follicles, RAD51 expression in secondary, preantral, and antral follicles exhibited variations between the groups (P < 0.05). i Relative RAD51 protein levels in ovarian cells located in the germinal epithelium, stroma, and corpus luteum. Although there was a gradual increase in granulosa lutein cells from the prepuberty to the late aged groups (P < 0.05), we observed expressional changes in the remained cells (P < 0.05). Data were analyzed using one-way ANOVA and Tukey’s post hoc test and are presented as the mean ± standard deviation (SD). Asterisks above the columns indicate significant differences as follows: *P < 0.05, **P < 0.01, and ***P < 0.001
Fig. 5
Fig. 5
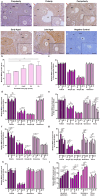
Cellular distribution and relative levels of BRCA1 protein in the postnatal mouse ovaries. a Representative microscopic micrographs of BRCA1 immunostaining of prepuberty (PreP, n = 6), puberty (P, n = 7), postpuberty (PostP, n = 7), early aged (EA, n = 7), and late aged (LA, n = 7) groups. BRCA1 protein was intensely expressed in granulosa cells of the growing follicles, stromal cells, and granulosa lutein cells. The asterisks indicate small spaces between granulosa cells, the red arrows show germinal epithelium. The micrographs and their inserts were captured at 200 × and 400 × original magnifications, respectively. The scale bars represent 50 µm. O, Oocyte; TL, Theca layer; S, Stroma; PrF, Primary follicle; SF, Secondary follicle; PAF, Preantral follicle; AF, Antral follicle; AtF, Atretic follicle; CL, Corpus luteum. b Relative BRCA1 protein levels in the total area of the prepuberty, puberty, postpuberty, early aged, and late aged groups. It gradually increased from the prepuberty to the early/late aged groups (P < 0.05). c-h Relative BRCA1 protein levels in c primordial, d primary, e secondary, f preantral, g antral, and h atretic follicles, and in their oocyte’s cytoplasm(C) and nucleus (N), granulosa cells and theca cells. Although no significant change was noted in primordial and atretic follicles, BRCA1 expression decreased in primary, secondary, preantral, and antral follicles from the prepuberty to the early/late aged groups (P < 0.05). i Relative BRCA1 protein levels in ovarian cells located in the germinal epithelium, stroma, and corpus luteum. We observed that there was a gradual increase in germinal epithelium from the prepuberty to the late aged groups (P < 0.05), and the stromal cells, granulosa lutein and theca lutein cells had highest levels in the late aged group (P < 0.05). Data were analyzed using one-way ANOVA and Tukey’s post hoc test and are presented as the mean ± standard deviation (SD). Asterisks above the columns indicate significant differences as follows: *P < 0.05, **P < 0.01, and ***P < 0.001
Fig. 6
Fig. 6
Cellular distribution and relative levels of RPA70 protein in the postnatal mouse ovaries. a Representative microscopic micrographs of RPA70 immunostaining of prepuberty (PreP, n = 6), puberty (P, n = 7), postpuberty (PostP, n = 7), early aged (EA, n = 7), and late aged (LA, n = 7) groups. RPA70 protein was intensely expressed in granulosa cells and nucleus of oocytes of the follicles at different developmental stages as well as in most stromal cells. The asterisks indicate small spaces between granulosa cells, the red arrows show the germinal epithelium. The micrographs and their inserts were captured at 200 × and 400 × original magnifications, respectively. The scale bars represent 50 µm. O, Oocyte; TL, Theca layer; S, Stroma; PrF, Primary follicle; SF, Secondary follicle; PAF, Preantral follicle; AF, Antral follicle; AtF, Atretic follicle; CL, Corpus luteum. b Relative RPA70 protein levels in the total area of the prepuberty, puberty, postpuberty, early aged, and late aged groups. It decreased in the early/late aged groups compared to the early groups (P < 0.05). c-h Relative RPA70 protein levels in c primordial, d primary, e secondary, f preantral, g antral, and h atretic follicles, and in oocyte’ cytoplasm (C) and nucleus (N), granulosa cells, and theca cells. We observed significant changes in RPA70 expression of these follicles and their components (P < 0.05). i Relative RPA70 protein levels in ovarian cells located in the germinal epithelium, stroma, and corpus luteum. The RPA70 expression significantly increased in germinal epithelium, granulosa lutein and theca lutein cells in the early/late aged group when compared to the other groups (P < 0.05). Data were analyzed using one-way ANOVA and Tukey’s post hoc test and are presented as the mean ± standard deviation (SD). Asterisks above the columns indicate significant differences as follows: *P < 0.05, **P < 0.01, and ***P < 0.001
Fig. 7
Fig. 7
Cellular distribution and relative levels of KU80 protein in the postnatal mouse ovaries. a Representative microscopic micrographs of KU80 immunostaining of prepuberty (PreP, n = 6), puberty (P, n = 7), postpuberty (PostP, n = 7), early aged (EA, n = 7), and late aged (LA, n = 7) groups. The KU80 protein was expressed in granulosa cells of the follicles at the different developmental stages as well as in granulosa lutein and theca lutein cells. The asterisks indicate small spaces between granulosa cells, the red arrows show germinal epithelium. The micrographs and their inserts were captured at 200 × and 400 × original magnifications, respectively. The scale bars represent 50 µm. O, Oocyte; TL, Theca layer; S, Stroma; PrF, Primary follicle; SF, Secondary follicle; PAF, Preantral follicle; AtF, Atretic follicle; CL, Corpus luteum. b Relative KU80 protein levels in the total area reached high levels in the postpuberty, early aged, and late aged groups (P < 0.05). c-h The relative KU80 protein levels in c primordial, d primary, e secondary, f preantral, g antral, and h atretic follicles, and in oocyte’s cytoplasm (C) and nucleus (N), granulosa cells and theca cells. We observed an increasing trend of KU80 expression in secondary, preantral and antral follicles and their components in the early or late aged group (P < 0.05). i The relative KU80 protein levels in ovarian cells located in germinal epithelium, stroma, and corpus luteum. The KU80 expression in stromal cells and granulosa lutein cells significantly increased in the early or late aged group compared to the other groups (P < 0.05). Data were analyzed by one-way ANOVA and Tukey’s post hoc test and are presented as the mean ± standard deviation (SD). Asterisks above the columns indicate significant differences as follows: *P < 0.05, **P < 0.01, and ***P < 0.001
Fig. 8
Fig. 8
Cellular distribution and relative levels of XRCC4 protein in the postnatal mouse ovaries. a Representative microscopic micrographs of XRCC4 immunostaining of prepuberty (PreP, n = 6), puberty (P, n = 7), postpuberty (PostP, n = 7), early aged (EA, n = 7), and late aged (LA, n = 7) groups. XRCC4 protein was intensely expressed in oocytes and granulosa cells of the follicles at different developmental stages as well as in granulosa lutein and theca lutein cells. The asterisks indicate small spaces between granulosa cells, the red arrows show germinal epithelium. The micrographs and their inserts were captured at 200 × and 400 × original magnifications, respectively. Scale bars represent 50 µm. O, Oocyte; TL, Theca layer; S, Stroma; SF, Secondary follicle; PAF, Preantral follicle; AF, Antral follicle; AtF, Atretic follicle; CL, Corpus luteum. b The relative XRCC4 protein levels in the total area. It gradually increased from the prepuberty to the late aged groups (P < 0.05). c-h The relative XRCC4 protein levels in c primordial, d primary, e secondary, f preantral, g antral, and h atretic follicles, and in oocyte’s cytoplasm (C) and nucleus (N), granulosa cells, and theca cells. Although we found no changes in primordial and atretic follicles, there was an increasing trend of XRCC4 expression in primary, secondary, preantral, and antral follicles toward to the early or late aged group when compared to the early groups (P < 0.05). i The relative XRCC4 protein levels in ovarian cells located in the germinal epithelium, stroma, and corpus luteum. It increased in stromal cells, granulosa lutein and theca lutein cells from the prepuberty to the late aged groups (P < 0.01). Data were analyzed using one-way ANOVA and Tukey’s post hoc test and are presented as the mean ± standard deviation (SD). Asterisks above the columns indicate significant differences as follows: *P < 0.05, **P < 0.01, and ***P < 0.001

References

    1. Park CJ, et al. Lifetime changes of the oocyte pool: Contributing factors with a focus on ovulatory inflammation. Clin Exp Reprod Med. 2022;49(1):16–25. 10.5653/cerm.2021.04917 - DOI - PMC - PubMed
    1. Hansen KR, et al. A new model of reproductive aging: the decline in ovarian non-growing follicle number from birth to menopause. Hum Reprod. 2008;23(3):699–708. 10.1093/humrep/dem408 - DOI - PubMed
    1. Younis JS. Ovarian aging: latest thoughts on assessment and management. Curr Opin Obstet Gynecol. 2011;23(6):427–34. 10.1097/GCO.0b013e32834b92b0 - DOI - PubMed
    1. Wasielak-Politowska M, Kordowitzki P. Chromosome segregation in the oocyte: what goes wrong during aging. Int J Mol Sci. 2022;23(5):2880. 10.3390/ijms23052880 - DOI - PMC - PubMed
    1. Leem J, Lee C, Choi DY, Oh JS. Distinct characteristics of the DNA damage response in mammalian oocytes. Exp Mol Med. 2024;56(2):319–28. 10.1038/s12276-024-01178-2 - DOI - PMC - PubMed

MeSH terms

LinkOut - more resources