. 2024 Jun 21;10(12):e33371.
doi: 10.1016/j.heliyon.2024.e33371. eCollection 2024 Jun 30.

Queen bee acid pretreatment attenuates myocardial ischemia/reperfusion injury by enhancing autophagic flux

Affiliations

Queen bee acid pretreatment attenuates myocardial ischemia/reperfusion injury by enhancing autophagic flux

Changhai Chen et al. Heliyon. .

Abstract

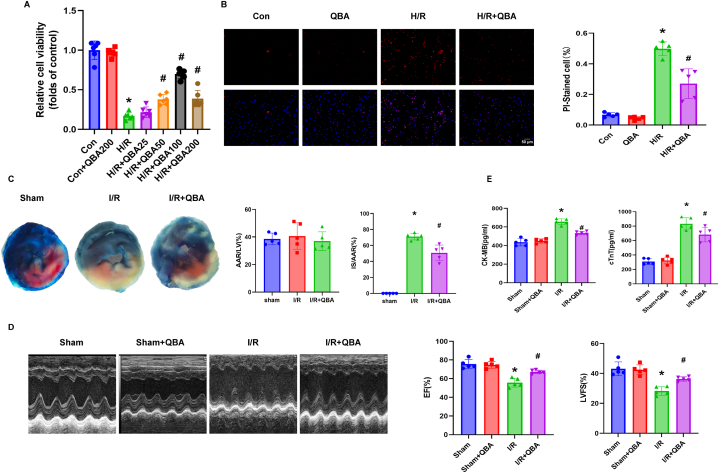
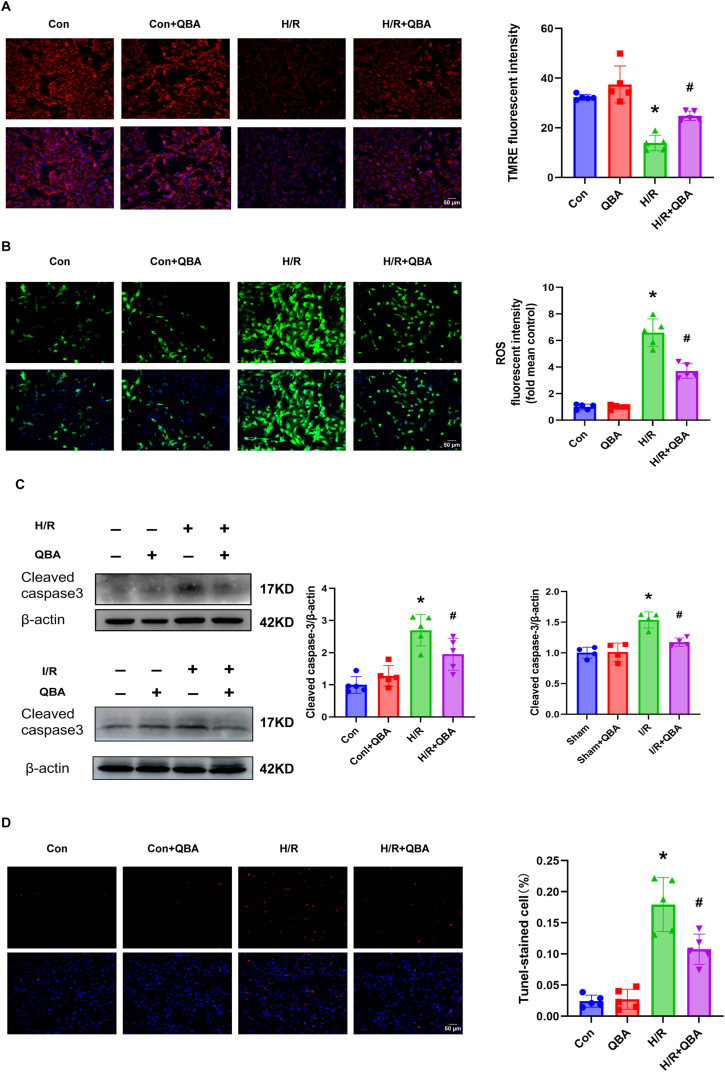
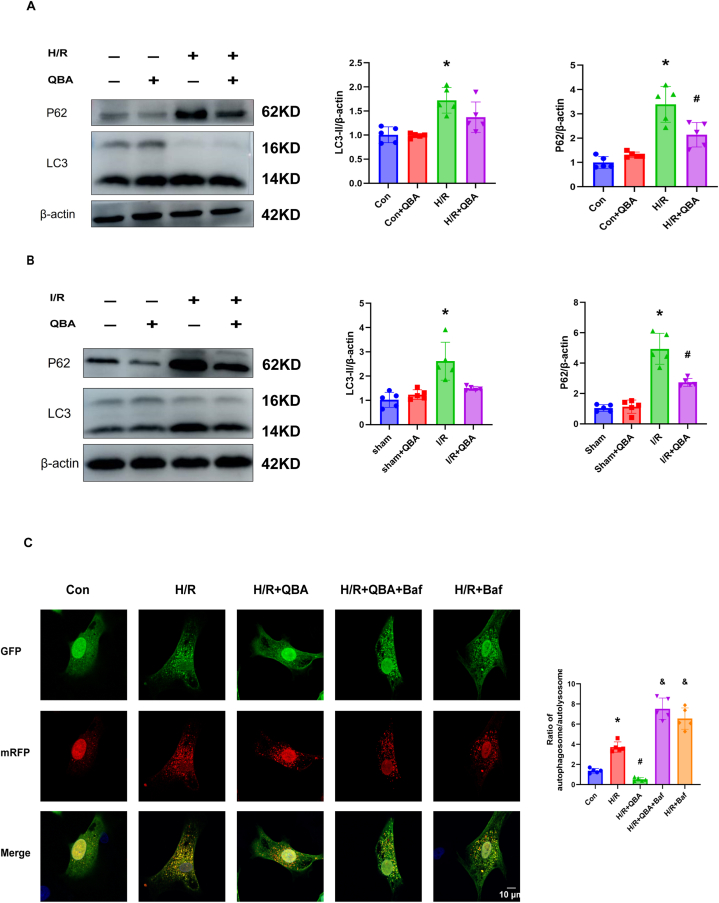
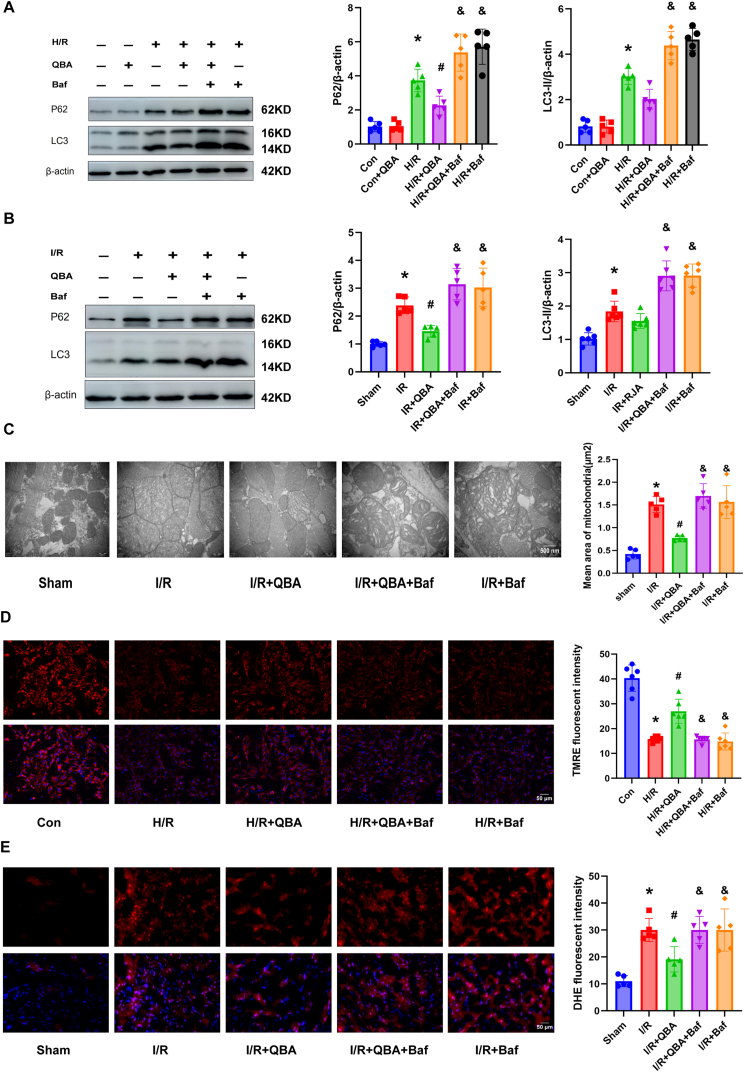
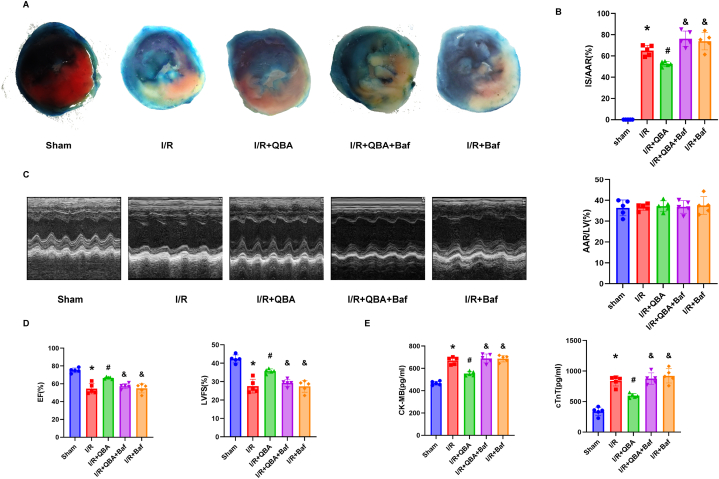
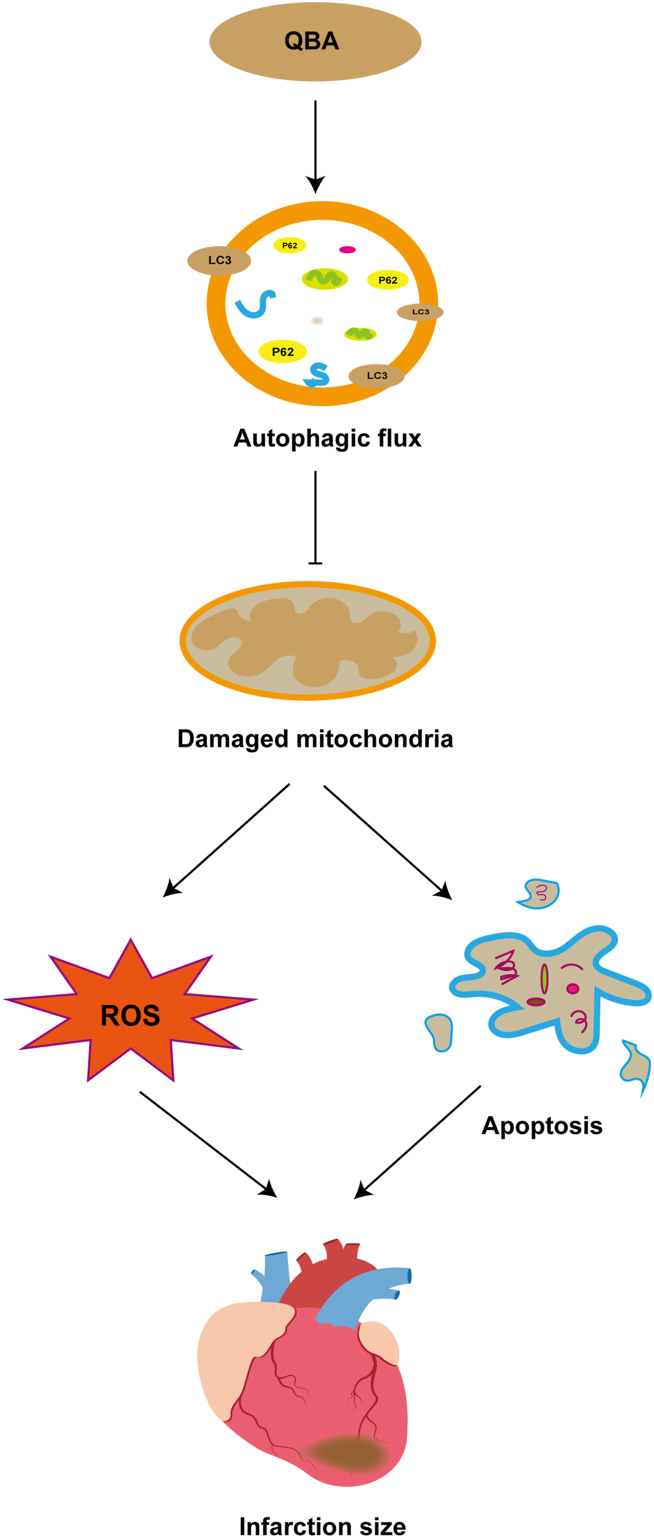
Queen bee acid (QBA), which is exclusively found in royal jelly, has anti-inflammatory, antihypercholesterolemic, and antiangiogenic effects. A recent study demonstrated that QBA enhances autophagic flux in the heart. Considering the significant role of autophagy in the development of myocardial ischemia/reperfusion (I/R) injury, we investigated the effect of pretreatment with QBA on myocardial damage. In an in vivo model, left coronary artery blockage for 30 min and reperfusion for 2 h were used to induce myocardial I/R. In an in vitro model, neonatal rat cardiomyocytes (NRCs) were exposed to 3 h of hypoxia and 3 h of reoxygenation (H/R). Our results showed that pretreatment with QBA increased the cell viability of cardiomyocytes exposed to H/R in a dose-dependent manner, and the best protective concentration of QBA was 100 μM. Next, we noted that QBA pretreatment (24h before H/R) enhanced autophagic flux and attenuated mitochondrial damage, cardiac oxidative stress and apoptosis in NRCs exposed to H/R injury, and these effects were weakened by cotreatment with the autophagy inhibitor bafilomycin A1 (Baf). In addition, similar results were observed when QBA (10 mg/kg) was injected intraperitoneally into I/R mice 30 min before ischemia. Compared to mice subjected to I/R alone, those treated with QBA had decreased myocardial infarct area and increased cardiac function, whereas, these effects were partly reversed by Baf. Notably, in NRCs exposed to H/R, tandem fluorescent mRFP-GFP-LC3 assays indicated increased autophagosome degradation due to the increase in autophagic flux upon QBA treatment, but coinjection of Baf blocked autophagic flux. In this investigation, no notable adverse effects of QBA were detected in either cellular or animal models. Our findings suggest that QBA pretreatment mitigates myocardial I/R injury by eliminating dysfunctional mitochondria and reducing reactive oxygen species via promoting autophagic flux.

Keywords: Apoptosis; Autophagic flux; Myocardial ischemia/reperfusion; Queen bee acid.


Conflict of interest statement

The authors declare that they have no known competing financial interests or personal relationships that could have appeared to influence the work reported in this paper.

Figures

Fig. 1
Fig. 1
QBA alleviates myocardial injury in mice. (A) Effects of different doses of QBA (25, 50, 100 and 200 μM) on cell viability in cultured NRCs, as determined by the MTS assay. (B) Necrotic cells were visualized using PI staining (red nuclei) and quantitatively analyzed. (C) Illustrative photographs of heart sections stained with TTC-Evans blue were obtained for each experimental group. Brick red staining indicated viable myocardial tissue, while the unstained white areas corresponded to infarcted myocardium. The ratios of the area at risk (AAR) to the left ventricle (LV) and infarct size (IS) to the AAR are presented for analysis. (D) M-mode echocardiography was utilized to assess the left ventricular ejection fraction (EF) and fractional shortening (FS) across the various experimental groups, with illustrative echocardiograms presented for reference. (E) Following treatment, ELISA was utilized to measure the plasma levels of CK-MB and cTnT in the various groups. *P < 0.05, significantly different from the control or sham group; #P < 0.05, significantly different from the H/R or I/R group.
Fig. 2
Fig. 2
QBA attenuates cardiac oxidative stress, mitochondrial damage, and apoptosis. (A) The mitochondrial membrane potential was assessed using TMRE staining and visualized under a microscope, where the presence of red fluorescence indicates intact mitochondrial membrane potential. (B) Cellular reactive oxygen species (ROS) generation was visualized by staining with DCFH-DA and overlaid with the total nuclei stained with Hoechst 33342. Representative images and quantification of DCFH-DA are presented. (C) Western blot analysis was conducted to assess the levels of cleaved caspase-3 in neonatal rat cardiomyocytes (NRCs) exposed to hypoxia/reoxygenation (H/R) and in murine hearts subjected to ischemia/reperfusion (I/R) injury. The cleaved caspase-3/β-actin ratio was quantified to determine the relative expression levels of cleaved caspase-3 in the samples. (D) Representative photomicrographs and quantification of TUNEL staining (red nuclei) in NRCs. *P < 0.05, significantly different from the control or sham group; #P < 0.05, significantly different from the H/R or I/R group.
Fig. 3
Fig. 3
QBA restores autophagic flux in cardiomyocytes in vivo and in vitro. Western blots of LC3 and p62 in NRCs subjected to H/R (A) and murine hearts subjected to I/R (B) and quantification of LC3 II/β-actin and p62/β-actin are shown. (C) NRCs were transfected with adenovirus containing tandem fluorescent mRFP-GFP-LC3 and incubated for 24 h. Various treatments were applied to assess autophagic flux in the cells. Images of immunofluorescent NRCs expressing mRFP-GFP-LC3 are displayed, with DAPI staining indicating nuclei in blue, GFP dots in green, and mRFP dots in red. The ratio of autophagosomes to autolysosomes was determined and quantitatively evaluated. *P < 0.05, significantly different from the control or sham group; #P < 0.05, significantly different from the H/R or I/R group; & P < 0.05, significantly different from the H/R + QBA group.
Fig. 4
Fig. 4
QBA-induced autophagic flux attenuates mitochondrial damage and reduces cellular ROS levels. (A) Representative Western blotting images and quantitative analysis of LC3 and p62 in NRCs subjected to H/R and subjected to different treatments. (B) Representative Western blotting images and quantitative analysis of LC3 and p62 in murine hearts subjected to I/R and subjected to different treatments. (C) The ultrastructure of the myocardium is shown by TEM. Representative images of cardiomyocyte mitochondria and myofibrils in different groups. Scale bar = 500 nm. (D) Mitochondrial membrane potential was estimated with TMRE staining and captured by a microscope. Scale bar = 50 μm. (E) Representative images of DHE-stained mouse heart tissue from each group. *P < 0.05, significantly different from the control or sham group; #P < 0.05, significantly different from the H/R or I/R group; & P < 0.05, significantly different from the H/R or I/R + QBA group.
Fig. 5
Fig. 5
QBA-enhanced autophagic flux attenuates myocardial apoptosis in vivo and in vitro. (A) Representative images and TUNEL staining images of neonatal rat cardiomyocytes (NRCs) subjected to various treatments are presented. TUNEL-positive cells were identified by the presence of red dots. (B) Apoptotic cardiomyocytes were detected using TUNEL staining. Red dots indicate TUNEL‐positive cardiomyocytes. (C) Representative Western blotting images and quantitative analysis of cleaved caspase‐3 in NRCs under H/R. (D) Representative Western blotting images and quantitative analysis of cleaved caspase‐3 in murine hearts subjected to I/R. *P < 0.05, significantly different from the control or sham group; #P < 0.05, significantly different from the H/R or I/R group; & P < 0.05, significantly different from the H/R or I/R + QBA group.
Fig. 6
Fig. 6
QBA-enhanced autophagic flux reduces myocardial IS and improves cardiac function. (A, B) Representative images of heart sections stained with TTC-Evans blue were obtained for each experimental group. Brick red staining indicated viable myocardial tissue, while the unstained white areas corresponded to infarcted myocardium. The AAR/LV and IS/AAR ratios are shown. (C, D) Representative echocardiograms from mice in different groups. LVEF and LVFS were measured and calculated. (E) After treatment, the plasma concentrations of CK-MB (G) and cTnT (H) in the different groups were measured by ELISA. *P < 0.05, significantly different from the control or sham group; #P < 0.05, significantly different from the H/R or I/R group; & P < 0.05, significantly different from the H/R or I/R + QBA group.
Fig. 7
Fig. 7
Illustration of the effects and mechanisms of QBA on myocardial I/R injury.

Similar articles

References

    1. Aengevaeren V.L., et al. Exercise and coronary atherosclerosis. Circulation. 2020;141(16):1338–1350. - PMC - PubMed
    1. Davidson S.M., et al. Multitarget Strategies to reduce myocardial ischemia/reperfusion injury. J. Am. Coll. Cardiol. 2019;73(1):89–99. - PubMed
    1. Bhatt D.L., Lopes R.D., Harrington R.A. Diagnosis and treatment of acute coronary syndromes: a review. JAMA. 2022;327(7):662–675. - PubMed
    1. Algoet M., et al. Myocardial ischemia-reperfusion injury and the influence of inflammation. Trends Cardiovasc. Med. 2023;33(6):357–366. - PubMed
    1. Heusch G. Myocardial ischaemia–reperfusion injury and cardioprotection in perspective. Nat. Rev. Cardiol. 2020;17(12):773–789. - PubMed

LinkOut - more resources