Potential value and research frontiers of virus in neuroinflammation: a bibliometric and visualized analysis
- PMID: 39021576
- PMCID: PMC11251911
- DOI: 10.3389/fimmu.2024.1390149
Potential value and research frontiers of virus in neuroinflammation: a bibliometric and visualized analysis
Abstract
Background: Neuroinflammation represents the immune response of the central nervous system to nerve injury, infection, toxin stimulation, or autoimmunity and is implicated in a wide range of neurological disorders. Viruses play a pivotal role as extrinsic biological drivers in neuroinflammation; however, numerous aspects remain unexplored. In this study, we employed bibliometric analysis to assess the current status of viral research in neuroinflammation and anticipate future research directions and emerging trends.
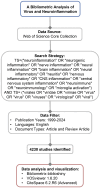
Methods: Conduct a comprehensive search for scholarly publications within the Web of Science Core Collection database, with search terms on neuroinflammation and virus. Apply Microsoft Excel Office, Hiplot, R (version 4.3.1), VOSviewer (version 1.6.20) and CiteSpace (6.2.R6, advanced) software for the bibliometric analysis and visualization.
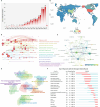
Results: A total of 4230 articles and reviews on virus and neuroinflammation were identified, demonstrating a consistent upward trend over time. The United States was the country that contributed the most publications. Approximately 22274 authors from 4474 institutions contributed to the research. Johns Hopkins University leads with the highest number of publications and citations. The top three authors with the most published articles on this field are Power, C., Lane, T. E., and Buch, S. The Journal of Neuroinflammation is the most authoritative choice for researchers. The main research focuses in this field include multiple sclerosis, Parkinson's disease, blood-brain barrier, COVID-19, Alzheimer's disease, gene therapy. In recent years, stress have emerged as hot keywords, particularly depression, human immunodeficiency virus-associated neurocognitive disorders, blood-brain barrier, gut microbiota related directions, indicating a potential shift in research focus.
Conclusion: Research on the virus and neuroinflammation has attracted increasing attention in the past decade. European and American countries have been pivotal in conducting research on virus and neuroinflammation, while China has produced a significant number of publications, its impact is still limited. Stress is likely to emerge as the next area of focus in this field. The association and regulation between viral infection and psychiatric disorders are not fully understood, and further research is needed to explore the role of neuroinflammation caused by different types of viral infection and psychiatric disorders.
Keywords: CiteSpace; VOSviewer; bibliometric analysis; hotspots; neuroinflammation; psychiatric disorders; virus.
Copyright © 2024 Li and Wu.
Conflict of interest statement
The authors declare that the research was conducted in the absence of any commercial or financial relationships that could be construed as a potential conflict of interest.
Figures


Similar articles
-
Global research trends on innate lymphoid cells in the brain, gut and lung field: a bibliometric and visualized analysis.Front Immunol. 2024 Feb 7;15:1336666. doi: 10.3389/fimmu.2024.1336666. eCollection 2024. Front Immunol. 2024. PMID: 38384457 Free PMC article.
-
Global Publication Trends and Research Hotspots of the Immune System and Osteoporosis: A Bibliometric and Visualization Analysis from 2012 to 2022.Endocr Metab Immune Disord Drug Targets. 2024;24(4):455-467. doi: 10.2174/0118715303257269231011073100. Endocr Metab Immune Disord Drug Targets. 2024. PMID: 37881072
-
Evolution and global research trends of immunity in diabetic nephropathy: a bibliometric and visual analysis from 2004 to 2023.Int Urol Nephrol. 2024 Oct;56(10):3307-3321. doi: 10.1007/s11255-024-04081-x. Epub 2024 May 17. Int Urol Nephrol. 2024. PMID: 38758346 Free PMC article.
-
Mapping Research Trends and Hotspots in the Link between Alzheimer's Disease and Gut Microbes over the Past Decade: A Bibliometric Analysis.Nutrients. 2023 Jul 19;15(14):3203. doi: 10.3390/nu15143203. Nutrients. 2023. PMID: 37513621 Free PMC article. Review.
-
A bibliometric and visual analysis of cancer-associated fibroblasts.Front Immunol. 2023 Dec 19;14:1323115. doi: 10.3389/fimmu.2023.1323115. eCollection 2023. Front Immunol. 2023. PMID: 38173726 Free PMC article. Review.
References
MeSH terms
Grants and funding
LinkOut - more resources
Full Text Sources
Miscellaneous

