. 2024 Jul 16;14(1):16386.
doi: 10.1038/s41598-024-66916-y.

Identification of organs of origin of macrophages that produce presepsin via neutrophil extracellular trap phagocytosis

Affiliations

Identification of organs of origin of macrophages that produce presepsin via neutrophil extracellular trap phagocytosis

Akihiro Kondo et al. Sci Rep. .

Abstract

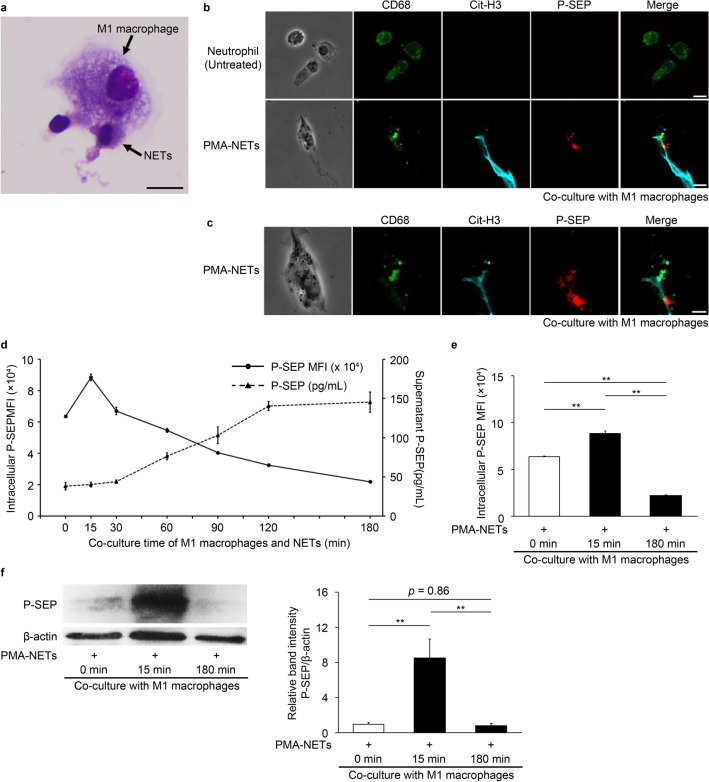
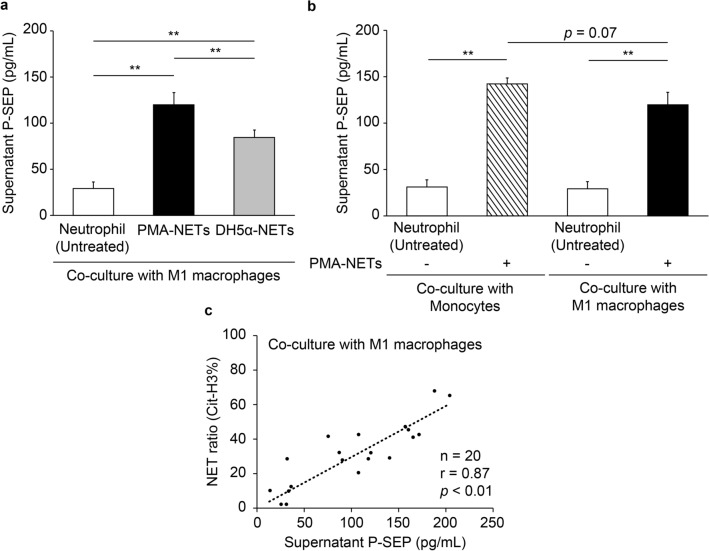
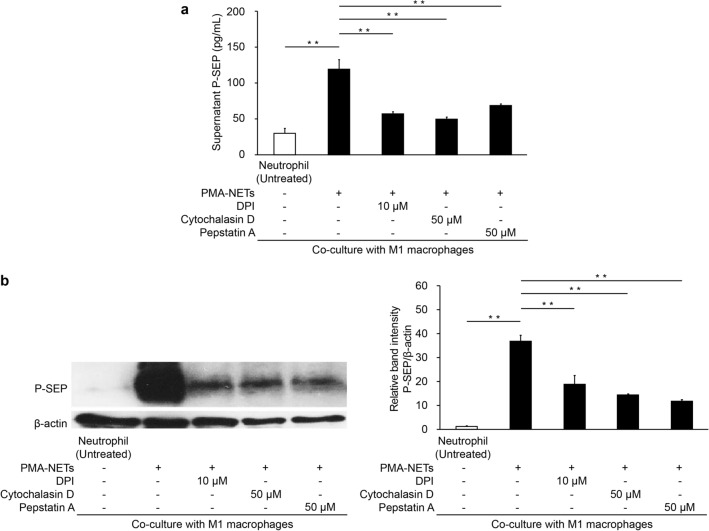
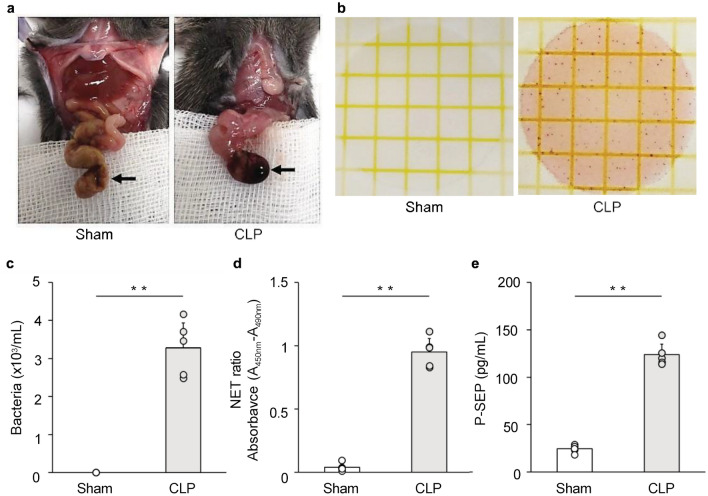
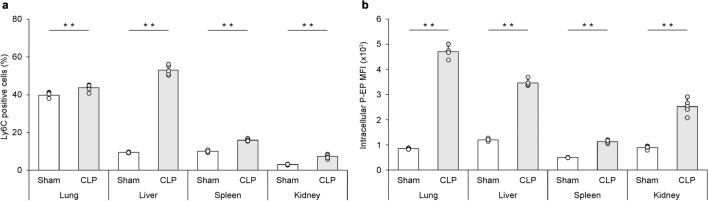
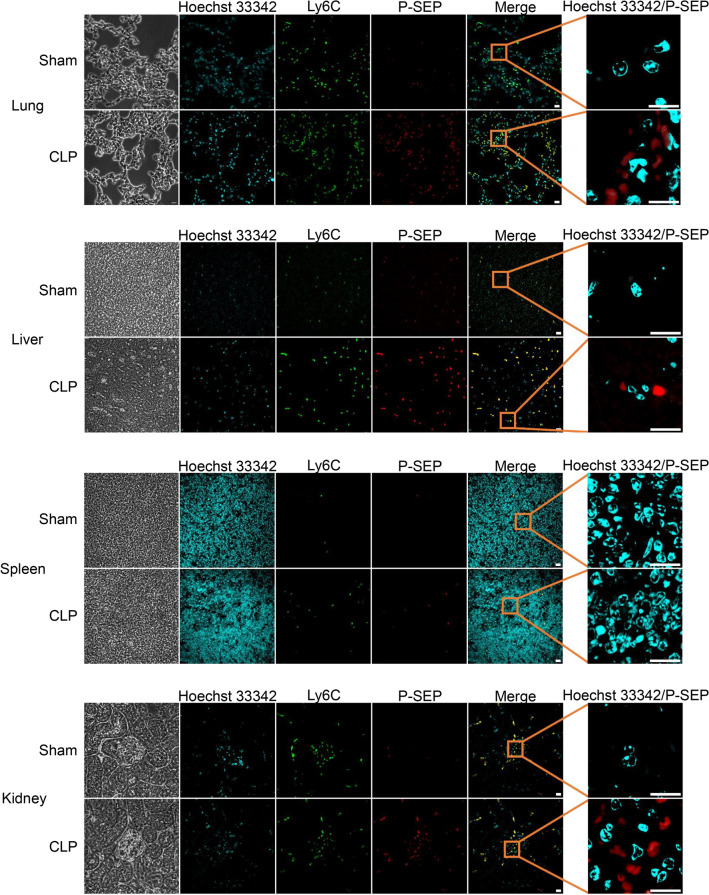
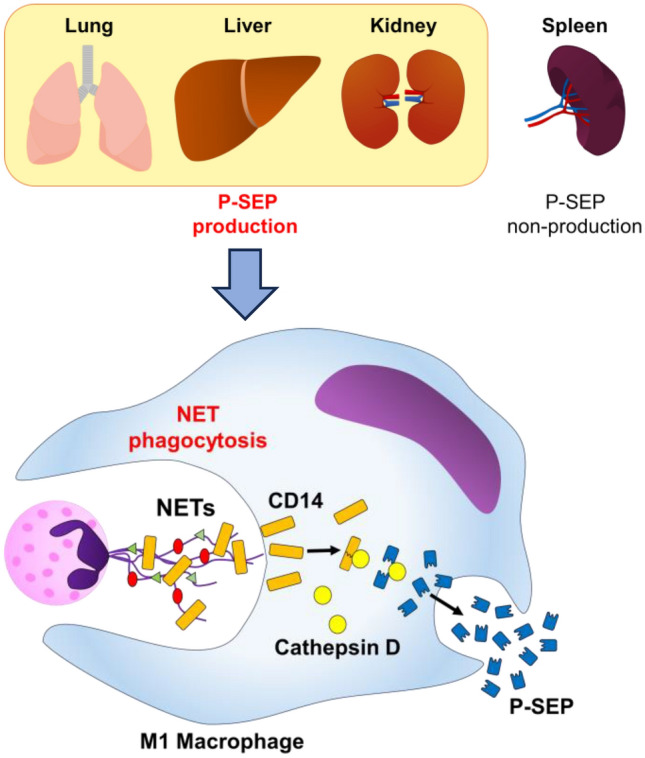
Presepsin (P-SEP) is a specific biomarker for sepsis. Monocytes produce P-SEP by phagocytosing neutrophil extracellular traps (NETs). Herein, we investigated whether M1 macrophages (M1 MΦs) are the primary producers of P-SEP after NET phagocytosis. We co-cultured M1 MΦs and NETs from healthy participants, measured P-SEP levels in the culture medium supernatant, and detected P-SEP using western blotting. When NETs were co-cultured with M1 MΦs, the P-SEP level of the culture supernatant was high. Notably, we demonstrated, for the first time, the intracellular kinetics of P-SEP production by M1 MΦs via NET phagocytosis: M1 MΦs produced P-SEP intracellularly 15 min after NET phagocytosis and then released it extracellularly. In a sepsis mouse model, the blood NET ratio and P-SEP levels, detected using ELISA, were significantly increased (p < 0.0001). Intracellular P-SEP analysis via flow cytometry demonstrated that lung, liver, and kidney MΦs produced large amounts of P-SEP. Therefore, we identified these organs as the origin of M1 MΦs that produce P-SEP during sepsis. Our data indicate that the P-SEP level reflects the trend of NETs, suggesting that monitoring P-SEP can be used to both assess NET-induced organ damage in the lungs, liver, and kidneys during sepsis and determine treatment efficacy.

Keywords: Biomarker; Macrophage; Neutrophil extracellular traps; Presepsin; Sepsis.


Conflict of interest statement

The authors declare no competing interests.

Figures

Figure 1
Figure 1
After M1 MΦs phagocytose NETs, P-SEP produced within M1 MΦs is released into extracellular space over time. (a) Cell morphology image of M1 MΦ phagocytosing PMA-NETs. (MG stain, magnification 1,000 ×). Scale bar: 10 µm. (b) Immunofluorescence staining results of M1 MΦ phagocytosing PMA-NETs. NETs indicated by arrows are citrullinated histone H3-positive. Scale bar: 10 µm. (c) Enlarged view of M1 MΦ phagocytosing PMA-NETs. Arrows indicate images of P-SEP production by M1 MΦs phagocytosing NETs. Scale bar: 5 µm. (d, e) After co-culturing M1 MΦs and NETs, cells were collected over time and analyzed for intracellular P-SEP expression using flow cytometry. P-SEP levels in culture medium supernatant were measured. (f) Western blotting of intracellular P-SEP expression intensity and P-SEP at 0, 15, and 180 min after NET phagocytosis by M1 MΦs. P-SEP protein levels were quantified using Image J. β-actin band intensity was used to correct P-SEP band intensity. The unprocessed western blot image is shown in Supplementary Fig. S11. All differences denoted by asterisks were subjected to two-tailed Student’s t-tests. Values are presented as mean ± standard deviation (SD; n = 3). **p < 0.01. P-SEP, presepsin; NET, neutrophil extracellular trap; M1 MΦs, M1 macrophage.
Figure 2
Figure 2
M1 MΦs phagocytose NETs and produce P-SEP. (a) P-SEP production after co-culture of M1 MΦs with PMA-NETs and DH5α-NETs was compared. (b) P-SEP production after co-culture of M1 MΦs or monocytes with PMA-NETs was compared. (c) Correlation between P-SEP production and NET ratio after M1 MΦ phagocytosed NETs. All differences denoted by asterisks were subjected to two-tailed Student’s t-tests. Values are presented as mean ± SD (n = 3). **p < 0.01. P-SEP, presepsin; NET, neutrophil extracellular trap; M1 MΦs, M1 macrophage.
Figure 3
Figure 3
Evaluation of P-SEP levels in inhibiting NET formation, M1 MΦ phagocytosis, and protease inhibition. (a) Evaluation of culture medium supernatant P-SEP levels after adding various inhibitors. (b) Western blotting of P-SEP protein levels in M1 MΦs after adding various inhibitors. P-SEP protein levels were quantified using Image J. β-actin band intensity was used to correct P-SEP band intensity. The unprocessed western blot image is shown in Supplementary Fig. S12. All differences denoted by asterisks were subjected to two-tailed Student’s t-tests. Values are presented as mean ± SD (n = 3). **p < 0.01. P-SEP, presepsin; NET, neutrophil extracellular trap; M1 MΦs, M1 macrophage.
Figure 4
Figure 4
Evaluated blood NET ratio and blood P-SEP production in CLP-treated sepsis model mice. (a) Gross cecum findings for the sham group and CLP-treated sepsis model mice. As indicated by arrows, the ceca of CLP-treated mice were necrotic. (b, c) Comparison of viable bacteria calculated from colony counts. Each dot represents one mouse. (d, e) Blood NET ratio and P-SEP levels were evaluated in CLP-treated sepsis model mice. Each dot represents one mouse. All differences denoted by asterisks were subjected to two-tailed Student’s t-tests. Values are presented as mean ± SD (n = 5). **p < 0.01. P-SEP, presepsin; NET, neutrophil extracellular trap; M1 MΦs, M1 macrophage.
Figure 5
Figure 5
Identification of organs with MΦs producing P-SEP in a mouse model of sepsis. (a) Ly6c-positive cells were compared with positivity rate of Ly6C-positive M1 MΦs in each organ as M1 MΦs. M1 MΦs were the most abundant in the lungs of mice in the sham group, with a small number of M1 MΦs in the liver, spleen, and kidneys. Compared to the sham group, mice in the CLP group showed significantly increased Ly6C positivity in each organ, especially markedly in the lungs and liver. Each dot represents one mouse. (b) Comparing P-SEP expression in M1 MΦs in each organ between sham and CLP groups, intracellular P-SEP expression in each organ was lower in sham group mice, while P-SEP expression in M1 MΦs in lungs, liver, and spleen was significantly increased in CLP group mice. Each dot represents one mouse. All differences denoted by asterisks were subjected to two-tailed Student’s t-tests. Values are presented as mean ± SD (n = 5). **p < 0.01. P-SEP, presepsin; M1 MΦs, M1 macrophage.
Figure 6
Figure 6
Images of P-SEP production in MΦ of lungs, liver, and kidneys. Immunofluorescence staining for P-SEP in MΦs in each organ showed that only a few MΦs in the sham group were positive for P-SEP, but P-SEP was markedly positive in MΦs from the lungs, liver, and kidney in the CLP group. Scale bar: 10 µm. P-SEP, presepsin; M1 MΦs, M1 macrophage; CLP, cecal ligation and puncture.
Figure 7
Figure 7
Schematic diagram of the mechanism by which tissue MΦ produces P-SEP to phagocytose NETs. When bacteria infect blood vessels, neutrophils release NETs for biological defense. When MΦs in the lungs, liver, and spleen phagocytose increase NETs in the body, P-SEP is produced, and blood P-SEP levels are high. P-SEP, presepsin; NET, neutrophil extracellular trap; M1 MΦs, M1 macrophage.

Similar articles

Cited by

References

    1. Evans L, et al. Surviving sepsis campaign: International guidelines for management of sepsis and septic shock 2021. Intensive Care Med. 2021;47:1181–1247. doi: 10.1007/s00134-021-06506-y. - DOI - PMC - PubMed
    1. Rudd KE, et al. Global, regional, and national sepsis incidence and mortality, 1990–2017: Analysis for the global burden of disease study. Lancet. 2020;395:200–211. doi: 10.1016/S0140-6736(19)32989-7. - DOI - PMC - PubMed
    1. Husabø G, et al. Early diagnosis of sepsis in emergency departments, time to treatment, and association with mortality: An observational study. PLoS One. 2020;15:e0227652. doi: 10.1371/journal.pone.0227652. - DOI - PMC - PubMed
    1. Hilarius KWE, Skippen PW, Kissoon N. Early recognition and emergency treatment of sepsis and septic shock in children. Pediatr. Emerg. Care. 2020;36:101–106. doi: 10.1097/PEC.0000000000002043. - DOI - PubMed
    1. Yaegashi Y, et al. Evaluation of a newly identified soluble CD14 subtype as a marker for sepsis. J. Infect. Chemother. 2005;11:234–238. doi: 10.1007/s10156-005-0400-4. - DOI - PubMed

Substances

LinkOut - more resources