[Preprint]. 2024 Jul 1:2024.06.27.600964.
doi: 10.1101/2024.06.27.600964.

PRDM16-DT: A Brain and Astrocyte-Specific lncRNA Implicated in Alzheimer's Disease

Affiliations

PRDM16-DT: A Brain and Astrocyte-Specific lncRNA Implicated in Alzheimer's Disease

Sophie Schröder et al. bioRxiv. .

Abstract

Astrocytes provide crucial support for neurons, contributing to synaptogenesis, synaptic maintenance, and neurotransmitter recycling. Under pathological conditions, deregulation of astrocytes contributes to neurodegenerative diseases such as Alzheimer's disease (AD), highlighting the growing interest in targeting astrocyte function to address early phases of AD pathogenesis. While most research in this field has focused on protein-coding genes, non-coding RNAs, particularly long non-coding RNAs (lncRNAs), have emerged as significant regulatory molecules. In this study, we identified the lncRNA PRDM16-DT as highly enriched in the human brain, where it is almost exclusively expressed in astrocytes. PRDM16-DT and its murine homolog, Prdm16os, are downregulated in the brains of AD patients and in AD models. In line with this, knockdown of PRDM16-DT and Prdm16os revealed its critical role in maintaining astrocyte homeostasis and supporting neuronal function by regulating genes essential for glutamate uptake, lactate release, and neuronal spine density through interactions with the RE1-Silencing Transcription factor (Rest) and Polycomb Repressive Complex 2 (PRC2). Notably, CRISPR-mediated overexpression of Prdm16os mitigated functional deficits in astrocytes induced by stimuli linked to AD pathogenesis. These findings underscore the importance of PRDM16-DT in astrocyte function and its potential as a novel therapeutic target for neurodegenerative disorders characterized by astrocyte dysfunction.


Conflict of interest statement

Conflict of interest The authors declare no conflict of interest

Figures

Figure 1:
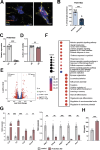
Figure 1:. PRDM16-DT/Prdm16os is an astrocyte-specific lncRNA enriched in the brain.
A. Strategy to identify astrocyte-specific lncRNAs in the brain and characterize their function. B. UMAP clustering based on snucRNAseq (iCELL8 technology) from healthy human brains (prefrontal cortex, BA9). C. Left panel: Bar graph showing the list of lncRNAs enriched in astrocytes when compared to all other cell types in the human brain. lncRNAs marked in red have a mouse homolog. Right panel: Schematic illustration showing the genomic localization of human PRMD16-DT and mouse Prdm16os. D. Left panel: Violin plot showing the expression of PRDM16-DT in different cell types of the human prefrontal cortex along with corresponding cell type marker genes. .Right panel: UMAP clustering as depicted in (B) showing the expression of PRMD16-DT. E. Left panel: Expression of PRDM16-DT in different human tissues (depicted are only tissues in which expression was detectable). One-way ANOVA revealed a significant difference among the groups (p < 0.0001). ****P < 0.0001 for central nervous system vs. any of the other tissues (unpaired t-Tests). Right panel: Violin plot showing the expression of PRDM16-DT as counts per million normalized to the samples size for the central nervous system vs. the average expression across 44 other human tissues (only tissues in which PRDM16-DT expression was detected are shown) ****P < 0.0001; unpaired t-Test. F. Bar chart showing the expression of PRDM16-DT in human iPSC-derived astrocytes, neurons and microglia (unpaired t test; ***P < 0.001, ****P < 0.0001, ns = not significant). G. Prdm16os expression in mouse primary astrocytes, neurons and microglia (unpaired t test; ***P < 0.001, ****P < 0.0001, ns = not significant). H. Prdm16os expression in astrocytes, oligodendrocytes, microglia and neuronal fraction isolated from the adult mouse brain (unpaired t test; ***P < 0.001). Right panel: Bar charts showing qPCR data from astrocytes, oligodendrocytes, microglia and neuronal fraction isolated from the adult mouse brain for marker genes for astrocytes (Aldehyde Dehydrogenase 1 Family Member L1, Aldh1l), oligodendrocytes (myelin basic protein, Mbp), microglia (Integrin Subunit Alpha M, Itgam) and neurons (RNA Binding Fox-1 Homolog 3, Rbfox3). Error bars indicate SD.
Figure 2:
Figure 2:. Prdm16-DT is decreased in the brains of AD patients and in response to AD risk factors.
A. Bar chart showing qPCR data on the expression of PRDM16-DT in postmortem brain samples (prefrontal cortex, BA9) from control (n = 12) and AD patients (n = 13) (****P < 0.0001, unpaired t-Test) B. Log2 Fold changes of PRDM16-DT expression in different brain regions in AD patients compared to controls based on data from the Agora database (https://agora.adknowledgeportal.org/).(*P < 0.05). C. Bar chart showing the expression of PRDM16-DT in postmortem tissue samples (frontal lobe) of FTD patients with MAPT (n = 10), C9ORF72 ( n = 8) or GRN (n = 6) mutations compared to non-demented controls (NDC, n = 13). D. Bar chart showing the expression of PRDM16-DT in postmortem brain tissue of controls (n = 279) compared to schizophrenia patients (n = 258) obtained from a study by Wu et al., [24]. E. Left panel: Experimental design. Right panel: Bar plot showing Prdm16os expression in mouse astrocytes after treatment with LPS-activated microglia conditioned medium (MCM-LPS) compared to control (MCM-PBS), a 3 cytokine cocktail (3 Cyt) and Aß-42 treatment compared to the corresponding vehicle controls.(****P < 0.00001, **P < 0.001 unpaired t-Test). F. Left panel: Experimental design. Right panel: Bar plot showing PRMD16-DT expression in human iPSC-derived astrocytes after treatment with a 3 cytokine cocktail (3 Cyt) and Aß-42 compared to the corresponding controls (**P < 0.01 unpaired t-Test). ACC: Anterior Cingulate Cortex, AD: Alzheimer’s Disease, CBE: Cerebellum, 3 Cyt: 3 cytokine cocktail, DLPFC: Dorsolateral Prefrontal Cortex, FTD: Frontotemporal Dementia, FP: Frontal pole; IFG: Inferior Frontal Gyrus, PCC: Posterior Cingulate Cortex, PHG: Parahippocampal Gyrus, STG: Superior Temporal Gyrus, TCX: Temporal Cortex. Error bars represent SD.
Figure 3:
Figure 3:. Prdm16os is localized to the nucleus and controls gene expression.
A. Representative images from the adult mouse hippocampus showing the RNAscope signal for Prdm16os and immunofluorescence for Gfap. Nuclei are stained with DAPI. The right panel shows a higher magnification from a different hippocampal region. B. Bar plot showing qPCR values for Prdm16os in nuclear and cytoplasmic fractions prepared from primary astrocytes (***P < 0.001, unpaired tTest). C. Bar plot showing qPCR results for Prdm16os after treating primary astrocytes with GapmeRs to knock down (KD) Prdm16os. RNA was collected 48 hours after the addition of Prdm16os GapmeRs or control oligonucleotides (****P < 0.0001, unpaired tTest) D. Bar plot showing cell viability of primary astrocytes 48h after Prdm16os knock down in comparison to the treatment with control oligomers. E. Volcano plot shows the up- and down-regulated genes in primary astrocytes 48h after Prdm16os knock down. F. Plot showing the results of a GO term analysis for the up- and downregulated genes displayed in (E) (Analysis was done using clusterProfiler (v4.6.0) [30]. Two-sided hypergeometric test was used to calculate the importance of each term and the Benjamini-Hochberg procedure was applied for the P value correction). G. Bar plots showing the results of qPCR experiments for selected genes that were found to be deregulated upon Prdm16os knock down via RNAseq. Left panel: Selected up-regulated genes. Right panel: Selected downregulated genes ****P < 0.0001, ***P < 0.001; **P < 0.01; unpaired tTest). H. Bar chart showing the effect of Prdm16 knock down on IL-6 levels in the corresponding media measured via ELISA (****P < 0.0001, unpaired tTest). KD: knockdown, NC: negative control. Error bars indicate SEM.
Figure 4:
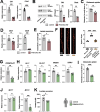
Figure 4:. The loss of Prdm16os in astrocytes affects glutamate uptake, lactate secretion and neuronal function.
A. qPCR showing the levels of the two glutamate transporters Glt-1 and Glast after the KD of Prdm16os in primary astrocytes. B. Left panel: Representative Immunoblot images of Glt-1 and Glast after the KD of Prdm16os in astrocytes. Right panel: Quantification of (B) n = 3/group. C. Glutamate uptake after the KD of Prdm16os in astrocytes. D. qPCR showing the levels of the two lactate transporters Mct1 and Mct4 after the KD of Prdm16os in astrocytes. E. Lactate secretion after the KD of Prdm16os in astrocytes. F. Left panel: Representative images of dendrite and spine labeling of neurons cultured alone (Neurons) or with either control astrocytes (Neurons + control astrocytes) or Prdm16os KD astrocytes (Neurons + Prdm16os KD astrocytes). Right panel. Quantification of spine density. G-K shows data from human iPSC-derived astrocytes upon the KD of PRDM16-DT. G. KD of PRDM16-DT in human iPSC-derived astrocytes. H. qPCR showing the levels of the two glutamate transporters GLT-1 and GLAST and two synapse plasticity genes NRXN1 and GRIN1 after the KD of PRDM16-DT. I. Glutamate uptake after the KD of PRDM16-DT. J. qPCR showing the levels of the two lactate transporters MCT1 and MCT4 after the KD of PRDM16-DT. K. Lactate secretion after the KD of PRDM16-DT.KD: knockdown, NC: negative control. Statistical significance was assessed by a one-way ANOVA with Tukey’s post hoc test for (F) or a Student’s unpaired t test for the other graphs; *P < 0.05, **P < 0.01, ***P < 0.001; ****P < 0.0001, ns = not significant.
Figure 5:
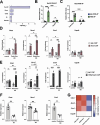
Figure 5:. Prdm16os binds to Suz12 and Rest and affects Rest and H3K27me3 levels at the promoter of genes important for neuronal function b.
A. Enrichment analysis for transcription factors based on the downregulated genes after the KD of Prdm16os. B. Prdm16os interacts with Suz12 as shown by RNA immunoprecipitation (RNA-IP). Gapdh mRNA was used as additional control. C. Prdm16os interacts with Rest as shown by RNA immunoprecipitation (RNA-IP) 18s RNA was used as additional control. D. ChIP for Rest of primary astrocytes treated with control oligomers (control) or Prdm16os GapmeRs (Prdm16os KD), followed by qPCR for promoter regions of genes important for neuronal support and synapse function (Glast, Nrxn1, Grin1), which were downregulated upon Prdm16os KD. The housekeeping gene Gapdh is used as a control. E. ChIP for H3K27me3 of primary astrocytes treated with control oligomers (control) or Prdm16os GapmeRs (Prdm16os KD) followed by qPCR for promoter regions of the genes Glast, Nrxn1 and Grin1. The housekeeping gene Gapdh is used as control. F. Bar charts showing the expression of Glast, Nrxn1 and Grin1 in astrocytes upon Prdm16os KD. G. Heat map showing the fold changes of Rest and H3K27me3 levels as well as the transcript levels of Glast, Nrxn1, Grin1 and Gapdh in astrocytes upon Prdm16os KD. Statistical significance was assessed by a one-way ANOVA with Tukey’s post hoc test; *P < 0.05, ***P < 0.001; ****P < 0.0001, ns = not significant.
Figure 6:
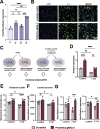
Figure 6:. CRISPRa-mediated overexpression of Prdm16os can rescue functional impairments induced by cytokine treatment.
A. Bar Chart showing the expression of Prdm16os in astrocytes transfected using CRRIPRa in combination with g1, 2 or 3 in comparison of cells treated with scrambled RNA (s). B. Representative immunofluorescence images showing the transfection of primary astrocytes with CRISPRa plasmids containing a scramble or Prdm16os-targeting g3 RNA. C. Scheme of the experimental approach. D. qPCR showing the levels of Prdm16os in astrocytes treated with either the 3 cytokine cocktail (3 Cyt) ot vehicle (control) in the presence of a either scramble RNA or g3 RNA to mediate CRISPRa of Prdm16os. Note that CRISPRa with g3 increased Prdm16os expression in the control group when compared to scramble RNA (one-way ANOVA followed by tTest; **P < 0.01) and is able to reinstate Prdm16os expression to physiological levels upon cytokine treatment (one-way ANOVA followed by tTest; ***P < 0.001). E. Bar charts showing the results from the Glutamate uptake assay of primary astrocytes after cytokine treatment and CRISPRa. F. Bar charts showing the results from the Lactate release assay of primary astrocytes after cytokine treatment and CRISPRa. Note that cytokine treatment impairs glutamate uptake and lactate release which is reinstated upon CIRPRa mediated overexpression of Prdm16os. G. Bar charts showing qPCR results for Glast (upper panel) and Mct4 (lower panel) in the 4 experimental groups. Note that CRIPRa mediated overexpression can reinstate physiological expression of Glast and Mct4 upon cytokine treatment. For A, D-G: Statistical significance was assessed by a one-way ANOVA with Tukey’s post hoc test; *P < 0.05, **P < 0.01; ****P < 0.0001

Similar articles

References

    1. Sofroniew M.V. and Vinters H.V., Astrocytes: biology and pathology. Acta Neuropathol. , 2010. 119(1): p. 7–35. - PMC - PubMed
    1. Clarke L.E. and Barres B.A., Emerging roles of astrocytes in neural circuit development. Nat Rev Neurosci. , 2013. 14(5): p. 311–321. - PMC - PubMed
    1. Liddelow S.A., et al., Neurotoxic reactive astrocytes are induced by activated microglia. Nature, 2017. 541(7638): p. 481–487. - PMC - PubMed
    1. Escartin C., et al., Reactive astrocyte nomenclature, definitions, and future directions. Nat Neurosci., 2021. 24(3): p. 312–325. - PMC - PubMed
    1. Jones V.C., et al., Aberrant iPSC-derived human astrocytes in Alzheimer’s disease. Cell death & disease, 2017. 8(3): p. e2696. - PMC - PubMed

Publication types

LinkOut - more resources