. 2024 Jul 13;12(1):50.
doi: 10.1186/s40462-024-00491-9.

Exploring motion using geometric morphometrics in microscopic aquatic invertebrates: 'modes' and movement patterns during feeding in a bdelloid rotifer model species

Affiliations

Exploring motion using geometric morphometrics in microscopic aquatic invertebrates: 'modes' and movement patterns during feeding in a bdelloid rotifer model species

Andrea Cardini et al. Mov Ecol. .

Abstract

Background: Movement is a defining aspect of animals, but it is rarely studied using quantitative methods in microscopic invertebrates. Bdelloid rotifers are a cosmopolitan class of aquatic invertebrates of great scientific interest because of their ability to survive in very harsh environment and also because they represent a rare example of an ancient lineage that only includes asexually reproducing species. In this class, Adineta ricciae has become a model species as it is unusually easy to culture. Yet, relatively little is known of its ethology and almost nothing on how it behaves during feeding.

Methods: To explore feeding behaviour in A. ricciae, as well as to provide an example of application of computational ethology in a microscopic invertebrate, we apply Procrustes motion analysis in combination with ordination and clustering methods to a laboratory bred sample of individuals recorded during feeding.

Results: We demonstrate that movement during feeding can be accurately described in a simple two-dimensional shape space with three main 'modes' of motion. Foot telescoping, with the body kept straight, is the most frequent 'mode', but it is accompanied by periodic rotations of the foot together with bending while the foot is mostly retracted.

Conclusions: Procrustes motion analysis is a relatively simple but effective tool for describing motion during feeding in A. ricciae. The application of this method generates quantitative data that could be analysed in relation to genetic and ecological differences in a variety of experimental settings. The study provides an example that is easy to replicate in other invertebrates, including other microscopic animals whose behavioural ecology is often poorly known.

Keywords: Behaviour; Motion analysis; Procrustes shape.


Conflict of interest statement

We declare that there are no conflicts of interest.

Figures
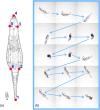
Fig. 1
Fig. 1
Configuration and example of data: a anatomical landmarks measuring body form (1, tip of the foot; 2, 6 base of the foot; 3, 5 neck; 4 tip of the head); b example of landmarked frames of an individual during feeding (arrows show consecutive frames)
Fig. 2
Fig. 2
Individual 47 before (a) and after (b) the Procrustes superimposition (unit of measure is microns in (a) and not shown in (b), as, in this and other figures showing shape, units of Procrustes shape distance are arbitrary and specific to the configuration). In (b) landmark numbers of a single frame are shown to aid the interpretation
Fig. 3
Fig. 3
Main analysis: (a) Procrustes superimposed individuals in the MAS, with the mean shape emphasised using a red wireframe (the head of the animal is the triangle, in the upper part of the plot, and the foot is at the opposite extreme). (b) Scatterplot of PC1-PC2 (percentage of variance accounted for by a PC is in parentheses in this and other PCAs); the wireframe diagrams with deformation grids show the shapes at the opposite extremes of each PC; the main clusters ('modes' of postures) found using a k-means cluster analysis are emphasised using convex hulls and different colours (in this and all other figures: blue, for foot telescoping; orange or brick red, for bending to one or the opposite side). (c) Mean clusters SSQ vs number of clusters in the k-means cluster analysis
Fig. 4
Fig. 4
Frequency of the three ‘modes’ of motion during feeding: (a) includes all three ‘modes’ and has individuals ordered according to increasing frequency of foot telescoping; (b) focuses on bending with individuals ordered according to increasing frequencies of left bending
Fig. 5
Fig. 5
PC1 of MAS shape (vertical axis, 56% of total variance) plotted against time (frame number, horizontal axis) within each individual (individual ID—identifying number—shown above each plot in this and the next figures). The blue transparent box in the top series of scatterplots emphasises, as an example, the near constancy (≈ zero) of PC1 scores for foot telescoping
Fig. 6
Fig. 6
PC2 of MAS shape (vertical axis, 32% of total variance) plotted against time (frame number, horizontal axis) within each individual. Coloured frames in this and other figures emphasise individuals whose description is used as an example in the main text
Fig. 7
Fig. 7
Individual principal component (iPCA) scatterplots of iPC1 vs iPC2. Variance accounted for by iPC1 ranges between 51 and 81%, and for iPC2 between 13 and 43%, with the cumulative variance of PC1-2 being 87–95%. In this figure and the next one (Fig. 8), the first and last (i.e., 54th) frames of each individual are emphasised using, respectively, the colours green and magenta
Fig. 8
Fig. 8
Changes in raw coordinates of the centroid position (illustrated in the vignette in the upper right corner) during feeding of each individual
Fig. 9
Fig. 9
Cumulative foot angle (exemplified in the vignette in the upper right corner) plotted against time in each individual
Fig. 10
Fig. 10
Box and jitter plots of cumulative foot angle (a) and CS (b). See main text for explanations of arrows (a) and background colour (b)
Fig. 11
Fig. 11
CS plotted against time in each individual
Fig. 12
Fig. 12
Relationships between log-transformed individual variances (i.e., the variance of a variable – e.g., foot angle–across the 54 frames of each individual) in the main descriptors of motion after removing individual 19, a strong outlier especially for its very low PC2 variance (as shown in Fig. 9, this is a consequence of 19 doing almost no foot telescoping, which is the ‘mode’ captured by PC2; thus, when 19 is included, it causes a likely spurious drop in the correlation of variance in PC2 with variance in total shape). Upper diagonal: pairwise Pearson's correlations, with significant values shown using larger fonts (the larger the font, the lower the p-value). Lower diagonal: pairwise bivariate scatterplots with a fitted trend line in red. Diagonal: frequency histogram and abbreviated name of the variable (angle = cumulative foot angle in degrees; centr. = centroid of raw coordinates (microns) used to track an individual position; CS = centroid size (microns); SH = total shape; PC1 or PC2 = shape captured by respectively PC1 or PC2 in MAS)
Fig. 13
Fig. 13
‘Instantaneous’ changes in foot angle (i.e., computed from one frame to the next, unlike in Fig. 9, which shows cumulative foot angles) plotted against time in each individual
Fig. 14
Fig. 14
PC1-2 scatterplots from MAS (a–red circles) or the original total sample of 3501 frames (b–green circles) of feeding Adineta ricciae

Similar articles

References

    1. Egnor SER, Branson K. Computational analysis of behavior. Annu Rev Neurosci. 2016;39:217–236. doi: 10.1146/annurev-neuro-070815-013845. - DOI - PubMed
    1. Pereira TD, Shaevitz JW, Murthy M. Quantifying behavior to understand the brain. Nat Neurosci. 2020;23:1537–1549. doi: 10.1038/s41593-020-00734-z. - DOI - PMC - PubMed
    1. Johansson G. Visual perception of biological motion and a model for its analysis. Percept Psychophys. 1973;14:201–211. doi: 10.3758/BF03212378. - DOI
    1. Stephens GJ, Johnson-Kerner B, Bialek W, Ryu WS. Dimensionality and Dynamics in the Behavior of C. elegans. PLOS Comput Biol. 2008;4:28. doi: 10.1371/journal.pcbi.1000028. - DOI - PMC - PubMed
    1. Berman GJ. Measuring behavior across scales. BMC Biol. 2018;16:23. doi: 10.1186/s12915-018-0494-7. - DOI - PMC - PubMed

LinkOut - more resources