. 2024 Jul 13;14(1):16181.
doi: 10.1038/s41598-024-66706-6.

Single-cell level LasR-mediated quorum sensing response of Pseudomonas aeruginosa to pulses of signal molecules

Affiliations

Single-cell level LasR-mediated quorum sensing response of Pseudomonas aeruginosa to pulses of signal molecules

Ágnes Ábrahám et al. Sci Rep. .

Abstract

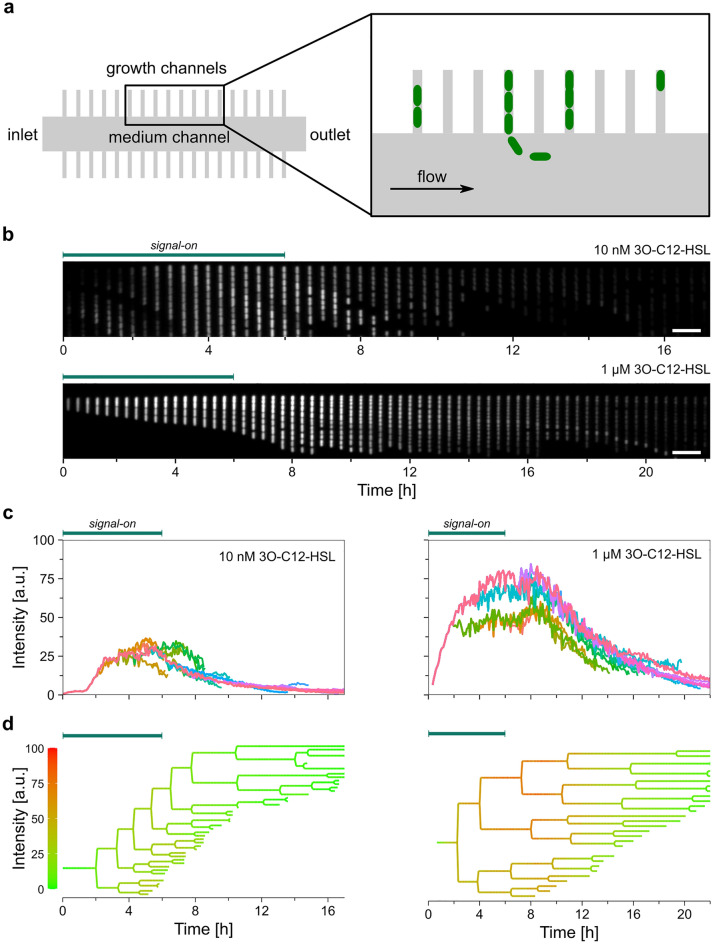
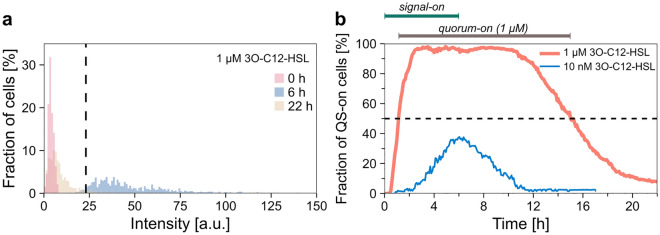
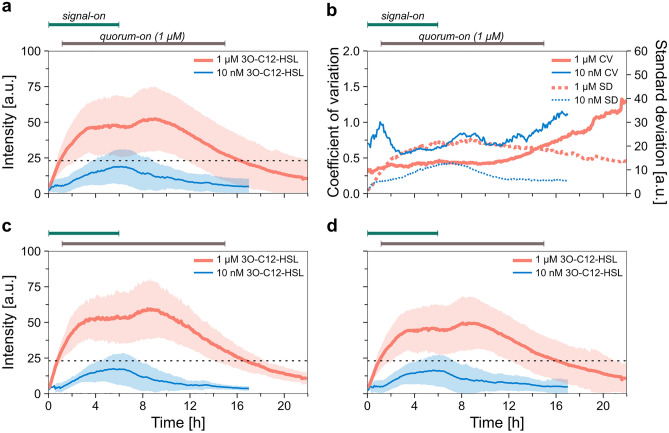
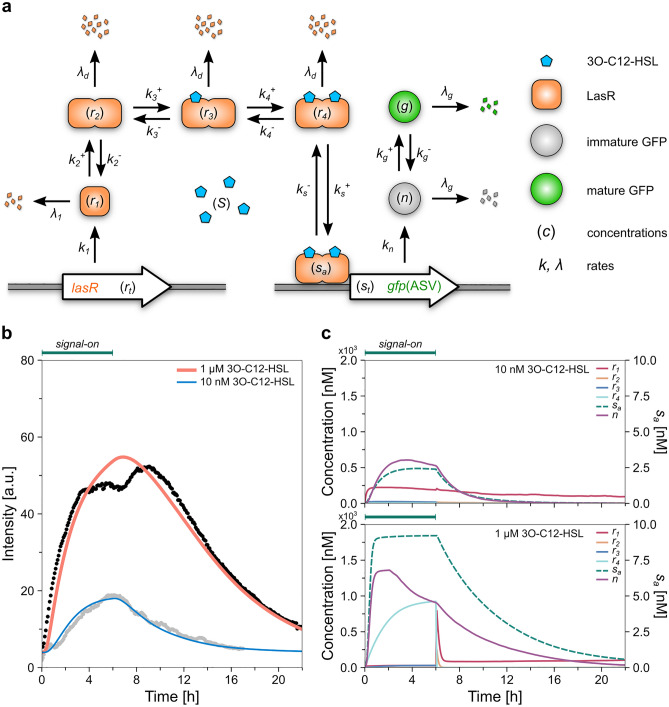
Quorum sensing (QS) is a communication form between bacteria via small signal molecules that enables global gene regulation as a function of cell density. We applied a microfluidic mother machine to study the kinetics of the QS response of Pseudomonas aeruginosa bacteria to additions and withdrawals of signal molecules. We traced the fast buildup and the subsequent considerably slower decay of a population-level and single-cell-level QS response. We applied a mathematical model to explain the results quantitatively. We found significant heterogeneity in QS on the single-cell level, which may result from variations in quorum-controlled gene expression and protein degradation. Heterogeneity correlates with cell lineage history, too. We used single-cell data to define and quantitatively characterize the population-level quorum state. We found that the population-level QS response is well-defined. The buildup of the quorum is fast upon signal molecule addition. At the same time, its decay is much slower following signal withdrawal, and the quorum may be maintained for several hours in the absence of the signal. Furthermore, the quorum sensing response of the population was largely repeatable in subsequent pulses of signal molecules.


Conflict of interest statement

The authors declare no competing interests.

Figures

Figure 1
Figure 1
Tracking the quorum sensing behavior of P. aeruginosa cells in a microfluidic mother machine device during the application of different concentrations of externally added signal molecules (10 nM and 1 µM 3O-C12-HSL). (a) Schematic illustration of the microfluidic device (not scaled). (b) Kymograph (i.e., a time series of images) of a single growth channel over the time course of the experiments showing the fluorescence intensity changes of P. aeruginosa cells upon adding/removing signal molecules in 10 nM (upper panel) or 1 µM (lower panel) concentrations. The scale bar is 10 µm. Only images taken every 20 min are shown. In addition, see Supplementary Movie 1 and 2. (c) Pixel-averaged fluorescence intensity of cells from panel (b). Each color represents a new sibling cell that appeared upon division. (d) Lineage trees of cells shown in panel (b) with color coding according to pixel-averaged cellular fluorescence intensities.
Figure 2
Figure 2
Fluorescence-based determination of quorum states. (a) Distribution of the fluorescence intensities of cells within the microfluidic device at characteristic time points for the 1 µM 3O-C12-HSL experiments, respectively: the red histogram corresponds to t1 = 0 h (283 cells), the blue one to t2 = 6 h (788 cells) and the yellow one to t3 = 22 h (675 cells); bin width = 1 a.u. The dashed black line indicates the threshold intensity value (23.1 a.u.) determined based on the 1 µM 3O-C12-HSL data to distinguish QS-on/off states on a single-cell level. (b) Fraction of QS-on cells during the experiments. Red and blue lines represent the result from the 1 µM and the 10 nM 3O-C12-HSL experiments, respectively. See Supplementary Fig. S5b for the corresponding cell numbers.
Figure 3
Figure 3
Population-level average fluorescence intensity during pulses of signal molecule. (a) Changes in the average fluorescence intensity (together with standard deviation) in case of 10 nM (blue line) or 1 µM (red line) 3O-C12-HSL treatment. The analysis was performed on fully aggregated datasets. See Supplementary Fig. S5b for the corresponding cell numbers. The dashed black line indicates the threshold intensity. (b) Coefficient of variation (continuous lines) calculated based on the mean fluorescence intensities and their standard deviations, and standard deviation (dotted lines) during the experiments. Red and blue lines represent the result from the 1 µM and the 10 nM 3O-C12-HSL experiments, respectively. (c) Population-level average fluorescence intensity calculated based on the three biological replicates for each signal concentration used. (d) Population-level average fluorescence intensity calculated based on side channel-level aggregated data for each signal concentration. Red and blue lines correspond to 1 µM and 10 nM 3O-C12-HSL signal concentrations, respectively. Shaded area shows the standard deviation. The dashed black lines indicate the calculated threshold fluorescence intensity (23.1 a.u.).
Figure 4
Figure 4
Theoretical model of the population-level QS response. (a) Schematic diagram of the functional components used in the model. (b) The results of the numerical model (blue line: 10 nM signal molecule concentration, and red line: 1 µM signal molecule concentration) along with the measured average fluorescence intensities (grey dots: 10 nM, black dots: 1 µM). (c) Calculated concentrations of molecular species (r1, r2, r3, r4, n) included in the model (solid lines), and the concentrations of gfp genes with bound LasR-signal complex (sa, dashed line) for both signal molecule concentrations.
Figure 5
Figure 5
Normalized intensity difference between sibling cells during the cell cycle. Red and blue lines represent the results of the 1 µM and 10 nM 3O-C12-HSL experiments, and the analysis was performed on 1229 and 358 cell pairs, respectively. The shaded area shows the standard deviation. Normalized cell cycle time was calculated as the x coordinate, and data were binned using a bin width of 0.05 along the x-axis.
Figure 6
Figure 6
Analysis of phenotypic traits in light of cell lineage information in the case of the 10 nM (left panel) and 1 μM (right panel) signal molecule concentrations. The analysis was performed on fully aggregated datasets. See Supplementary Fig. S13a for the number of cell pairs analyzed. (a) Normalized fluorescence intensity data averaged over the time course of the experiment for different cell lineage distance. (b) The average normalized fluorescence intensity difference for pairs of cells concurrently present in the device as a function of their cell lineage distance. (c) Probability of being in opposite quorum state data averaged over the time course of the experiment for different cell lineage distances. (d) Probability of being in opposite QS states for pairs of cells concurrently present in the device as a function of their cell lineage distance.
Figure 7
Figure 7
Quorum sensing response of P. aeruginosa cells in alternating signal on/off periods, with 1 µM maximal signal molecule concentration. (a) The red line shows the population-level average of the fluorescence intensity (the shaded area represents the standard deviation). The dashed black line indicates the threshold intensity (23.1 a.u.). Model calculation of the average fluorescence intensity data is presented by a black line, where the model parameters from Table 1 were used. See Supplementary Fig. S13b for the corresponding cell numbers. (b) Coefficient of variation (continuous line) calculated based on the mean fluorescence intensity and its standard deviation, and the standard deviation (dotted line) is presented as a function of time. (c) Fraction of QS-on cells within the device during the experiment. (d) The average normalized fluorescence intensity difference for pairs of cells concurrently present in the device as a function of their cell lineage distance. See Supplementary Fig. S13c for the number of cell pairs analyzed. (e) Probability of being in opposite QS states for pairs of cells concurrently present in the device as a function of their cell lineage distance.

Similar articles

References

    1. Miller MB, Bassler BL, et al. Quorum sensing in bacteria. Annu. Rev. Microbiol. 2001;55:165–199. doi: 10.1146/annurev.micro.55.1.165. - DOI - PubMed
    1. Bassler BL. How bacteria talk to each other: Regulation of gene expression by quorum sensing. Curr. Opin. Microbiol. 1999;2:582–587. doi: 10.1016/S1369-5274(99)00025-9. - DOI - PubMed
    1. Fuqua C, Parsek MR, Greenberg EP. Regulation of gene expression by cell-to-cell communication: Acyl-homoserine lactone quorum sensing. Annu. Rev. Genet. 2001;35:439–468. doi: 10.1146/annurev.genet.35.102401.090913. - DOI - PubMed
    1. Whitehead NA, Barnard AM, Slater H, Simpson NJ, Salmond GP. Quorum-sensing in gram-negative bacteria. FEMS Microbiol. Rev. 2001;25:365–404. doi: 10.1111/j.1574-6976.2001.tb00583.x. - DOI - PubMed
    1. de Kievit TR, Iglewski BH. Bacterial quorum sensing in pathogenic relationships. Infect. Immun. 2000;68:4839–4849. doi: 10.1128/IAI.68.9.4839-4849.2000. - DOI - PMC - PubMed

MeSH terms

Substances

LinkOut - more resources