. 2024 Jun 30;16(13):2426.
doi: 10.3390/cancers16132426.

Purinergic Ca2+ Signaling as a Novel Mechanism of Drug Tolerance in BRAF-Mutant Melanoma

Affiliations

Purinergic Ca2+ Signaling as a Novel Mechanism of Drug Tolerance in BRAF-Mutant Melanoma

Philip E Stauffer et al. Cancers (Basel). .

Abstract

Drug tolerance is a major cause of relapse after cancer treatment. Despite intensive efforts, its molecular basis remains poorly understood, hampering actionable intervention. We report a previously unrecognized signaling mechanism supporting drug tolerance in BRAF-mutant melanoma treated with BRAF inhibitors that could be of general relevance to other cancers. Its key features are cell-intrinsic intracellular Ca2+ signaling initiated by P2X7 receptors (purinergic ligand-gated cation channels) and an enhanced ability for these Ca2+ signals to reactivate ERK1/2 in the drug-tolerant state. Extracellular ATP, virtually ubiquitous in living systems, is the ligand that can initiate Ca2+ spikes via P2X7 channels. ATP is abundant in the tumor microenvironment and is released by dying cells, ironically implicating treatment-initiated cancer cell death as a source of trophic stimuli that leads to ERK reactivation and drug tolerance. Such a mechanism immediately offers an explanation of the inevitable relapse after BRAFi treatment in BRAF-mutant melanoma and points to actionable strategies to overcome it.

Keywords: ERK; P2X7; calcium signaling; non-genetic drug tolerance.


Conflict of interest statement

The authors have no conflicts of interest to report.

Figures

Figure 1
Figure 1
Ca2+ transport and cytoplasmic Ca2+ regulation are associated with drug tolerance. (A) GO term representation of significantly upregulated genes from bulk RNAseq data across four melanoma cell lines under BRAFi conditions for 8 days, a treatment previously shown to induce an idling population of drug-tolerant cells [28,39]. Nine out of 10 of the top GO terms relate explicitly to ions and ion channels, two of which relate specifically to Ca2+, although Ca2+-related genes are encompassed in nearly all of these GO terms. (B) Representative traces from imaging of [Ca2+]cyt spikes with Fura-2 in A375 cells treated with 8 µM PLX4720 for 14 days. Data are plotted as a ratio of Fura-2 excitation/emission at 340/380 nm; an increase in the ratio indicates an increase in cytoplasmic Ca2+. A variety of spike patterns, magnitudes, and frequencies observed in the population are represented here. (C) A375 cells were treated with 8 µM PLX4720 for the indicated number of days before imaging with Fura-2 for 40 min to detect [Ca2+]cyt spikes. Traces were identified as having at least one spike or no spikes using an automated spike detection algorithm. Bootstrapping was performed iteratively to randomly select cells in the datasets to estimate the proportions of the population that experienced at least one spike. With increasing treatment time, there is a clear increase in the activity of [Ca2+]cyt spikes. (D) A375 cells treated with 8 µM PLX4720 for 3 days were imaged with Calbryte-520 to detect [Ca2+]cyt spikes under conditions with and without e[Ca2+]. Traces were manually assessed for the presence of [Ca2+]cyt spikes, and proportions of spiking cells were determined with bootstrapping. (E) Store-operated Ca2+ entry (SOCE) assays were performed on A375 cells treated with 8 µM PLX4720 or vehicle for 3 days to quantify ER Ca2+ content and activity levels of SOCE. (F) Integrals were taken to quantify Ca2+ released during the ER Ca2+ phase, separate from the SOCE phase of the assay. Values within individual cells are background-normalized and plotted to generate these distributions.
Figure 2
Figure 2
Upregulation and activation of purinergic receptors induce spontaneous cytoplasmic Ca2+ spiking and activation of ERK in drug-tolerant cells. (A) Volcano plot of up- and down-regulated genes in melanoma cells under BRAFi conditions for 8 days. Data are from bulk RNAseq of a representative cell line, i.e., A375, out of four that were tested (all data combined are shown in Supplementary Figures S7 and S8). Reduced MEK-dependent genes and increased melanocyte differentiation genes changed for the continued inhibition of oncogenic BRAF activity, as expected [49,50,51]. Transcripts for the Ca2+ channel P2RX7 (upper right) are enriched 250-fold, with a p-value of <10−150. (B) Log2-fold change in the expression of P2RX7 transcripts before and after BRAFi treatment (8 days) in four BRAF-mutant melanoma cell lines. (C) A375 cells were treated with 8 µM PLX4720 for 3 days before being treated with the P2X7 inhibitors, i.e., AZD9056 and isoPPADS (or vehicle), immediately before imaging with Calbryte-520 to detect [Ca2+]cyt spikes. Traces were manually analyzed for spiking activity. Bootstrapping was performed to generate the proportions of spiking cells presented in this figure. These drugs had inhibitory effects on spiking activity at concentrations expected from their known IC50 values. (D) A375 cells treated with 8 µM PLX4720 for 3 days were imaged with Calbryte-520 to detect [Ca2+]cyt spikes, followed by fixation and staining for ppERK. Plotting ppERK staining intensity for cells classified as spiking or no spiking by manual assessment revealed higher ppERK staining in spiking cells. (E) A375 cells treated with BRAFi for 3 days were incubated with a panel of P2X7 inhibitors (or vehicle) for one hour and assessed for levels of ppERK intensity at the single-cell level with and without inhibitors present. Cells staining positive for ppERK were quantified and calculated as ratios (fractions) of vehicle control. Log-logistic models of concentration-dependent effects of each P2Xi were fit to the data and are represented by the lines.
Figure 3
Figure 3
Exogenous ATP enhances Ca2+ spiking and ppERK activation via P2X7 receptors in drug-tolerant cells. (A) Immunofluorescence detection of dual-phosphorylated ERK (ppERK) was performed on drug-sensitive (60 min of BRAFi) and drug-tolerant (3 days of BRAFi) cells treated with 39 µM of exogenous ATP or vehicle control (0 µM). Cells without detectable ppERK staining were assigned values of −0.5 and are represented by the blue distributions. The intensity of ppERK staining is represented by the fuschia-colored distributions. A ppERK intensity score was calculated from the percent of positive cells and the intensity distributions of ppERK-positive cells and normalized to the 1 min time point. The ppERK intensity score, the number of cells in each condition, and the percentage of ppERK-positive cells (%pos) are indicated to the right of each pair of distributions per condition. The ppERK intensity score and %pos increased in a time-dependent manner in drug-tolerant but not drug-sensitive cells. (B) [Ca2+]cyt spiking activity was assessed in Calbryte-loaded A375 cells treated with BRAFi for 3 days without or with 39 µM ATP stimulation and without or with pretreatment of the P2Xi isoPPADS at the indicated concentrations. The addition of ATP significantly increased the proportion of spiking cells, which was inhibited by the addition of isoPPADS. (C) A panel of P2X inhibitors (100 nM each) or vehicle were preincubated on drug-tolerant A375 cells, treated with 39 µM ATP for 30 min, and stained for ppERK activity. Inhibition of ATP-induced ppERK staining intensity is shown as a percent of inhibition relative to the vehicle control and shows that all P2X inhibitors that affect P2X7 activity inhibit ATP-induced ppERK, in contrast to the P2X4 inhibitor (bx430), which had no effect.
Figure 4
Figure 4
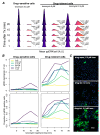
Ca2+ mobilization induces greater ppERK activation in drug-tolerant than drug-sensitive cells. (A) Immunofluorescence detection of ppERK was performed on drug-sensitive (60 min of BRAFi) and drug-tolerant (3 days of BRAFi) cells in the presence of the Ca2+ ionophore ionomycin (iono). The percentage of positive cells and mean ppERK intensity per cell increased in a time-dependent manner after the addition of ionomycin in drug-tolerant cells but not in drug-sensitive cells. (B) Mean ppERK staining intensity per cell (top) and the proportion of cells staining positive for ppERK (bottom) across a time series and concentration range of iono. Note that these graphs are an alternative depiction of the same data shown in (A) but include additional iono concentrations. Iono induced ppERK staining in drug-sensitive cells with concentrations at or above 2.5 µM, whereas ppERK was activated with as little as 39 nM iono in drug-tolerant cells, demonstrating a particular sensitivity to Ca2+ mediated activation of ppERK. ppERK staining increased at the earliest time point (5 min) in drug-tolerant cells but not drug-sensitive cells, indicating that drug-tolerant cells respond more rapidly to Ca2+. Mean staining intensity in positive cells was significantly elevated at all tested concentrations of ionomycin in drug-tolerant cells but only at the highest concentration in drug-sensitive cells. Moreover, iono activated ppERK in a greater proportion of drug-tolerant cells and did not diminish during the time series at higher concentrations of iono, in contrast to drug-sensitive cells. (C) Representative images of ppERK staining (green) with Hoechst-stained nuclei (blue) under the indicated conditions, each after 15 min of treatment. All images were captured with identical settings and have been set to the same intensity range for visualization. The scale bar shown in the bottom image is applicable to all three images.

Update of

Similar articles

References

    1. Handwerger S., Tomasz A. Antibiotic Tolerance among Clinical Isolates of Bacteria. Annu. Rev. Pharmacol. Toxicol. 1985;25:349–380. doi: 10.1146/annurev.pa.25.040185.002025. - DOI - PubMed
    1. Meredith H.R., Srimani J.K., Lee A.J., Lopatkin A.J., You L. Collective Antibiotic Tolerance: Mechanisms, Dynamics and Intervention. Nat. Chem. Biol. 2015;11:182–188. doi: 10.1038/nchembio.1754. - DOI - PMC - PubMed
    1. Arozarena I., Wellbrock C. Phenotype Plasticity as Enabler of Melanoma Progression and Therapy Resistance. Nat. Rev. Cancer. 2019;19:377–391. doi: 10.1038/s41568-019-0154-4. - DOI - PubMed
    1. Marin-Bejar O., Rogiers A., Dewaele M., Femel J., Karras P., Pozniak J., Bervoets G., Van Raemdonck N., Pedri D., Swings T., et al. Evolutionary Predictability of Genetic versus Nongenetic Resistance to Anticancer Drugs in Melanoma. Cancer Cell. 2021;39:1135–1149.e8. doi: 10.1016/j.ccell.2021.05.015. - DOI - PubMed
    1. Boumahdi S., de Sauvage F.J. The Great Escape: Tumour Cell Plasticity in Resistance to Targeted Therapy. Nat. Rev. Drug Discov. 2020;19:39–56. doi: 10.1038/s41573-019-0044-1. - DOI - PubMed