. 2024 Jul 4;25(13):7336.
doi: 10.3390/ijms25137336.

Proteomic Changes Induced by the Immunosuppressant Everolimus in Human Podocytes

Affiliations

Proteomic Changes Induced by the Immunosuppressant Everolimus in Human Podocytes

Maurizio Bruschi et al. Int J Mol Sci. .

Abstract

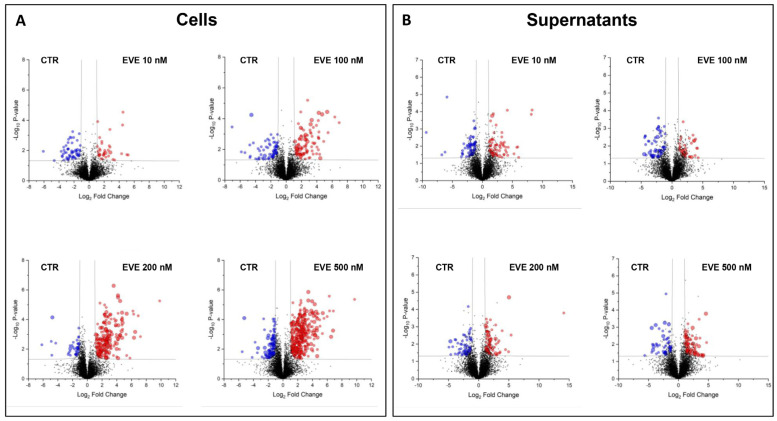
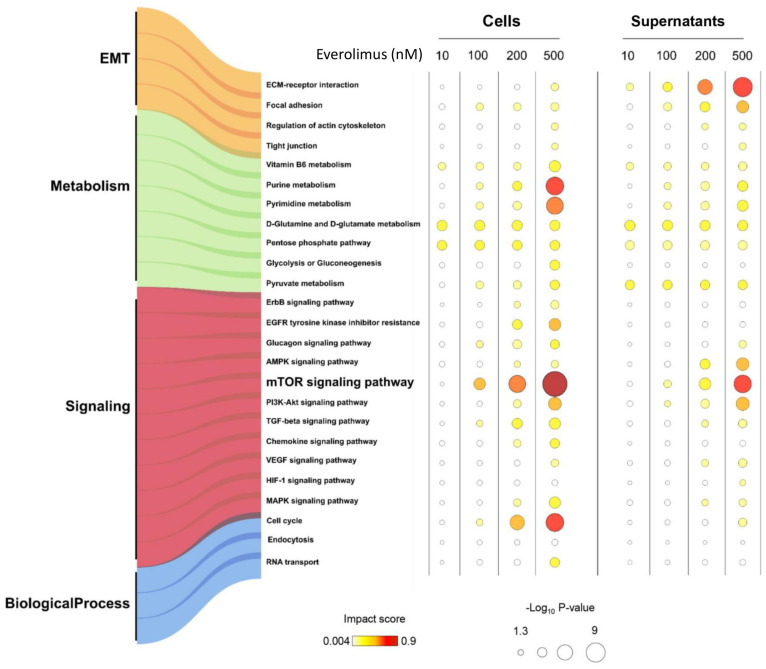
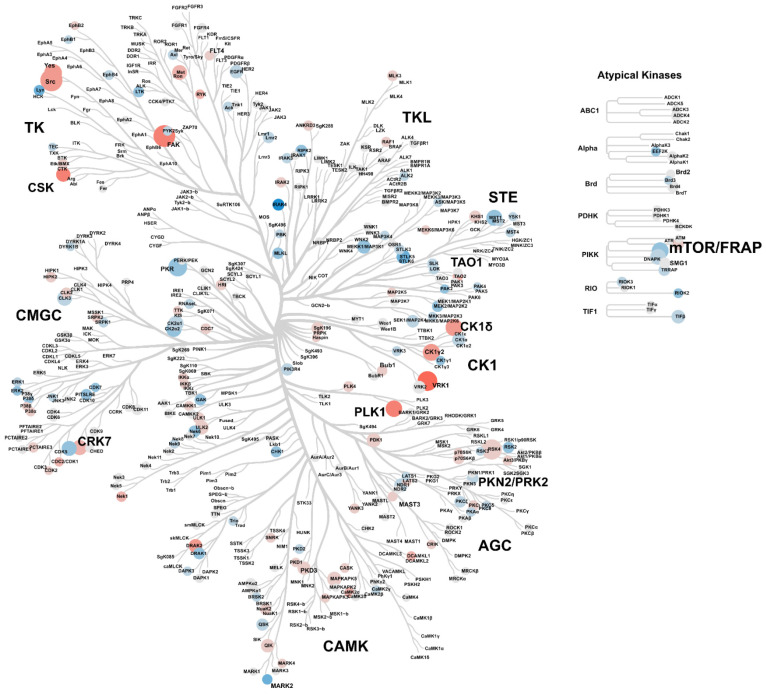
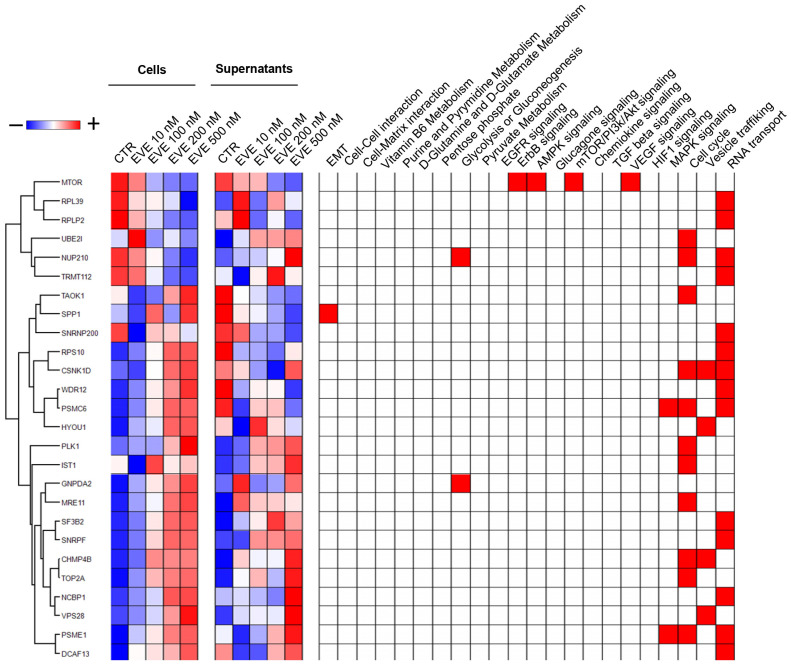
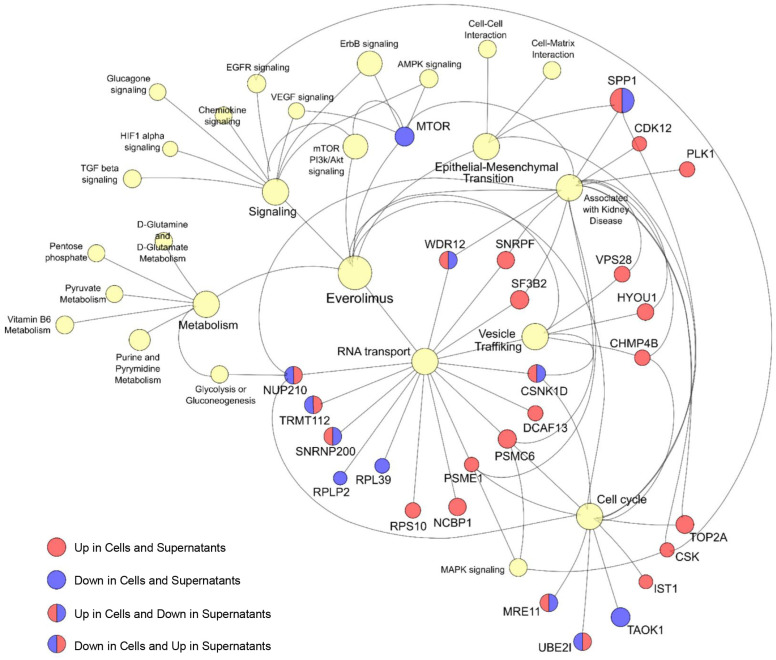
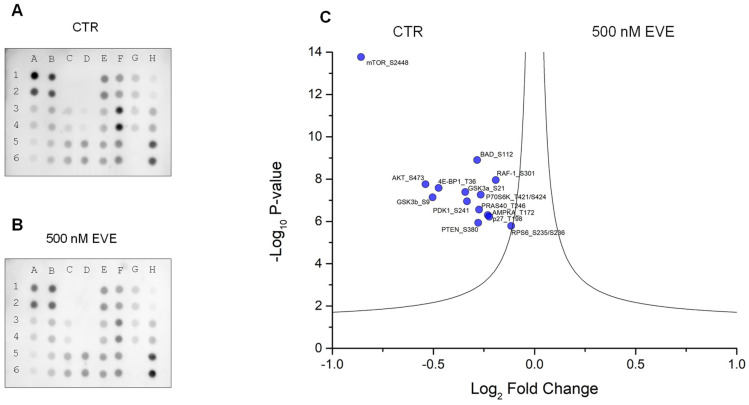
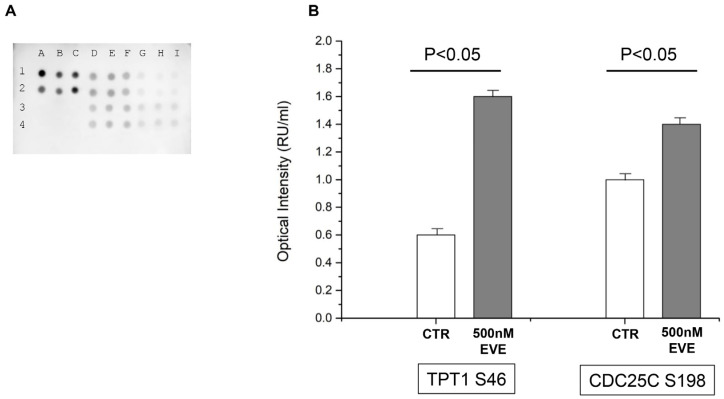
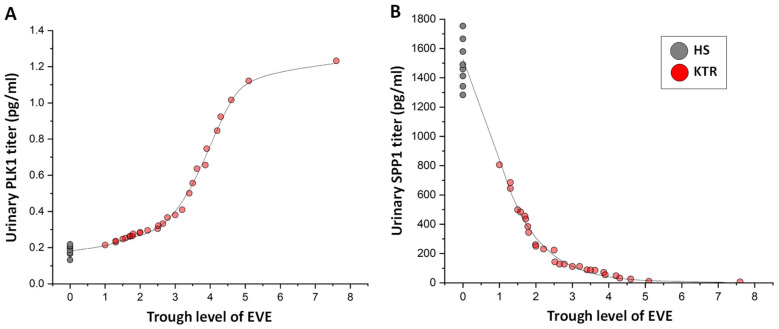
mTOR inhibitors (mTOR-Is) may induce proteinuria in kidney transplant recipients through podocyte damage. However, the mechanism has only been partially defined. Total cell lysates and supernatants of immortalized human podocytes treated with different doses of everolimus (EVE) (10, 100, 200, and 500 nM) for 24 h were subjected to mass spectrometry-based proteomics. Support vector machine and partial least squares discriminant analysis were used for data analysis. The results were validated in urine samples from 28 kidney transplant recipients receiving EVE as part of their immunosuppressive therapy. We identified more than 7000 differentially expressed proteins involved in several pathways, including kinases, cell cycle regulation, epithelial-mesenchymal transition, and protein synthesis, according to gene ontology. Among these, after statistical analysis, 65 showed an expression level significantly and directly correlated with EVE dosage. Polo-Like Kinase 1 (PLK1) content was increased, whereas osteopontin (SPP1) content was reduced in podocytes and supernatants in a dose-dependent manner and significantly correlated with EVE dose (p < 0.0001, FDR < 5%). Similar results were obtained in the urine of kidney transplant patients. This study analyzed the impact of different doses of mTOR-Is on podocytes, helping to understand not only the biological basis of their therapeutic effects but also the possible mechanisms underlying proteinuria.

Keywords: everolimus; kidney transplantation; mTOR-inhibitors; podocytes; proteomics.


Conflict of interest statement

The authors declare no conflicts of interest.

Figures

Figure 1
Figure 1
Volcano plots of the comparison between untreated and everolimus (EVE)-treated (A) podocytes and (B) their supernatants. Graphical representation of T-test analysis applied to the entire cell proteomic dataset. In the volcano graph, the x and y axes show the change in protein profiles between untreated (CTR) and treated with 10 nM EVE, CTR and treated with 100 nM EVE, CTR and 200 nM EVE, and CTR and 500 nM EVE and their −Log10 p-values, respectively. The black curves indicate the statistical significance threshold. Black, red, and blue circles correspond to non-statistically significant proteins or statistically significant proteins that were upregulated or downregulated in treated samples, respectively.
Figure 2
Figure 2
Gene ontology (GO) enrichment analysis bubble diagram. Bubble diagram of 25 GO terms enriched in cells and supernatants. In the diagram, each row represents a GO term, and each column corresponds to a condition. The normalized impact scores are represented by a pseudocolor scale varying between white, yellow, and red, corresponding to the minimum, median, and maximum impact score values, while the size was proportional to the −Log10 p-value.
Figure 3
Figure 3
Kinase tree diagram generated using the Coral app for comparison between podocytes untreated and treated with 500 nM EVE. Each circle represents an identified kinase. Log2 kinase fold change is depicted by a pseudocolor scale, with red indicating upregulation, white equal expression, and blue downregulation in treated samples. The circle size was proportional to the corresponding −Log10 p-value in the t-test.
Figure 4
Figure 4
Heatmap of 26 proteins highlighted by integration of statistical and gene ontology (GO) enrichment analysis. In the heatmap, each row represents a protein, and each column corresponds to a condition. Normalized Z scores for protein abundance are represented by a pseudocolor scale, with red indicating positive expression and blue indicating negative expression relative to each protein value. The dendrogram positioned above and to the left of the heatmap shows the results of the unsupervised hierarchical clustering analysis, which placed similar protein profile values close to each other. The diagram positioned to the right of the heatmap indicates proteins associated with enriched GO (red).
Figure 5
Figure 5
Protein interaction network. The diagram shows the association between the 28 highlighted proteins and gene ontology (GO) annotation terms as a network. Nodes (circle) and edges (line) represent proteins/GO terms and their interactions, respectively. The color intensity of each protein (node) indicates upregulation (red) or downregulation (blue) in cells or supernatants. The light yellow nodes represent GO terms.
Figure 6
Figure 6
AKT-mTOR phosphorylation pathway profiling array. Podocytes untreated (CTR) (A) or treated with 500 nM everolimus (EVE) (B) were lysed, and the cell lysates were subjected to phosphorylation pathway profiling array. In the array, the spots A1, B1, A2, B2, H5, and H6 correspond to positive controls; C1, D1, C2, D2, G5, and G6 correspond to negative controls; A3, A4, F3, F4, E5, E6, F5, and F6 correspond to internal controls; E1, E2 to AKT S473; F1, F2 to AMPKa T172; G1, G2 to BAD S112; H1, H2 to 4E-BP1 T36; B3, B4 to GSK3a S21; C3, C4 to GSK3b S9; D3, D4 to mTOR S2448; E3, E4 to p27 T198; G3, G4 to P70S6K T421/S424; H3, H4 to PDK1 S241; A5, A6 to PRAS40 T246; B5, B6 to PTEN S380; C5, C6to RAF-1 S301; D5, D6 to RPS6 S235/S236. (C) Graphical representation of Mann-Whitney analysis applied to the phosphorylation pathway profiling array. In the volcano graph, the x and y axes, respectively, show the change in intensity profile between CTR and podocytes treated with 500 nM EVE and their -Log10 p-value. The black lines indicate the statistical significance threshold. Blue circles correspond to significantly downregulated phosphorylation in treated samples.
Figure 7
Figure 7
PLK1 Phosphorylation activity. (A) Dot-blot assay of PLK1 phosphorylation activity. In the dot-blot, the spots A1, B1, C1, A2, B2, and C2 correspond to positive controls; A3, B3, C3, A4, B4, and C4 to negative controls; D1, E1, F1, D2, E2, and F2 to TPT1 S46 of everolimus-treated cells (500 nM EVE); G1, H1, I1, G2, H2, and I2 to TPT1 S46 of untreated cells (CTR); D3, E3, F3, D4, E4, and F4 to CDC25C S198 of 500 nM EVE; G3, H3, I3, G4, H4, and I4 to CDC25C S198 of CTR. (B) Graphical representation of Mann–Whitney analysis applied to the phosphorylation of PLK1 substate (TPT1 and CDC25C). PLK1 activity on TPT1 and CDC25C proteins is significantly upregulated by EVE treatment.
Figure 8
Figure 8
Correlation between urinary (A) PLK1 and (B) SPP1 levels and EVE trough levels in 28 kidney transplant recipients. Eight healthy subjects were included in the analysis. The black line indicates the best fitting equation model between the two features corresponding to (A) a sigmoid curve (R = 0.99) and (B) exponential decay (R = 0.99).

Similar articles

References

    1. Laplante M., Sabatini D.M. mTOR signaling in growth control and disease. Cell. 2012;149:274–293. doi: 10.1016/j.cell.2012.03.017. - DOI - PMC - PubMed
    1. Simcox J., Lamming D.W. The central moTOR of metabolism. Dev. Cell. 2022;57:691–706. doi: 10.1016/j.devcel.2022.02.024. - DOI - PMC - PubMed
    1. Diekmann F., Andrés A., Oppenheimer F. mTOR inhibitor-associated proteinuria in kidney transplant recipients. Transplant. Rev. 2012;26:27–29. doi: 10.1016/j.trre.2011.10.003. - DOI - PubMed
    1. Schena F.P., Pascoe M.D., Alberu J., del Carmen Rial M., Oberbauer R., Brennan D.C., Campistol J.M., Racusen L., Polinsky M.S., Goldberg-Alberts R., et al. Sirolimus CONVERT Trial Study Group. Conversion from calcineurin inhibitors to sirolimus maintenance therapy in renal allograft recipients: 24-month efficacy and safety results from the CONVERT trial. Transplantation. 2009;87:233–242. doi: 10.1097/TP.0b013e3181927a41. - DOI - PubMed
    1. Diekmann F., Budde K., Oppenheimer F., Fritsche L., Neumayer H.H., Campistol J.M. Predictors of success in conversion from calcineurin inhibitor to sirolimus in chronic allograft dysfunction. Am. J. Transplant. 2004;4:1869–1875. doi: 10.1111/j.1600-6143.2004.00590.x. - DOI - PubMed