. 2024 Jul 12;10(28):eadk2091.
doi: 10.1126/sciadv.adk2091. Epub 2024 Jul 12.

IRF8-mutant B cell lymphoma evades immunity through a CD74-dependent deregulation of antigen processing and presentation in MHCII complexes

Affiliations

IRF8-mutant B cell lymphoma evades immunity through a CD74-dependent deregulation of antigen processing and presentation in MHCII complexes

Zhijun Qiu et al. Sci Adv. .

Abstract

The mechanism by which interferon regulatory factor 8 (IRF8) mutation contributes to lymphomagenesis is unknown. We modeled IRF8 variants in B cell lymphomas and found that they affected the expression of regulators of antigen presentation. Expression of IRF8 mutants in murine B cell lymphomas suppressed CD4, but not CD8, activation elicited by antigen presentation and downmodulated CD74 and human leukocyte antigen (HLA) DM, intracellular regulators of antigen peptide processing/loading in the major histocompatibility complex (MHC) II. Concordantly, mutant IRF8 bound less efficiently to the promoters of these genes. Mice harboring IRF8 mutant lymphomas displayed higher tumor burden and remodeling of the tumor microenvironment, typified by depletion of CD4, CD8, and natural killer cells, increase in regulatory T cells and T follicular helper cells. Deconvolution of bulk RNA sequencing data from IRF8-mutant human diffuse large B cell lymphoma (DLBCL) recapitulated part of the immune remodeling detected in mice. We concluded that IRF8 mutations contribute to DLBCL biology by facilitating immune escape.


Figures
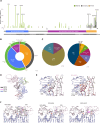
Fig. 1.
Fig. 1.. IRF8 mutations in DLBCL.
(A) Diagram of 216 IRF8 gene variants reported in publicly available DLBCL cohorts distributed along the linear protein and its recognized domains; the frequency of occurrence (%) of the variants is indicated by the height of the line, and the type of mutation is color coded based on the mutation class, related to tables S1 to S3. (B) Donut-shape graph showing the distribution (%) of the 216 IRF8 variants shown in (A) based on the mutation class and functional protein domains, related to table S2. (C) Distribution of IRF8 variants based on transcription (left, ABC, GCB, or unclassified; n = 158) and genetic-based DLBCL subgroups (right, EZB, BN2, A53, MCD, ST2, N1, other, or two or more groups; n = 91), related to table S4. (D) Overlay of the DBDs of IRF3 (gray) and IRF8 (pink). DNA-bound to IRF3 DBD is shown in light blue. (E) Left: Close-up of the N87 residue in the IRF8 DBD in contact with DNA; corresponding IRF3’s N85 in is also shown. Right: Steric clash by Y87 side chain, highlighted by red circle. (F) Left to right: C-terminal tail residues (R419 to V426) may mediate electrostatic interactions with DNA and DBD and are sandwiched between the DBD and CTD. Middle: I424 side chain faces the interior of CTD and may stabilize it via interactions with V266 and K269, and the polar side chain of Q423 may form H bonds to K45 from DBD and the phosphoryl oxygens of the DNA backbone. Right: The polar side chain of mutant T424 may disrupt the hydrophobic interior of CTD and displace Q423 from its original position, resulting in a loss of interaction with DBD and DNA.
Fig. 2.
Fig. 2.. IRF8 influence on DLBCL growth.
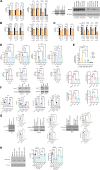
(A) Left to right: Western blot analyses of IRF8 expression in parental DLBCL cell lines, in the Toledo cell line stably expressing and empty vector (MSCV), IRF8 WT or four mutant isoforms (middle), and in two DLBCL cell lines with CRISPR-Cas9–based KO of IRF8. (B) Left to right: Cell growth pattern, determined with automated fluorescent cell counter, for the cell models described in (A). Data are means ± SD of three biological replicates. P values, WT versus each mutant or WT versus KO were calculated with two-sided Student’s t test, *P < 0.05, **P < 0.01.
Fig. 3.
Fig. 3.. IRF8 modulation of CIITA.
(A) Left to right: Western blot analyses of IRF8 expression in RAW 264.7 with IRF8 KO or stably expressing IRF8 WT and four mutant isoforms. (B) Relative luciferase CIITA reporter activity in RAW 264.7 cells expressing IRF8 WT or mutant. Data are means ± SD of three biological replicates each performed in technical triplicates (all nine data points shown). Statistical analysis is from one-way analysis of variance (ANOVA) with Bonferroni posttest, ****P < 0.0001. (C) Relative CIITA mRNA levels in RAW 264.7 and Toledo models expressing IRF8 WT or mutant. (D) Relative CIITA mRNA levels in RAW 264.7, SU-DHL4 and SU-DHL6 models of IRF8 KO. In (C) and (D), data are means ± SD. Statistical analyses are from one-way ANOVA with Bonferroni posttest, ****P < 0.0001. All assays performed in two to three biological replicates, each with technical triplicates. (E) Oncoprint display of comparative distribution of IRF8 and CIITA gene mutations in DLBCLs; total number of samples, mutations distribution, pairwise log2 odds score, and P and Q values of the correlation between the co-occurrence (positive score) or mutually exclusive (negative score) are shown in table format. Symbols are color coded based on the mutation class.
Fig. 4.
Fig. 4.. IRF8 impact on antigen driven CD4 activation.
(A) Left: Western blot of IRF8 KO models in mouse cell lines A20, BCL1, and 2PK-3; ctrl is empty vector. Right: (left to right) IL-2 levels in the conditioned media and percentage of CD4/CD69 and CD4/CD25+ expression in DO-11.10 cells cocultured with IRF8 WT or KO antigen-presenting cell (APC) models. (B) Top: Western blot of IRF8 A20 (left) or 2PK-3 (right) KO models “rescued” with stable expression of IRF8 WT or mutant. Bottom: IL-2 levels in the conditioned media and percentage of CD4/CD25+ expression in DO-11.10 cells cocultured with IRF8 KO, WT and missense (left) or nonsense (right) mutant models. In (A) and (B), data are means ± SD of three biological replicates. P values are from one-way ANOVA, Bonferroni or Fisher’s LSD posttest, *P < 0.05, **P < 0.01, ***P < 0.001, ****P < 0.0001.
Fig. 5.
Fig. 5.. IRF8 control of components of the MHCII complex.
(A) FACS analysis of H2-IA/IE (left) and HLA-DR (right) in models of IRF8 KO; WB of IRF8 in RIVA and SU-DHL2 KO models, and WB of MHCII in all IRF8 KO models in DLBCL. (B) FACS of CD74 in models of IRF8 KO. (C) FACS of H2-DM and HLA-DM in IRF8 KO models. (D) Left: FACS of CD74 and H2-DM in the IRF8 KO A20 lymphoma model “rescued” with IRF8 WT or missense or nonsense mutants (top and bottom). Right: FACS of CD74 and H2-DM in the IRF8 KO 2PK-3 lymphoma model “rescued” with IRF8 WT or missense and nonsense mutants (top and bottom). (E) Top: ChIP-qPCR of IRF8 binding to the indicated promoters – controls are IgG pull down, and a genomic region without a predicted IRF8 binding site (neg ctrl). Bottom: ChIP-qPCR of IRF8 WT, N87Y, or I424T binding to the Cd74, H2-Dm, Ciita, or H2-Aa promoters. (F) Top: WB of CD74 in 2PK-3 and A20 CD74-KO models. Bottom: IL-2 levels and % of CD4/CD25+ cells in IRF8/CD74 WT, IRF8 KO, or CD74 KOs models. (G) Left to right: A20, 2PK-3, and BCL1 models of IRF8 KO with CD74 ectopic expression (ee). WB of CD74-FLAG, IL-2 levels and % of CD4/CD25+ cells in IRF8/CD74 WT, IRF8 KO, or IRF8KO + CD74. (H) Left: WB of CD74-FLAG in IRF8 WT, N87Y, and I424T A20 models. Right: IL-2 levels and % of CD4/CD25+ cells in IRF8 WT, N87Y, and I424T (−/+ CD74 ectopic expression) models. Data are means ± SD of three biological replicates. FACS displayed as relative mean fluorescence intensity (MFI). P values are from ANOVA, with Bonferroni or Fisher’s LSD posttest, or two-sided Student’s t test. *P < 0.05, **P < 0.01, ***P < 0.001, ****P < 0.0001.
Fig. 6.
Fig. 6.. IRF8 effects on B cell lymphoma aggressiveness and immune microenvironment.
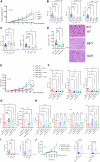
(A) Growth curve of lymphomas expressing IRF8 WT, N87Y, Q392X, or I424T. (B) FACS-based quantification of CD3, CD4 and CD8 T cells in the TME of IRF8 WT or mutant lymphomas. (C) FACS-based quantification of Tregs and NK cells in the TME of IRF8 WT or mutant lymphomas. (D) IHC-based quantification of T cell infiltrate in B cell lymphomas expressing IRF8 WT, N87Y, or I424T. Representative staining (B220, pink; CD3, brown) is shown to the right, scale bar is displayed. (E) Growth curve of lymphomas expressing IRF8 WT, IRF8 N87Y or IRF8 I424T (−/+ CD74 expression). (F) FACS-based quantification of CD3, CD4 and CD8 in the TME of IRF8 WT or mutant lymphomas (−/+ CD74 expression). (G) FACS-based quantification of Tregs and NK cells in the TME of IRF8 WT or mutant lymphomas (−/+ CD74 expression). (H) TH1/TH2 ratio, TH1, TH2, and TFH cells in the TME of IRF8 WT or mutant lymphomas (−/+ CD74 expression). (I) TH1/TH2 ratio and TFH cells in the TME of IRF8 WT, missense (N87Y) or truncating (Q392X) mutant lymphomas. (J) Growth curve of lymphomas models expressing IRF8 WT or N87Y in mice treated with control antibody or anti–PD-L1 antibody; FACS-based quantification of CD4 and CD8 in IRF8 N87Y lymphomas treated with control or anti–PD-L1 antibody. For all panels, data are means ± SD of multiple independent cohorts (n indicated in the figure). P values are from one-way ANOVA with Fisher’s LSD posttest, Mann-Whitney test, or two-sided Student’s t test; *P ≤ 0.05, **P ≤ 0.01, ***P ≤ 0.001, ****P ≤ 0.0001.
Fig. 7.
Fig. 7.. Immune composition of the microenvironment of IRF8-mutant human primary DLBCLs.
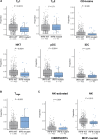
(A) From left to right, top to bottom. xCELL-defined score estimation of T helper cell (TH1 and TH2), naïve CD4, NKT, pDCs, and immature DCs (iDCs) in IRF8 WT (n = 435, gray box plot) or IRF8-mutant (n = 45, blue boxplot) DLBCLs. (B) Estimated Treg proportions in IRF8 WT (n = 286 gray box plot) or IRF8 mutant (n = 25, blue box plot) measured using CIBERSORTx. (C) Left to right: Estimated proportions of NK activated (CIBERSORTx) or estimated scores of total NK cells (MCP-counter) in IRF8 WT (n = 435, gray boxplots) or IRF8-mutant (n = 45, blue boxplots) DLBCLs. In all panels, the boxplots show median and interquartile range. P values are from two-sided Student’s t test.

Update of

Similar articles

References

    1. Thorsson V., Gibbs D. L., Brown S. D., Wolf D., Bortone D. S., Yang T. H. O., Porta-Pardo E., Gao G. F., Plaisier C. L., Eddy J. A., Ziv E., Culhane A. C., Paull E. O., Sivakumar I. K. A., Gentles A. J., Malhotra R., Farshidfar F., Colaprico A., Parker J. S., Mose L. E., Vo N. S., Liu J., Liu Y., Rader J., Dhankani V., Reynolds S. M., Bowlby R., Califano A., Cherniack A. D., Anastassiou D., Bedognetti D., Mokrab Y., Newman A. M., Rao A., Chen K., Krasnitz A., Hu H., Malta T. M., Noushmehr H., Pedamallu C. S., Bullman S., Ojesina A. I., Lamb A., Zhou W., Shen H., Choueiri T. K., Weinstein J. N., Guinney J., Saltz J., Holt R. A., Rabkin C. S., Cancer Genome Atlas Research Network, Lazar A. J., Serody J. S., Demicco E. G., Disis M. L., Vincent B. G., Shmulevich I., The immune landscape of cancer. Immunity 48, 812–830.e14 (2018). - PMC - PubMed
    1. Wellenstein M. D., de Visser K. E., Cancer-cell-intrinsic mechanisms shaping the tumor immune landscape. Immunity 48, 399–416 (2018). - PubMed
    1. Sharma P., Goswami S., Raychaudhuri D., Siddiqui B. A., Singh P., Nagarajan A., Liu J., Subudhi S. K., Poon C., Gant K. L., Herbrich S. M., Anandhan S., Islam S., Amit M., Anandappa G., Allison J. P., Immune checkpoint therapy-current perspectives and future directions. Cell 186, 1652–1669 (2023). - PubMed
    1. Challa-Malladi M., Lieu Y. K., Califano O., Holmes A. B., Bhagat G., Murty V. V., Dominguez-Sola D., Pasqualucci L., Dalla-Favera R., Combined genetic inactivation of β2-microglobulin and CD58 reveals frequent escape from immune recognition in diffuse large B cell lymphoma. Cancer Cell 20, 728–740 (2011). - PMC - PubMed
    1. Steidl C., Shah S. P., Woolcock B. W., Rui L., Kawahara M., Farinha P., Johnson N. A., Zhao Y., Telenius A., Neriah S. B., McPherson A., Meissner B., Okoye U. C., Diepstra A., van den Berg A., Sun M., Leung G., Jones S. J., Connors J. M., Huntsman D. G., Savage K. J., Rimsza L. M., Horsman D. E., Staudt L. M., Steidl U., Marra M. A., Gascoyne R. D., MHC class II transactivator CIITA is a recurrent gene fusion partner in lymphoid cancers. Nature 471, 377–381 (2011). - PMC - PubMed

MeSH terms

Substances

LinkOut - more resources