. 2024 Jun 24;20(9):3530-3543.
doi: 10.7150/ijbs.94675. eCollection 2024.

Epsti1 Regulates the Inflammatory Stage of Early Muscle Regeneration through STAT1-VCP Interaction

Affiliations

Epsti1 Regulates the Inflammatory Stage of Early Muscle Regeneration through STAT1-VCP Interaction

Jee Won Kim et al. Int J Biol Sci. .

Abstract

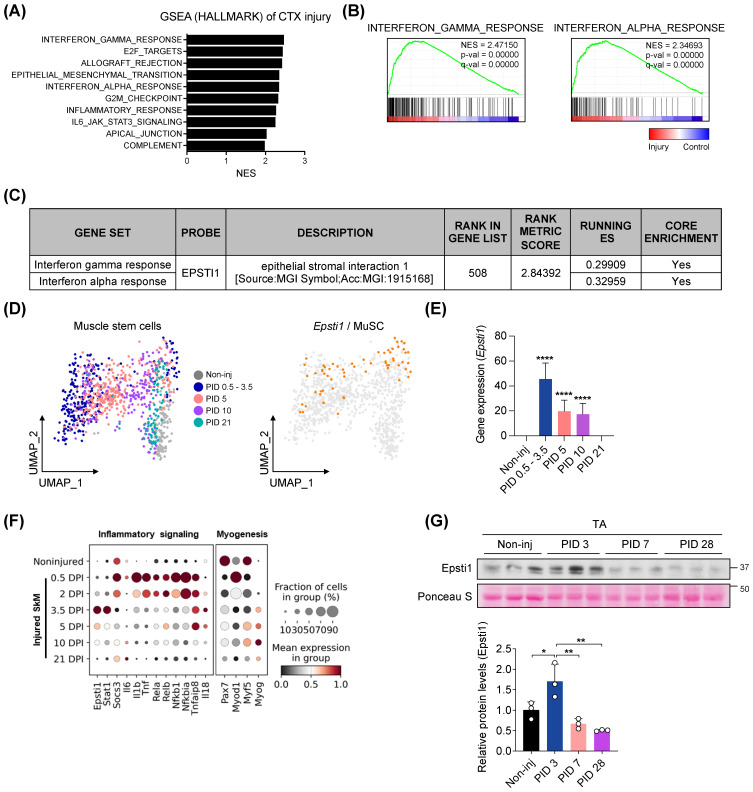
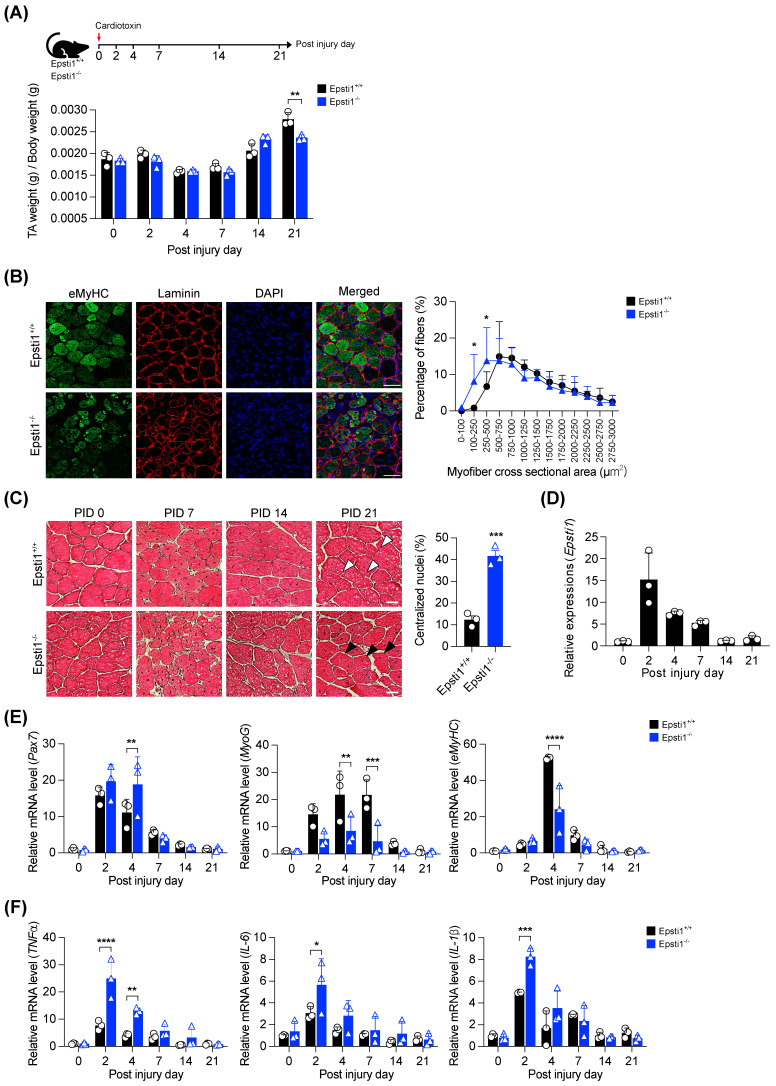
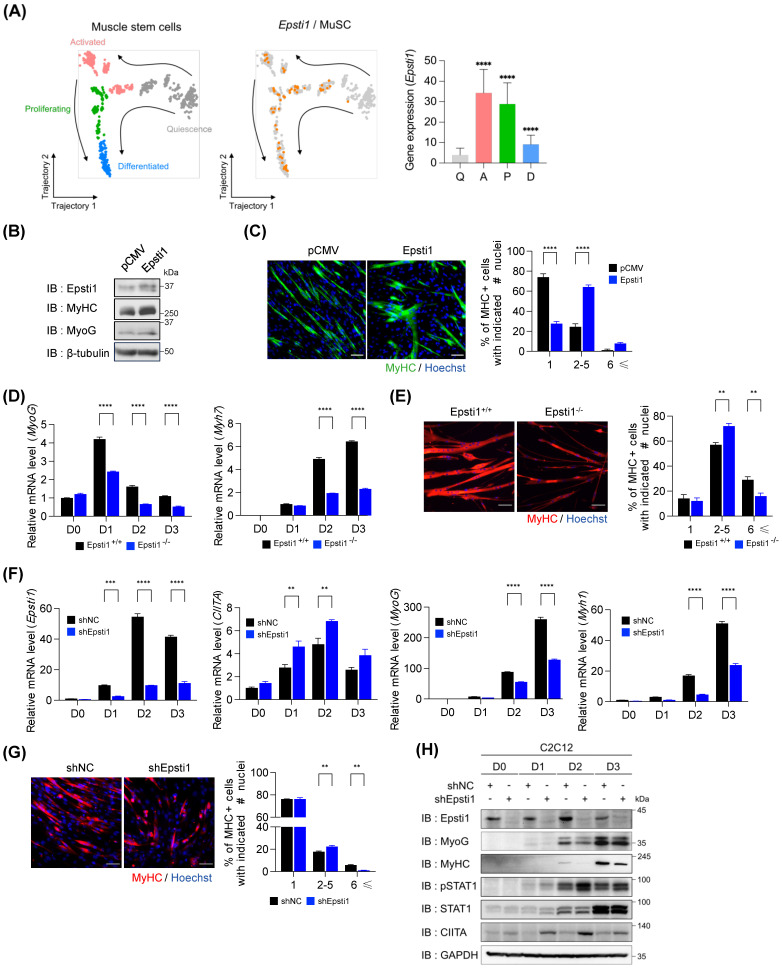
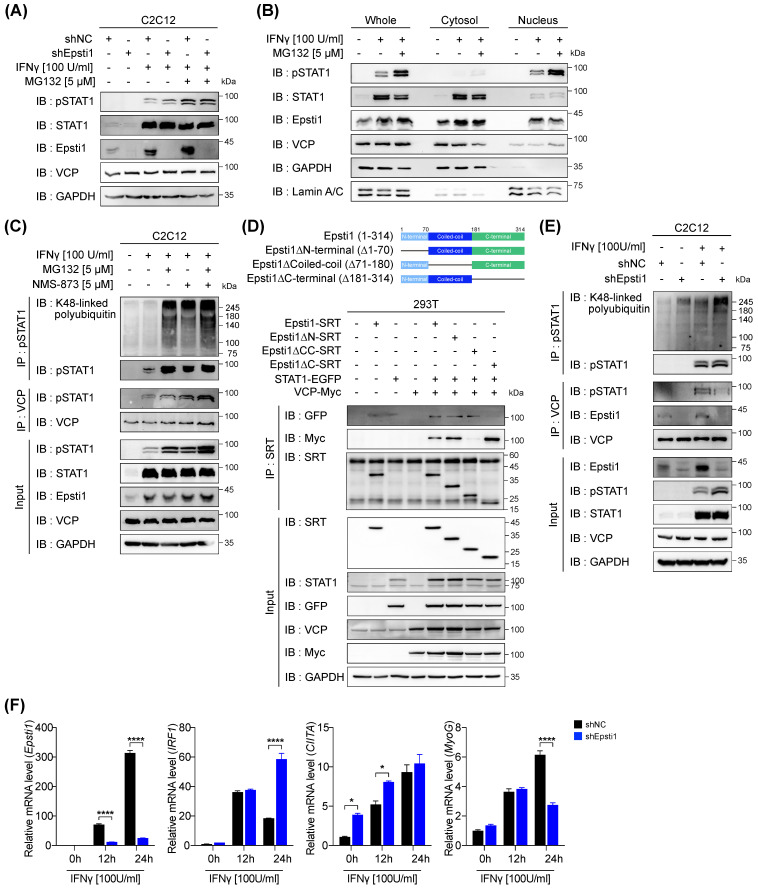
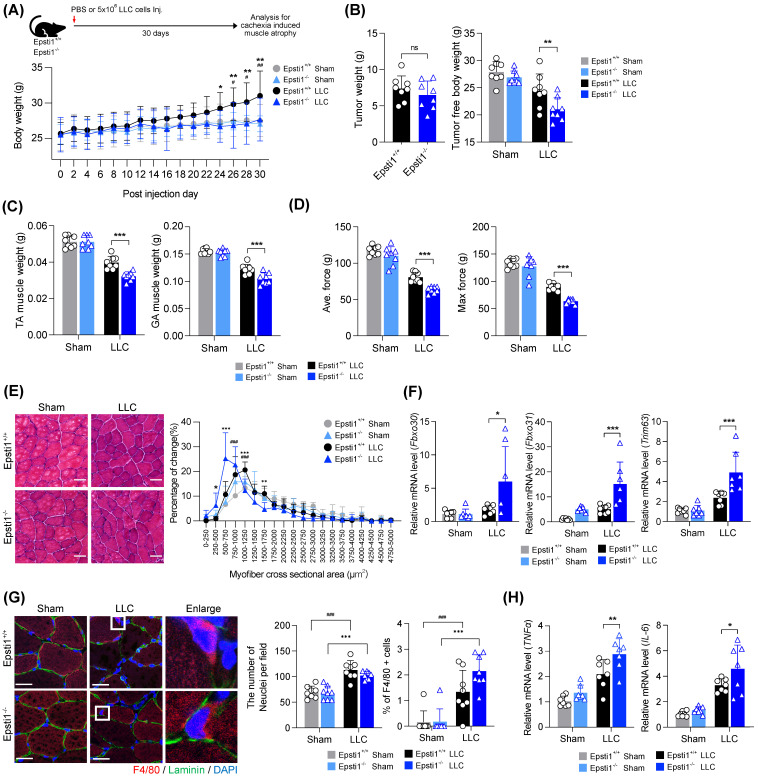
During muscle regeneration, interferon-gamma (IFN-γ) coordinates inflammatory responses critical for activation of quiescent muscle stem cells upon injury via the Janus kinase (JAK) - signal transducer and activator of transcription 1 (STAT1) pathway. Dysregulation of JAK-STAT1 signaling results in impaired muscle regeneration, leading to muscle dysfunction or muscle atrophy. Until now, the underlying molecular mechanism of how JAK-STAT1 signaling resolves during muscle regeneration remains largely elusive. Here, we demonstrate that epithelial-stromal interaction 1 (Epsti1), an interferon response gene, has a crucial role in regulating the IFN-γ-JAK-STAT1 signaling at early stage of muscle regeneration. Epsti1-deficient mice exhibit impaired muscle regeneration with elevated inflammation response. In addition, Epsti1-deficient myoblasts display aberrant interferon responses. Epsti1 interacts with valosin-containing protein (VCP) and mediates the proteasomal degradation of IFN-γ-activated STAT1, likely contributing to dampening STAT1-mediated inflammation. In line with the notion, mice lacking Epsti1 exhibit exacerbated muscle atrophy accompanied by increased inflammatory response in cancer cachexia model. Our study suggests a crucial function of Epsti1 in the resolution of IFN-γ-JAK-STAT1 signaling through interaction with VCP which provides insights into the unexplored mechanism of crosstalk between inflammatory response and muscle regeneration.

Keywords: Epsti1; IFN-γ-JAK-STAT1 pathway; Inflammatory response; Muscle regeneration; Ubiquitin-proteasomal degradation; VCP.


Conflict of interest statement

Competing Interests: The authors have declared that no competing interest exists.

Figures

Figure 1
Figure 1
Epsti1 is upregulated at the early stage of muscle regeneration. (A) Top 10 Hallmark biological processes enriched in muscles at 3 days after cardiotoxin (CTX) injury. (B) Enrichment plots of interferon-gamma response and interferon alpha response gene set in CTX-injured muscles. (C) Information that Epsti1 belongs to the leading subset of the interferon-gamma and interferon alpha response gene sets in CTX-injured muscles. (D) UMAP embedding of muscle stem cells (MuSCs) during muscle regeneration at indicated post injury day (PID). The expression of Epsti1 is colored in orange dots; all other cells are colored in gray (GSE138826). (E) Bar graph showing the expression of Epsti1 during muscle regeneration. (F) Dot plots showed Epsti1, inflammatory signaling-, and myogenesis-related genes after days post-injury (DPI). (G) Immunoblot analysis of Epsti1 in tibialis anterior (TA) muscles at the indicated day of PID. Staining intensity of Poncuea S was serves as a loading control. Below graph indicates relative Epsti1 protein levels, n = 3 mice per group. In (E) and (G), data are presented as mean ± S.D. The statistical analysis was performed using one-way ANOVA. ****p<0.0001.
Figure 2
Figure 2
Mice lacking Epsti1 exhibited impaired muscle regeneration with elevated inflammatory response. (A) Experiment schematic of cardiotoxin (CTX) injury model and the ratio of TA muscle weight (g) per body weight (g) of Epsti1+/+ (WT) and Epsti1-/- (Epsti1 KO) mice. (B) Representative images of immunostaining for eMyHC and laminin with TA sections from WT and Epsti1 KO mice at 7 days after CTX injury. Nuclei were stained with DAPI. Quantification of myofiber cross-sectional areas (CSA) in TA muscles of WT and Epsti1 KO mice is shown in the right panel. Scale bars, 50μm. (C) Representative images of H&E-stained TA sections from WT and Epsti1 KO mice at 0, 7, 14, and 21 days after CTX injury. White arrows indicate satellite cell nuclei on myofiber. Black arrows indicate centralized nuclei. Quantification of centralized nuclei is shown in the right panel. Scale bars, 30μm. (D) Relative mRNA levels of Pax7 from TA muscles at indicated PID. (E) Relative mRNA levels of Pax7, MyoG, and eMyHC from TA muscles of WT and Epsti1 KO mice at indicated day. (F) Relative mRNA levels of TNFα, IL-6, and IL-1β from TA muscles of WT and Epsti1 KO mice at indicated day. All data are presented as mean ± S.D. n = 3 mice per group. The statistical analyses were performed using two-way ANOVA (panel A, B, E and F), two-tailed Student's t-test (panel C) or one-way ANOVA (panel D). *p<0.05, **p<0.01, ***p<0.001, and ****p<0.0001.
Figure 3
Figure 3
Epsti1-deficient myoblasts exhibited decreased myogenesis with increased STAT1 signaling. (A) Pseudotime analysis of myogenic cells (including Pax7+MuSCs, myogenic progenitors, and myoblasts) was performed by using monocle2, which revealed four different cell states. Expression of Epsti1 during muscle regeneration stages was visualized in orange (GSE150336) (left panel). Bar graph showing the expression of Epsti1 in each regeneration stage (Q, quiescence; A, activated; P, proliferating; D, differentiated) (right panel). (B) Immunoblot analysis of pCMV (control) and Epsti1 overexpressed C2C12 cells after 3 days of differentiation. (C) Immunofluorescence staining of MyHC in differentiated myotubes from pCMV and Epsti1 overexpressed C2C12 cells. Nuclei were stained with Hoechst. Quantification of MyHC-positive cells with the indicated number of nuclei is shown in the right panel. Scale bars, 30μm, n = 6 fields. (D) Relative mRNA levels of MyoG and Myh7 in Epsti1+/+ (WT) and Epsti1-/- (Epsti1 KO) primary myoblasts at the indicated day of differentiation. N.D., not detected. n = 3. (E) Immunofluorescence staining of MyHC in differentiated myotubes from WT and Epsti1 KO primary myoblasts. Nuclei were stained with Hoechst. Quantification of MyHC-positive cells with the indicated number of nuclei is shown in the right panel. Scale bars, 30μm, n = 3 fields. (F) Relative mRNA levels of Epsti1, CIITA, MyoG, and Myh1 in control and Epsti1 knockdown C2C12 myoblasts at the indicated day of differentiation, n = 3. (G) Immunofluorescence staining of MyHC in differentiated myotubes from control and Epsti1 knockdown C2C12 myoblasts. Nuclei were stained with Hoechst. Quantification of MyHC-positive cells with the indicated number of nuclei is shown in the right panel. Scale bars, 30μm, n = 3 fields. (H) Immunoblot analysis of control and Epsti1 knockdown C2C12 cells at the indicated day of differentiation. In (A), data are presented as mean ± S.D. The statistical analysis was performed using one-way ANOVA. In (D), (E), (F), and (G), data are presented as mean ± S.E.M. The statistical analyses were performed using two-way ANOVA. **p<0.01, ***p<0.001, and ****p<0.0001.
Figure 4
Figure 4
Epsti1 regulates VCP-mediated degradation of IFN-γ-activated STAT1. (A) Immunoblot analysis of in control (shNC) and Epsti1 knockdown (shEpsti1) C2C12 cells treated with IFN-γ (100 U/ml) for 24 hours and MG132 (5 µM) for the last 6 hours of the IFN-γ treatment. (B) Immunoblot analysis of cellular fractions isolated from C2C12 cells treated with IFN-γ (100 U/ml) for 24 hours and MG132 (5 µM) for the last 6 hours of the IFN-γ treatment. (C) Co-immunoprecipitation (Co-IP) analysis of C2C12 cells treated with IFN-γ (100 U/ml) for 24 hours, and treated with MG132 (5 µM) and/or NMS-873 (5 µM) for the last 6 hours of the IFN-γ treatment. (D) A schematic diagram representing the Epsti1 structural domains and its truncation mutants is shown in upper panel. Co-IP analysis of the interaction of VCP-Myc, STAT1-EGFP, Epsti1-SRT, and the Epsti1 truncation mutants in 293T cells. (E) Co-immunoprecipitation (Co-IP) analysis of in control (shNC) and Epsti1 knockdown (shEpsti1) C2C12 cells treated with IFN-γ (100 U/ml) for 24 hours. (F) Relative mRNA levels of Epsti1, IRF1, CIITA, and MyoG in control (shNC) and Epsti1 knockdown (shEpsti1) C2C12 cells treated with IFN-γ (100 U/ml) for the indicated time. In (F), data are presented as mean ± S.E.M. n = 3 independent biological experiments. The statistical analyses were performed using two-way ANOVA. *p<0.05 and ****p<0.0001.
Figure 5
Figure 5
Mice lacking Epsti1 exhibited more severe muscle atrophy with excessive inflammation in cancer cachexia. (A) Experiment schematic of Lewis lung carcinoma (LLC) induced cachexia model and average body weight of Epsti1+/+ (WT) and Epsti1-/- (Epsti1 KO) mice after sham or LLC tumor graft. Mice were sacrificed at 30 days after PBS or LLC cells injection. (B) Tumor mass and tumor-free body weight of WT and Epsti1 KO sham or LLC-bearing mice. (C) Weight of dissected tibialis anterior (TA) and gastrocnemius (GA) muscles. (D) Average and maximum force of muscle grip strength. (E) Representative images of H&E-stained TA sections. Quantification of myofiber cross-sectional areas (CSA) in TA muscles is shown in the right panel. Scale bars, 30μm. (F-G) Relative mRNA levels of Fbxo30, Fbxo31, Trim63, TNFα, IL-6, and IL-1β from TA muscles. (H) Representative images of immunostaining for F4/80 and laminin with TA sections from WT and Epsti1 KO sham or LLC-bearing mice. Nuclei were stained with DAPI. Quantification of the number of nuclei or % of F4/80 positive cells is shown in the right panel. Scale bars, 25μm. All data are presented as mean ± S.D. n = 7-8 mice per group. The statistical analyses were performed using two-way ANOVA except for the analysis of tumor weight in (B) which was performed using two-tailed Student's t-test. #p<0.05, ##p<0.01, and ###p<0.001 (WT sham vs. WT LLC); *p<0.05, **p<0.01, and ***p<0.001 (WT LLC vs. Epsti1 KO LLC); ns, not significant.
Figure 6
Figure 6
Schematic diagram illustrating the mechanism of degradation of IFN-γ-activated STAT1 through VCP-Epsti1 complex. In the early stages of muscle regeneration, the activation of STAT1 by IFN-γ in myogenic cells leads to the upregulation of inflammatory cytokines and the concurrent suppression of the expression of myogenic genes. In this context, Epsti1 plays a regulatory role in facilitating VCP-mediated proteasomal degradation of IFN-γ-activated STAT1 during muscle regeneration. The consequent resolution of IFN-γ-STAT1 signaling is critical for the transition from the inflammatory stage to the myogenesis stage for maintaining muscle regeneration capacity.

Similar articles

References

    1. Mukund K, Subramaniam S. Skeletal muscle: A review of molecular structure and function, in health and disease. Wiley Interdiscip Rev Syst Biol Med. 2020;12(1):e1462. - PMC - PubMed
    1. Almada AE, Wagers AJ. Molecular circuitry of stem cell fate in skeletal muscle regeneration, ageing and disease. Nat Rev Mol Cell Biol. 2016;17(5):267–79. - PMC - PubMed
    1. Tidball JG. Regulation of muscle growth and regeneration by the immune system. Nat Rev Immunol. 2017;17(3):165–78. - PMC - PubMed
    1. Yang W, Hu P. Skeletal muscle regeneration is modulated by inflammation. J Orthop Translat. 2018;13:25–32. - PMC - PubMed
    1. Wang J, Leung KS, Chow SK, Cheung WH. Inflammation and age-associated skeletal muscle deterioration (sarcopaenia) J Orthop Translat. 2017;10:94–101. - PMC - PubMed