. 2024 Aug;25(8):1367-1382.
doi: 10.1038/s41590-024-01899-6. Epub 2024 Jul 11.

Direct presentation of inflammation-associated self-antigens by thymic innate-like T cells induces elimination of autoreactive CD8+ thymocytes

Affiliations

Direct presentation of inflammation-associated self-antigens by thymic innate-like T cells induces elimination of autoreactive CD8+ thymocytes

Yuanyuan You et al. Nat Immunol. 2024 Aug.

Abstract

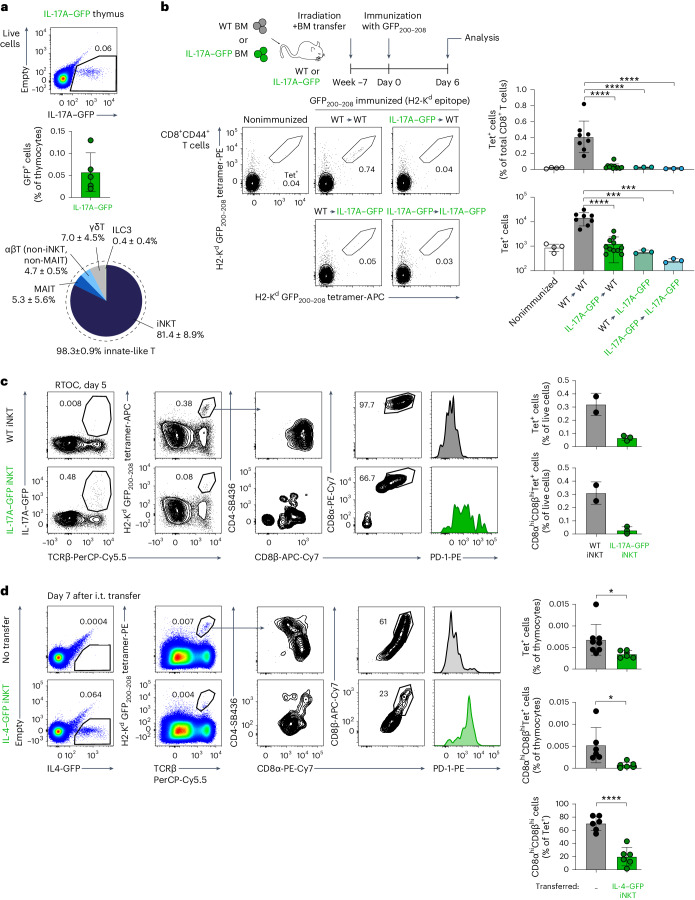
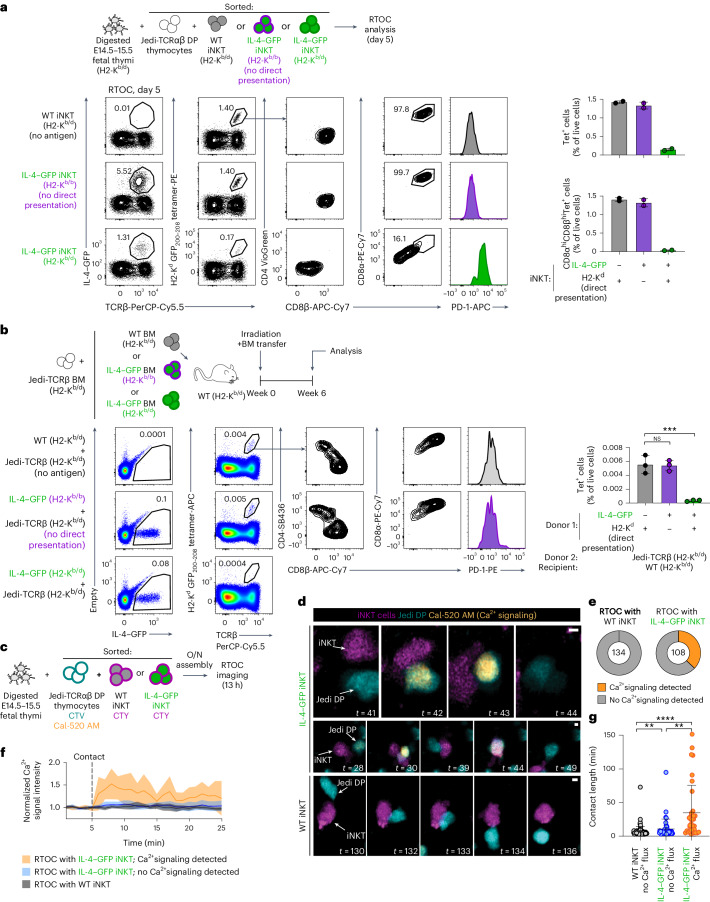
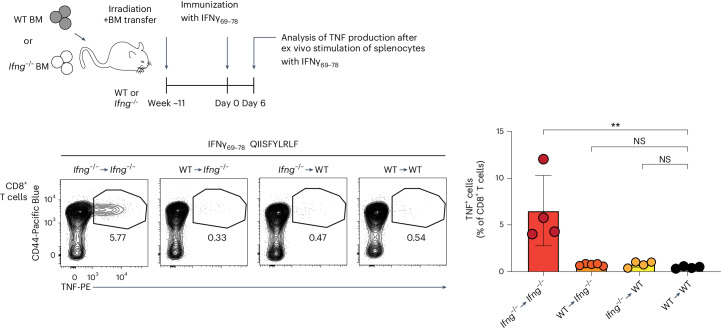
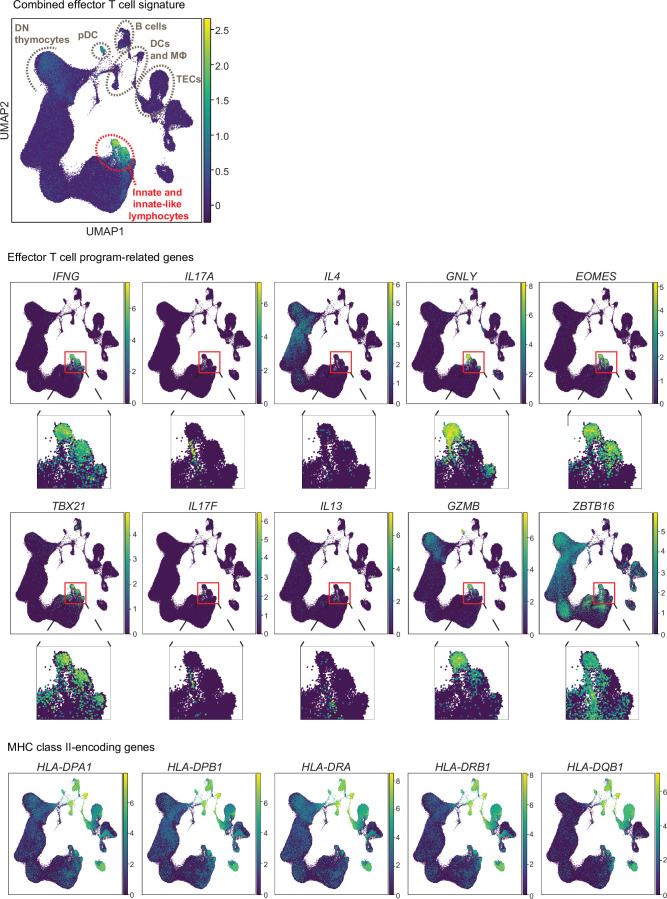
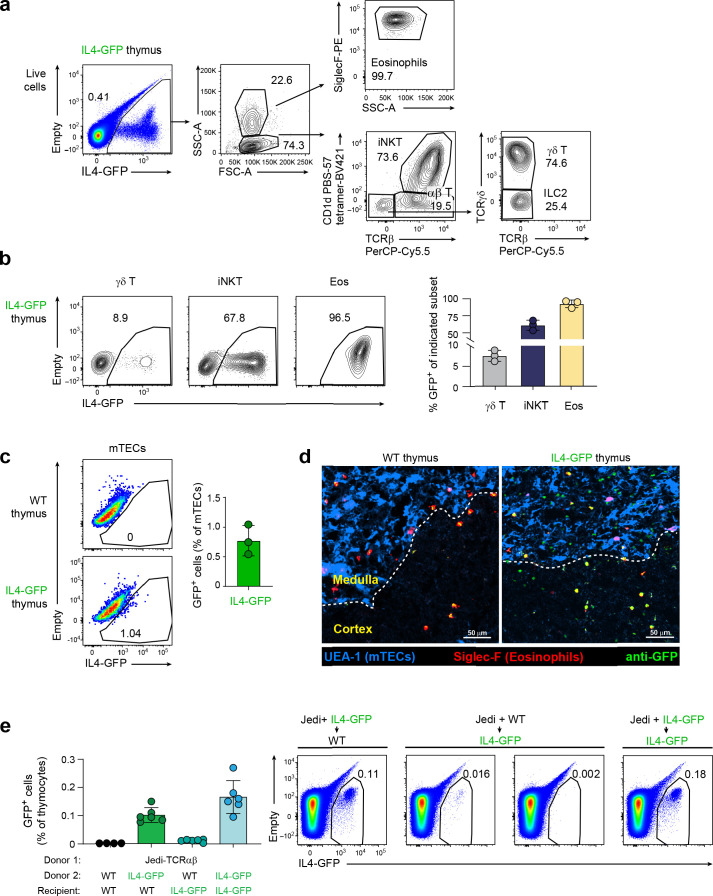
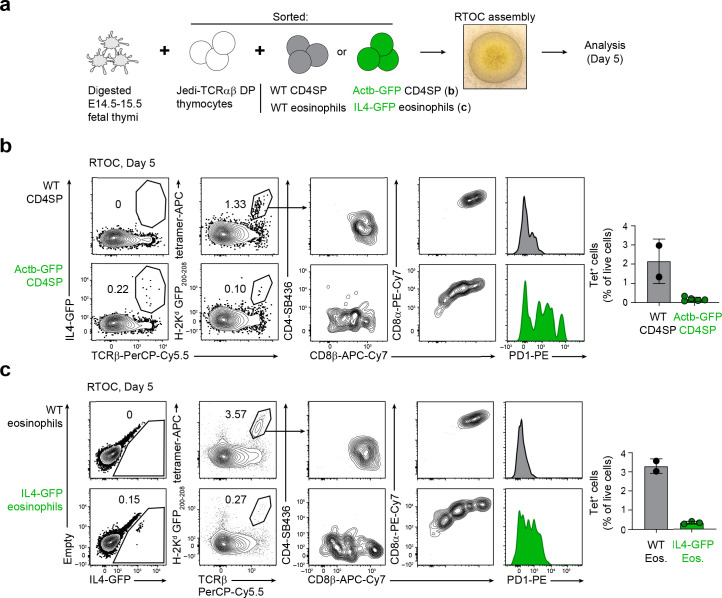
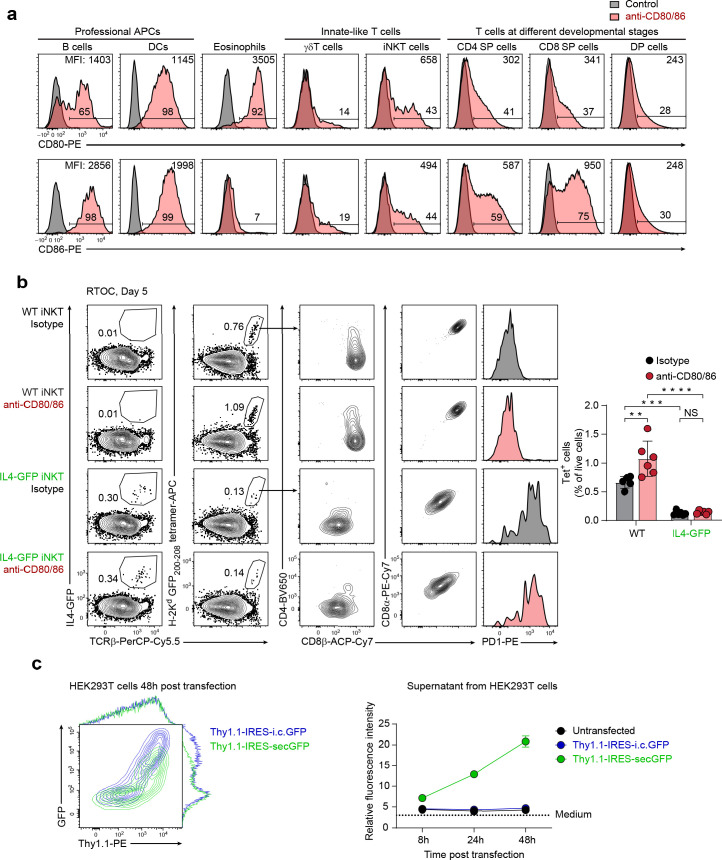
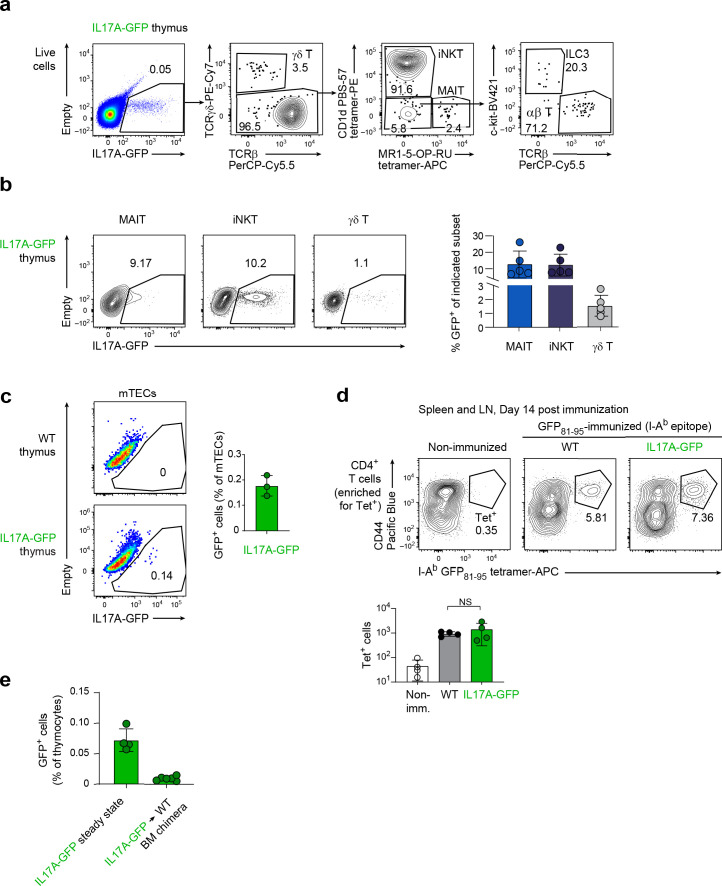
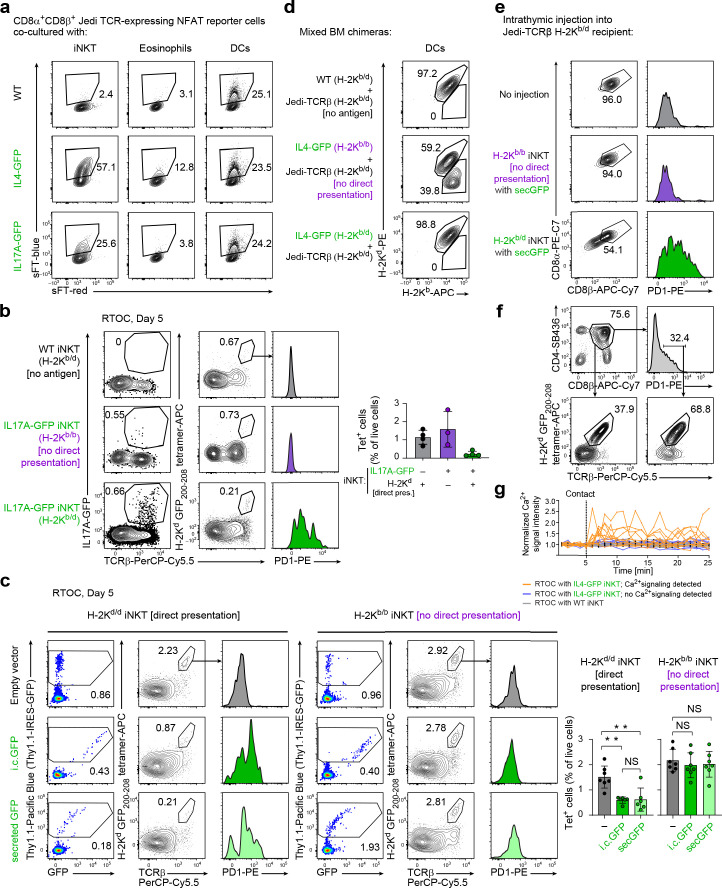
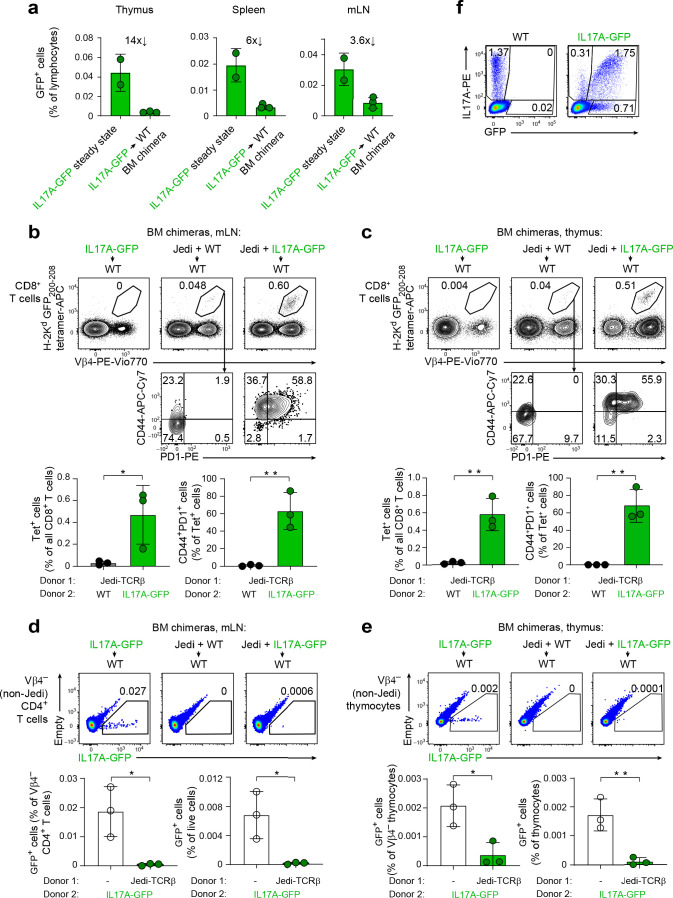
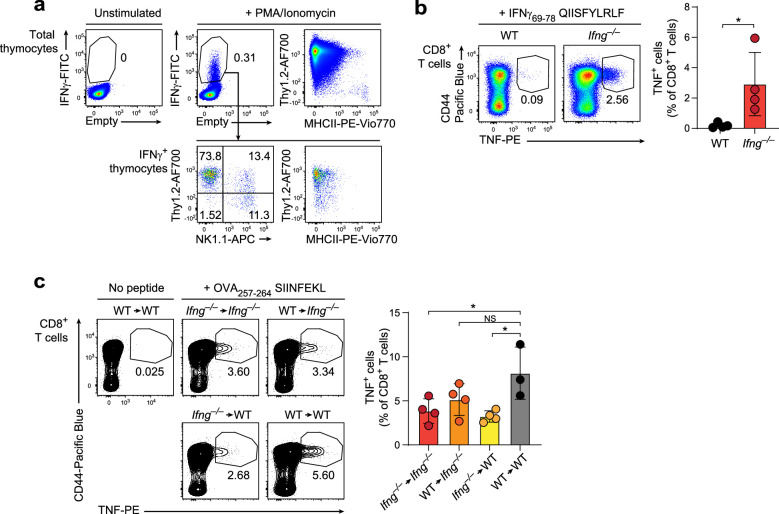
Upregulation of diverse self-antigens that constitute components of the inflammatory response overlaps spatially and temporally with the emergence of pathogen-derived foreign antigens. Therefore, discrimination between these inflammation-associated self-antigens and pathogen-derived molecules represents a unique challenge for the adaptive immune system. Here, we demonstrate that CD8+ T cell tolerance to T cell-derived inflammation-associated self-antigens is efficiently induced in the thymus and supported by redundancy in cell types expressing these molecules. In addition to thymic epithelial cells, this included thymic eosinophils and innate-like T cells, a population that expressed molecules characteristic for all major activated T cell subsets. We show that direct T cell-to-T cell antigen presentation by minute numbers of innate-like T cells was sufficient to eliminate autoreactive CD8+ thymocytes. Tolerance to such effector molecules was of critical importance, as its breach caused by decreased thymic abundance of a single model inflammation-associated self-antigen resulted in autoimmune elimination of an entire class of effector T cells.


Conflict of interest statement

The authors declare no competing financial interests.

Figures

Fig. 1
Fig. 1. Thymic innate-like T cells express a broad spectrum of inflammation-associated self-antigens.
a, Expression of Il4, Ifng and Gzmb by mouse thymic cell subsets. Data are from the Immgen database (microarray dataset). b, Uniform manifold approximation and projections (UMAPs) highlighting the expression of indicated genes in the mouse thymus cell atlas scRNA-seq dataset; AU, arbitrary units. Source data
Fig. 2
Fig. 2. Redundant role of radioresistant and radiosensitive cells in the induction of CD8+ T cell tolerance to a model inflammation-associated self-antigen.
a, WT and IL-4–GFP mice on a C57BL/6J × BALB/c F1 (CB6F1) genetic background were immunized intraperitoneally with GFP200–208 peptide using anti-CD40 and poly(I:C) as adjuvant or were left unimmunized (WT only). Six days after immunization, splenic H2-Kd GFP200–208 tetramer-binding CD8+ T cells were quantified by flow cytometry. Representative flow cytometry plots gated on CD8+CD44+ T cells (left) and quantification of frequencies (from total CD8+ T cells) and absolute numbers (right) are shown (n = 5 mice per group). The data are representative of four independent experiments. b, WT and IL-4–GFP mice on a CB6F1 genetic background were immunized subcutaneously with GFP81–95 peptide in complete Freund’s adjuvant or were left unimmunized (WT only). Fourteen days after immunization, I-Ab GFP81–95 tetramer-binding cells were magnetically enriched from pooled spleens and lymph nodes and quantified by flow cytometry. Representative flow cytometry plots gated on CD4+ T cells (left) and absolute numbers of CD4+CD44+tetramer+ T cells (right) are shown (n = 2 mice for nonimmunized, n = 5 for the other groups). Data are representative of two independent experiments; LN, lymph node. c, WT and IL-4–GFP mice (on a CB6F1 background) were lethally irradiated and reconstituted with syngeneic WT or IL-4–GFP BM cells depleted of T and NK cells. The resulting four groups of BM chimeras were immunized with GFP200–208 peptide ≥7 weeks after reconstitution and analyzed 6 days after immunization, as described in a. WT CB6F1 mice were used as an unimmunized control. Representative plots demonstrating tetramer binding by CD8+CD44+ T cells (left) and quantification of the frequency of CD8+CD44+tetramer+ cells from total CD8+ T cells and their absolute numbers (right) are shown (n = 6 mice for nonimmunized, n = 7 for WT → WT, n = 7 for IL-4–GFP → WT, n = 5 for WT → IL-4–GFP and n = 6 for IL-4–GFP → IL-4–GFP). Results are pooled from two independent experiments. Data are presented as mean ± s.d. (NS, not significant (P > 0.05); *P < 0.05 and ****P < 0.0001) and were analyzed by two-tailed Student’s t-test (b) or one-way analysis of variance (ANOVA) with a Holm–Sidak multiple comparisons test (a and c). Source data
Fig. 3
Fig. 3. Efficient central CD8+ T cell tolerance to a model inflammation self-antigen.
a, GFP expression by thymic nonstromal populations in IL-4–GFP mice. Frequency of GFP+ cells (n = 5 mice) and pie chart showing frequencies of different subsets within the GFP+ compartment (average percentage ± s.d.; n = 3 mice). See also Extended Data Fig. 2a–c. b, Images of IL-4–GFP thymus sections as analyzed by confocal immunofluorescence microscopy. The medulla was identified by staining with UEA1 lectin (blue). IL-4–GFP+ eosinophils were distinguished from IL-4–GFP+ lymphocytes (green) by co-staining with anti-Siglec-F (red). See also Extended Data Fig. 2d. c, WT and IL-4–GFP mice (on a BALB/c (H2d) background; CD45.2) were lethally irradiated and reconstituted with syngeneic WT or IL-4–GFP BM cells mixed with BM cells from Jedi mice (B10.D2 genetic background (H2d); CD45.1). Thymi of the chimeras were analyzed 6 weeks after reconstitution (n = 4 chimeras for analysis of thymi in WT + Jedi-TCRαβ → WT; n = 6 for the other groups). Jedi thymocytes were gated as CD45.1+tetramer+ cells. Expression of CD4 and CD8β on CD45.1+tetramer+ cells and viability dye and PD-1 staining of CD45.1+tetramer+CD4+CD8β+ (Jedi DP) cells are shown. The frequencies of CD4+CD8β+ (DP) and CD4CD8β+ (CD8SP) cells of CD45.1+tetramer+ Jedi thymocytes and the frequencies of dead Jedi DP cells were quantified (bottom). Data are representative of three independent experiments; Tet, tetramer. d, Analysis of the frequency of cleaved caspase-3+ cells among tetramer+CD4+CD8β+ (Jedi DP) cells in WT + Jedi-TCRαβ → WT and IL-4–GFP + Jedi-TCRαβ → WT mixed BM chimeras (from the experiment shown in Supplementary Fig. 2). Data are from one experiment with four chimeras per group; Casp3, caspase-3. e, Representative flow cytometric analysis of splenocytes from four groups of BM chimeras (same experiment as in c). Jedi cells were identified by H2-Kd GFP200–208 tetramer staining, and CD8α, CD8β and CD4 expression on these cells was analyzed. The frequencies of total and CD8αhiCD8βhi tetramer-binding cells among splenocytes were quantified (bottom). Data are presented as mean ± s.d. (*P < 0.05, **P < 0.01, ***P < 0.001 and ****P < 0.0001) and were analyzed by two-tailed Student’s t-test (d) or one-way ANOVA with a Holm–Sidak multiple comparisons test (c and e). Source data
Fig. 4
Fig. 4. Antigen expression exclusively by small numbers of iNKT cells is sufficient to induce elimination of autoreactive CD8+ thymocytes.
a, Schematic representation of the RTOC experiments shown in bd. Jedi-TCRαβ and OT-I DP thymocytes were sorted as CD4+CD8+ cells, and ex vivo iNKT cells were sorted from the thymi of WT and IL-4–GFP mice as CD1d tetramer-binding cells (without additional gating on GFP). Transduced thymic iNKT cells were sorted as Thy1.1+ (c) or GFP+ (d) CD1d tetramer-binding cells; E14.5–15.5, embryonic days 14.5–15.5. b, Flow cytometric analysis of RTOCs with ex vivo thymic WT or IL-4–GFP iNKT cells 5 days after initiation of reaggregation. Representative plots show the distribution of Jedi cells (CD45.1+), iNKT cells (CD45.2+) and fetal thymocytes (CD45.1+CD45.2+), frequencies of GFP-expressing cells, frequencies of H2-Kd GFP200–208 tetramer-binding Jedi thymocytes (quantification is shown on the right) and expression of the indicated cell-surface markers by the latter cells. Results are pooled from three independent experiments (n = 4 RTOCs for WT iNKT cells and n = 7 for IL-4–GFP iNKT cells). c, Thymic iNKT cells were transduced with Thy1.1-IRES-i.c.GFP, Thy1.1-IRES-secGFP or Thy1.1-only retroviruses. Sorted Thy1.1+ iNKT cells were added to RTOCs together with Jedi-TCRαβ DP thymocytes. Flow cytometric analysis and quantification is shown as in b (n = 5 RTOCs for empty vector, n = 10 for i.c.GFP and n = 9 for secGFP). Results are pooled from two independent experiments. d, Thymic iNKT cells were transduced with cOVA-IRES-GFP retroviruses encoding the indicated versions of the OVA257–264 epitope. Sorted GFP+ iNKT cells were added to RTOCs together with OT-I DP thymocytes. RTOCs with nontransduced iNKT cells were used as a no-antigen control. Flow cytometric analysis and quantification is shown as in b (n = 6 RTOCs for uninfected, n = 3 for N4, n = 6 for Q4, n = 3 for T4 and n = 5 for V4). Representative results from two independent experiments are shown. Data are presented as mean ± s.d. (*P < 0.05, **P < 0.01, ***P < 0.001 and ****P < 0.0001) and were analyzed by two-tailed Student’s t-test (b) or one-way ANOVA with a Holm–Sidak multiple comparisons test (c and d). Source data
Fig. 5
Fig. 5. Expression of antigen by innate-like T cells is sufficient to mediate induction of tolerance in vivo.
a, GFP expression by thymic nonstromal populations in IL-17A–GFP mice (as in Fig. 3a; n = 5 mice). See also Extended Data Fig. 5a–c; MAIT, mucosal-associated invariant T. b, Reciprocal BM chimeras were established and immunized with GFP200–208 peptide as in Fig. 2c but using IL-17A–GFP donor and recipients (all mice were on a CB6F1 background). WT mice were used as an unimmunized control. Tetramer binding by CD8+CD44+ T cells, frequencies of CD8+CD44+tetramer+ cells from total CD8+ T cells and their absolute numbers are shown. Results were pooled from two independent experiments (WT → WT and IL-17A–GFP → WT groups) or from one experiment (the rest; n = 4 mice for nonimmunized, n = 8 for WT → WT, n = 11 for IL-17A–GFP → WT, n = 3 for WT → IL-17A–GFP and n = 3 for IL-17A–GFP → IL-17A–GFP). c, RTOCs with sorted Jedi DP thymocytes and thymic iNKT cells were established and analyzed as in Fig. 4b but using IL-17A–GFP iNKT cells (sorted as CD1d tetramer-binding cells (without gating on GFP); n = 2 RTOCs for WT iNKT cells and n = 3 for IL-17A–GFP iNKT cells). Representative results of three independent experiments are shown. d, Jedi-TCRβ mice were injected intrathymically (i.t.) with iNKT cells sorted from the thymi of IL-4–GFP mice (both donor and recipient mice were on a BALB/c background). Thymi of the injected mice were analyzed 7 days later. Uninjected Jedi-TCRβ mice were used as controls. Representative plots show frequencies of GFP-expressing cells, frequencies of H2-Kd GFP200–208 tetramer-binding Jedi thymocytes and expression of the indicated cell-surface markers by the latter cells. Quantification of the frequencies of all tetramer-binding cells of total thymocytes, CD8α+CD8β+ tetramer-binding cells of total thymocytes and CD8α+CD8β+ cells of tetramer-binding cells are shown. Results are pooled from three intrathymic injection experiments (n = 8 lobes for the uninjected group and n = 6 lobes for the IL-4–GFP group; 2 lobes from the uninjected group were not stained for CD8 expression). Data are presented as mean ± s.d. (*P < 0.05, ***P < 0.001 and ****P < 0.0001) and were analyzed by two-tailed Student’s t-test (d) or one-way ANOVA with a Holm–Sidak multiple comparisons test (b). Source data
Fig. 6
Fig. 6. Innate-like T cells can mediate elimination of autoreactive CD8+ thymocytes through direct T cell-to-T cell antigen presentation.
a, RTOCs with sorted Jedi-TCRαβ DP thymocytes and iNKT cells were established and analyzed as in Fig. 4b but using iNKT cells sorted from WT mice (H2b/d background) or IL-4–GFP mice on H2b/d and H2b/b backgrounds. Results from one experiment (n = 2 RTOCs per group) are shown. b, CB6F1 WT recipient mice (H2b/d) were irradiated and transferred intravenously (i.v.) with a mix of BM cells from Jedi-TCRβ mice on a CB6F1 background (H2b/d) and WT H2b/d, IL-4–GFP H2b/d or IL-4–GFP H2b/b mice (on mixed C57BL/6J and BALB/c genetic backgrounds). Thymi of chimeras were analyzed 6 weeks after reconstitution. Representative plots demonstrate the frequencies of GFP-expressing thymocytes, frequencies of H2-Kd GFP200–208 tetramer-binding thymocytes (quantification shown on the right side) and expression of the indicated cell-surface markers by the latter cells (n = 3 chimeras per group). Data are representative of two independent experiments. c, Schematic representation of RTOC experiments shown in dg; O/N, overnight. dg, Confocal microscopy analysis of RTOCs assembled with sorted Jedi-TCRαβ DP thymocytes (labeled with CellTrace Violet (CTV) and Cal-520 AM Ca2+ sensor dye) and thymic GFP+ iNKT cells from IL-4–GFP mice or total iNKT cells from WT thymi (labeled with CellTrace Yellow (CTY)). d, Representative images showing interactions between Jedi thymocytes and IL-4–GFP iNKT cells (top and middle) and a WT iNKT cell (bottom); scale bars, 2 µm. e, Quantification of Ca2+ signaling events in Jedi thymocytes contacting WT or IL-4–GFP iNKT cells. The numbers in the circles indicate the total number of interactions analyzed. f, Normalized Ca2+ signaling intensity in Jedi thymocytes interacting with iNKT cells. Quantification was performed as described in the Methods. Mean and 95% confidence interval are shown (n = 10 Jedi cells per group). Individual curves for each cell are shown in Extended Data Fig. 6g. g, Quantification of the interaction time with iNKT cells for 90 Jedi thymocytes from RTOCs with WT iNKT cells (gray), 35 Jedi cells that underwent Ca2+ flux in RTOCs with IL-4–GFP iNKT cells (orange) and 44 Jedi cells that did not undergo Ca2+ flux in RTOCs with IL-4–GFP iNKT cells (blue). Data are presented as mean ± s.d. (**P < 0.01, ***P < 0.001 and ****P < 0.0001) and were analyzed by one-way ANOVA with a Holm–Sidak multiple comparisons test (b) or Kruskal–Wallis test (g). Source data
Fig. 7
Fig. 7. Decreased thymic abundance of IL-17A–GFP results in autoimmune elimination of peripheral GFP+ TH17 cells.
a, Schematic representation of experiments shown in bd. WT recipient mice were irradiated and transferred i.v. with T cell- and NK cell-depleted BM cells from IL-17A–GFP mice or Jedi-TCRβ mice and WT mice or Jedi-TCRβ mice and IL-17A–GFP mice (all on a CB6F1 background). Spleens were analyzed 8 weeks after reconstitution. Note the near absence of thymic IL-17A–GFP-expressing cells in BM chimeras (see Extended Data Fig. 7a). b, Frequency and cell-surface phenotype of H2-Kd GFP200–208 tetramer-binding CD8+ T cells in the spleens of BM chimeras. c, Frequency of IL-17A–GFP-expressing cells among total lymphocytes and Vβ4 (non-Jedi) CD4+ T cells. d, Twenty hours before collection, CTV-labeled TH17 cells in vitro differentiated from IL-17A–GFP CD4+ T cells were i.v. transferred into the indicated groups of chimeras. Elimination of the GFPhi fraction of CTV+ cells was assessed by flow cytometry. Representative results of two independent experiments (b and c) or one experiment (d; n = 3 chimeras per group) are shown. Data are presented as mean ± s.d. (*P < 0.05, ***P < 0.001 and ****P < 0.0001) and were analyzed by two-tailed Student’s t-tests. Source data
Fig. 8
Fig. 8. Expression of IFNγ solely by hematopoietic cells is sufficient to induce CD8+ T cell tolerance.
WT and Ifng–/– mice on a C57BL/6J background were lethally irradiated and reconstituted with syngeneic WT or Ifng–/– BM cells depleted of T and NK cells. Eleven weeks after reconstitution, the resulting four groups of BM chimeras were immunized with IFNγ69–78 and OVA257–264 peptides using anti-CD40 and poly(I:C) as adjuvant (see also Extended Data Fig. 8c). For quantification of antigen-specific CD8+ T cell responses, splenocytes were isolated 6 days after immunization and stimulated with IFNγ69–78 peptide for 6 h (Methods). Production of TNF by CD8+ T cells was analyzed by flow cytometry (n = 5 for WT → Ifng–/– and n = 4 for the other groups). Data are presented as mean ± s.d. (**P < 0.01) and were analyzed by one-way ANOVA with a Holm–Sidak multiple comparisons test. Data are representative of two independent experiments. Source data
Extended Data Fig. 1
Extended Data Fig. 1. Human thymic innate and innate-like lymphocytes express a broad spectrum of inflammation-associated self-antigens.
UMAP highlighting the expression of combined effector T cell gene signature (generated as describe in Methods) (top) and UMAPs highlighting the expression of the indicated genes in the human thymus cell atlas scRNA-seq dataset.
Extended Data Fig. 2
Extended Data Fig. 2. Characterization of GFP-expressing cell types in IL-4-GFP thymi.
a. Gating strategy for characterization of GFP-expressing cell types in IL4-GFP thymi. b. Frequency of GFP+ cells in the indicated thymic subsets in IL4-GFP mice (n = 3 mice). c. Frequency of GFP+ cells among mTECs (gated as EPCAM+CD45UEA1+Ly51) in IL4-GFP mice (n = 3 mice). d. Images of IL4-GFP and WT thymi sections as analyzed by confocal immunofluorescence microscopy as in Fig. 3b. An area of the same image as in Fig. 3b is shown for the IL4-GFP mouse. e. Frequency of GFP+ hematopoietic cells in the thymi of mixed BM chimeras shown in Fig. 3c, e. Quantification (left) and representative flow cytometric plots (right) are shown (n = 4 chimeras for [WT+Jedi-TCRαβ]→WT thymi, n = 6 for the other groups). Data are presented as the mean ± s.d. Source data
Extended Data Fig. 3
Extended Data Fig. 3. Antigen expression exclusively by small numbers of conventional thymocytes or thymic eosinophils is sufficient to induce elimination of autoreactive thymocytes.
a. Schematic representation of RTOC experiments shown in b-c. b-c RTOCs with Jedi-TCRαβ DP thymocytes established and analyzed as in Fig. 4a, b but with WT or Actb-GFP CD4SP thymocytes (b) and WT or IL4-GFP eosinophils (c) used as antigen source. Representative plots showing frequencies of GFP-expressing cells, frequencies of H2-Kd GFP200-208 tetramer-binding Jedi thymocytes (quantification shown on the right) and expression of the indicated cell surface markers by the latter cells. Representative results of three independent experiments (b) (n = 2 RTOCs for WT CD4SP, n = 5 for Actb-GFP CD4SP) or results of one experiment (c) (n = 2 for WT eosinophils, n = 3 for IL4-GFP eosinophils). Data are presented as the mean ± s.d. Source data
Extended Data Fig. 4
Extended Data Fig. 4. Assessment of possible effects of co-stimulation on induction of tolerance by innate-like T cells.
a. Expression of CD80 (top) and CD86 (bottom) by the indicated thymic populations (red) in an IL4-GFP mouse. Isotype control for CD80 is shown in grey (same in both rows). Percentage of positive cells and median fluorescent intensity (MFI) in the positive gate are indicated. The following thymic populations were analyzed: B cells (CD19+MHC-II+), DCs (CD11c+MHC-II+), eosinophils (IL4-GFP+SSChi), γδT cells (CD3+TCRγδ+), iNKT (TCRβ+CD1d-PBS-57 tetramer+), CD4SP (CD4+), CD8SP (CD8+), and DP cells (CD4+CD8+). b. RTOCs were established and analyzed as in Fig. 4b, but blocking antibodies against CD80 and CD86 or isotype control antibodies were added to culture medium. Representative results of two independent experiments (n = 5 RTOCs for WT isotype group, n = 6 for the other groups). Data are presented as the mean ± s.d. with NS: non-significant (P > 0.05), **P < 0.01, ***P < 0.001, and ****P < 0.0001. Data were analyzed by two-way ANOVA with Holm-Sidak’s multiple comparisons test. c. HEK293T cells were transfected with Thy1.1-IRES-i.c.GFP or Thy1.1-IRES-secGFP retroviral constructs. Expression of Thy1.1 and GFP by HEK293T cells 48 hours after transfection (left, contour plot overlay as well as histogram overlays for Thy1.1 and GFP are shown) and the mean value of GFP fluorescence in culture supernatants of the same cells at different timepoints (right) are shown. Error bars represent s.d. of technical replicates (n = 2 for untransfected group, n = 3 for the other groups). Source data
Extended Data Fig. 5
Extended Data Fig. 5. Characterization of GFP-expressing cell types in IL17A-GFP thymi.
a. Gating strategy for characterization of GFP-expressing cell types in IL17A-GFP thymi. b. Frequency of GFP+ cells in the indicated thymic subsets in IL17A-GFP mice (n = 5 mice). c. Frequency of GFP+ cells among mTECs (gated as EPCAM+CD45UEA1+Ly51) from IL17A-GFP mice (n = 3 mice). d. WT and IL17A-GFP mice (on C57BL/6J background) were immunized s.c. with GFP81-95 peptide in CFA or left unimmunized (WT only). 14 days after immunization, I-Ab GFP81-95 tetramer-binding cells were magnetically enriched from pooled lymph nodes and spleens and quantified by flow cytometry. Representative flow cytometry plots gated on CD4 T cells (left) and absolute numbers of CD4+CD44+Tetramer+ T cells (right) are shown. Representative results of two independent experiments (n = 4 mice per group). e. Comparison of the frequencies of GFP+ hematopoietic cells in the thymi of IL17A-GFP mice and in IL17A-GFP→WT BM chimeras (analyzed ≥ 7 weeks after reconstitution) (n = 4 for IL17A-GFP mice, n = 6 for chimeras). Data are presented as the mean ± s.d. with NS: non-significant (P > 0.05). Data were analyzed by two-tailed Student’s t test (d). Source data
Extended Data Fig. 6
Extended Data Fig. 6. Direct presentation by model antigen-expressing populations rather than cross-presentation by professional APCs is responsible for elimination of autoreactive GFP-specific CD8 thymocytes.
a. iNKT cells, eosinophils and DCs were sorted from thymi of WT, IL4-GFP and IL17A-GFP mice and co-cultured overnight with slow fluorescent timer (sFT) NFAT reporter-containing 16.2c11 cells that were engineered to express the Jedi TCR, CD8α and CD8β. Activation of NFAT signaling was measured by sFT-Blue reporter upregulation. b. RTOCs with sorted Jedi DP thymocytes and iNKT cells were established and analyzed as in Fig. 6a, but using iNKT cells sorted from WT mice (on H2b/d background) or from IL17A-GFP mice on H2b/d and H2b/b backgrounds. Results of one experiment (n = 3 RTOCs for IL17A-GFP H-2b/b group, n = 4 for the other groups). c. Thymic iNKT cells from H2d/d (BALB/c background) or H2b/b (C57BL/6J background) mice were transduced with Thy1.1-IRES-i.c.GFP, Thy1.1-IRES-secGFP and Thy1.1-only retroviruses. Sorted Thy1.1+ iNKT cells were added to RTOCs together with Jedi-TCRαβ DP thymocytes. Flow cytometric analysis and quantification are shown. Results of one experiment (n = 6 RTOCs for H-2d/d i.c.GFP and H-2d/d secGFP groups, n = 7 for the other groups). d. Mixed BM chimeras were established as described in Fig. 7b. Expression of H-2Kb and H2-Kd on thymic DCs (gated as CD11c+MHC II+) was analyzed by flow cytometry. e. Thymic iNKT cells from H2b/d (CB6F1 background) or H2b/b (C57BL/6J background) mice were transduced with Bcl2-P2A-Thy1.1-IRES-secGFP-encoding retroviruses and injected into the thymi of Jedi-TCRβ mice (on CB6F1 background). Expression of CD8α, CD8β and PD1 on CD4 H2-Kd GFP200-208 tetramer-binding thymocytes is shown 7 days after transfer. f. Gating strategy showing utilization of low levels of PD1 as a surrogate marker for TCR expression on DP thymocytes from Jedi-TCRαβ mice. g. Normalized Ca2+ signaling intensity in Jedi thymocytes interacting with iNKT cells as in Fig. 6f, but values for individual cells are shown. Data are presented as the mean ± s.d. with NS: non-significant (P > 0.05) and **P < 0.01. Data were analyzed by one-way ANOVA with Holm-Sidak’s multiple comparisons test. Source data
Extended Data Fig. 7
Extended Data Fig. 7. Decreased thymic abundance of IL17A-GFP results in autoimmune elimination of GFP+ TH17 cells.
a. Comparison of the frequencies of GFP+ lymphocytes in the thymi, spleens and mLNs of IL17A-GFP mice and in IL17A-GFP→WT BM chimeras (analyzed 8 weeks after reconstitution). One experiment with 2 IL17A-GFP mice and 3 BM chimeras. b–e. WT recipient mice were irradiated and transferred i.v. with T- and NK-cell depleted BM cells from either IL17A-GFP mice, or Jedi-TCRβ mice and WT mice, or Jedi-TCRβ mice and IL17A-GFP mice (all on CB6F1 background). Mesenteric lymph nodes (mLN) (b, d) and thymi (c, e) were analyzed 8 weeks after reconstitution. Same experiment as in Fig. 7a–c. b, c. Frequency and cell surface phenotype of H2-Kd GFP200-208 tetramer-binding CD8 T cells. d, e. Frequency of IL17A-GFP expressing cells among total lymphocytes and among Vβ4 (non-Jedi) CD4 T cells. Representative results of two independent experiments (n = 3 chimeras per group). f. TH17 cells were differentiated in vitro from WT and IL17A-GFP CD4 T cells as in Fig. 7d. Intracellular expression of IL17A cytokine and GFP was analyzed after a short-term PMA/Ionomycin restimulation. Data are presented as the mean ± s.d. with *P < 0.05 and **P < 0.01. Data were analyzed by two-tailed Student’s t test. Source data
Extended Data Fig. 8
Extended Data Fig. 8. IFNγ as an endogenous T/NK/ILC-derived inflammation-associated self-antigen.
a. Expression of Thy1, NK1.1 and MHC II by IFNγ+ and total WT thymocytes after PMA/Ionomycin stimulation. b. WT and Ifng–/– mice (on C57BL/6J background) were immunized with IFNγ69-78 peptide using anti-CD40 and Poly(I:C) as adjuvant. 6 days after immunization, splenocytes were stimulated with IFNγ69-78 peptide for 6 hours as described in Methods and production of TNF by CD8 T cells was analyzed by flow cytometry. c. WT and Ifng–/– mice (on C57BL/6J background) were lethally irradiated and reconstituted with syngeneic WT or Ifng–/– BM cells depleted of T- and NK-cells. 11 weeks after reconstitution, the resulting four groups of BM chimeras were immunized with IFNγ69-78 and OVA257-264 peptides using anti-CD40 and Poly(I:C) as adjuvant. 6 days after immunization, splenocytes were stimulated with OVA257-264 peptide for 6 hours as described in Methods and production of TNF by CD8 T cells was analyzed by flow cytometry (n = 3 for WT→WT, n = 4 for the other groups). Representative results of two independent experiments. Data are presented as the mean ± s.d. with NS: non-significant (P > 0.05) and *P < 0.05. Data were analyzed by two-tailed Student’s t test (b) or one-way ANOVA with Holm-Sidak’s multiple comparisons test (c). Source data

Similar articles

References

    1. Kyewski, B. & Derbinski, J. Self-representation in the thymus: an extended view. Nat. Rev. Immunol.4, 688–698 (2004). - PubMed
    1. Anderson, M. S. et al. Projection of an immunological self shadow within the thymus by the AIRE protein. Science298, 1395–1401 (2002). - PubMed
    1. Takaba, H. et al. Fezf2 orchestrates a thymic program of self-antigen expression for immune tolerance. Cell163, 975–987 (2015). - PubMed
    1. Michelson, D. A., Hase, K., Kaisho, T., Benoist, C. & Mathis, D. Thymic epithelial cells co-opt lineage-defining transcription factors to eliminate autoreactive T cells. Cell185, 2542–2558 (2022). - PMC - PubMed
    1. Miller, C. N. et al. Thymic tuft cells promote an IL-4-enriched medulla and shape thymocyte development. Nature559, 627–631 (2018). - PMC - PubMed

LinkOut - more resources