. 2024 Jul 8;24(1):814.
doi: 10.1186/s12885-024-12536-8.

Antitumour effects of SFX-01 molecule in combination with ionizing radiation in preclinical and in vivo models of rhabdomyosarcoma

Affiliations

Antitumour effects of SFX-01 molecule in combination with ionizing radiation in preclinical and in vivo models of rhabdomyosarcoma

Simona Camero et al. BMC Cancer. .

Abstract

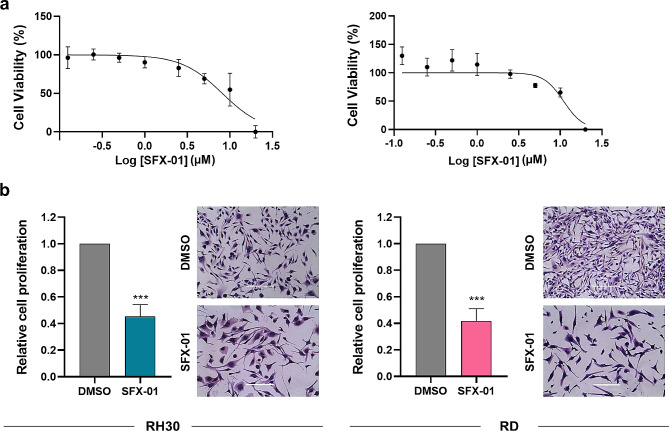
Background: Despite a multimodal approach including surgery, chemo- and radiotherapy, the 5-year event-free survival rate for rhabdomyosarcoma (RMS), the most common soft tissue sarcoma in childhood, remains very poor for metastatic patients, mainly due to the selection and proliferation of tumour cells driving resistance mechanisms. Personalised medicine-based protocols using new drugs or targeted therapies in combination with conventional treatments have the potential to enhance the therapeutic effects, while minimizing damage to healthy tissues in a wide range of human malignancies, with several clinical trials being started. In this study, we analysed, for the first time, the antitumour activity of SFX-01, a complex of synthetic d, l-sulforaphane stabilised in alpha-cyclodextrin (Evgen Pharma plc, UK), used as single agent and in combination with irradiation, in four preclinical models of alveolar and embryonal RMS. Indeed, SFX-01 has shown promise in preclinical studies for its ability to modulate cellular pathways involved in inflammation and oxidative stress that are essential to be controlled in cancer treatment.

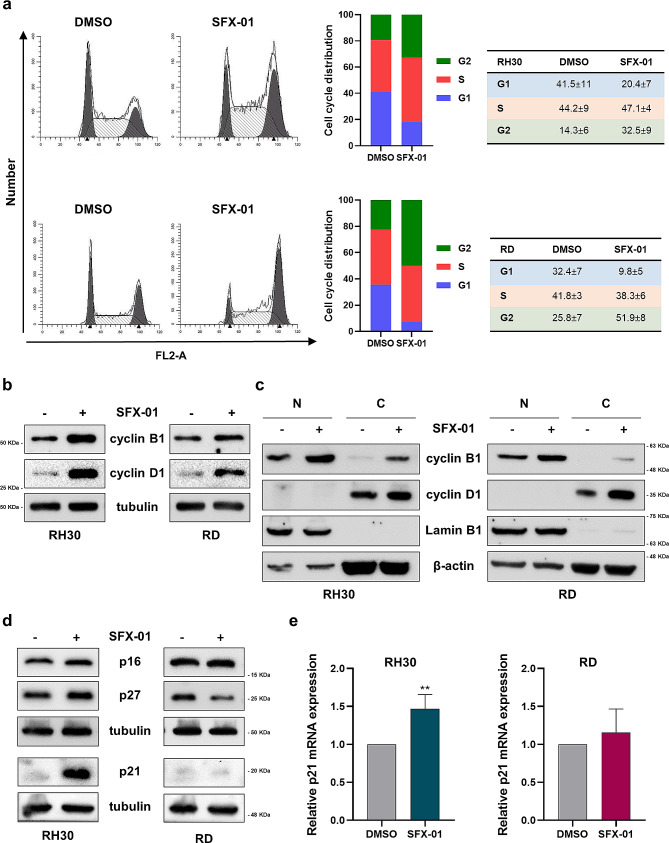
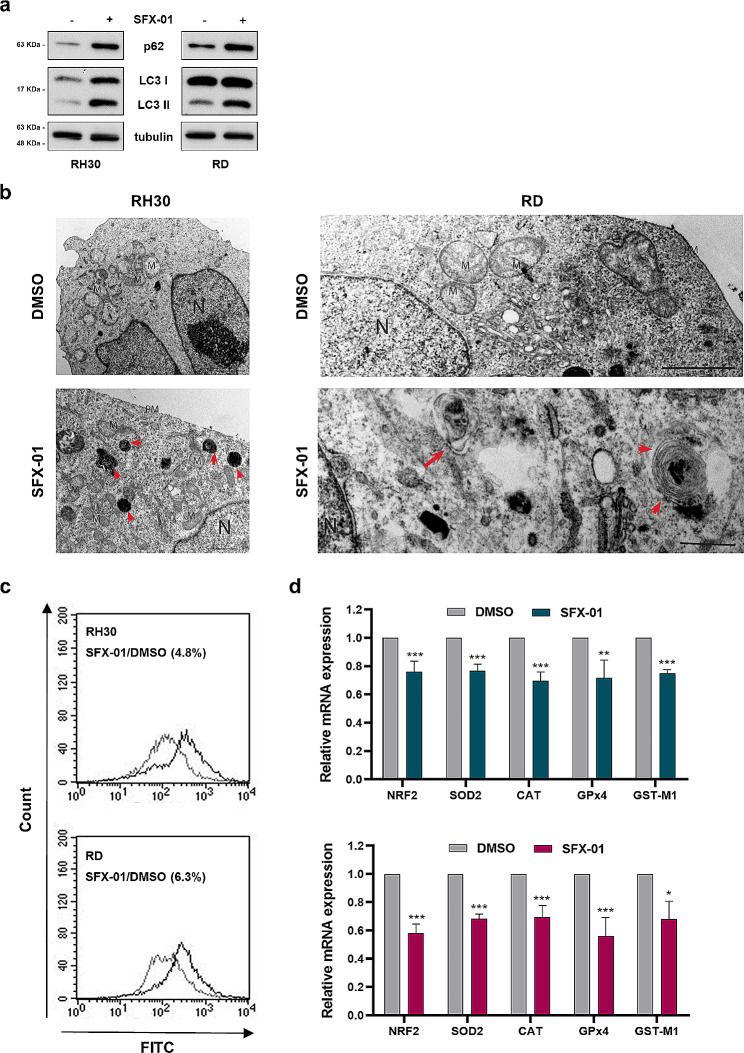
Methods: RH30, RH4 (alveolar RMS), RD and JR1 (embryonal RMS) cell lines as well as mouse xenograft models of RMS were used to evaluate the biological and molecular effects induced by SFX-01 treatment. Flow cytometry and the modulation of key markers analysed by q-PCR and Western blot were used to assess cell proliferation, apoptosis, autophagy and production of intracellular reactive oxygen species (ROS) in RMS cells exposed to SFX-01. The ability to migrate and invade was also investigated with specific assays. The possible synergistic effects between SFX-01 and ionising radiation (IR) was studied in both the in vitro and in vivo studies. Student's t-test or two-way ANOVA were used to test the statistical significance of two or more comparisons, respectively.

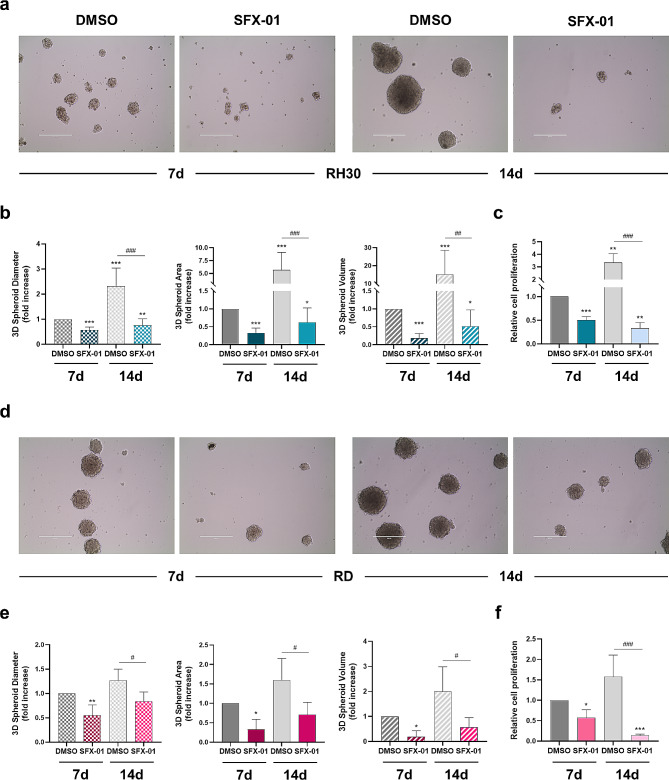
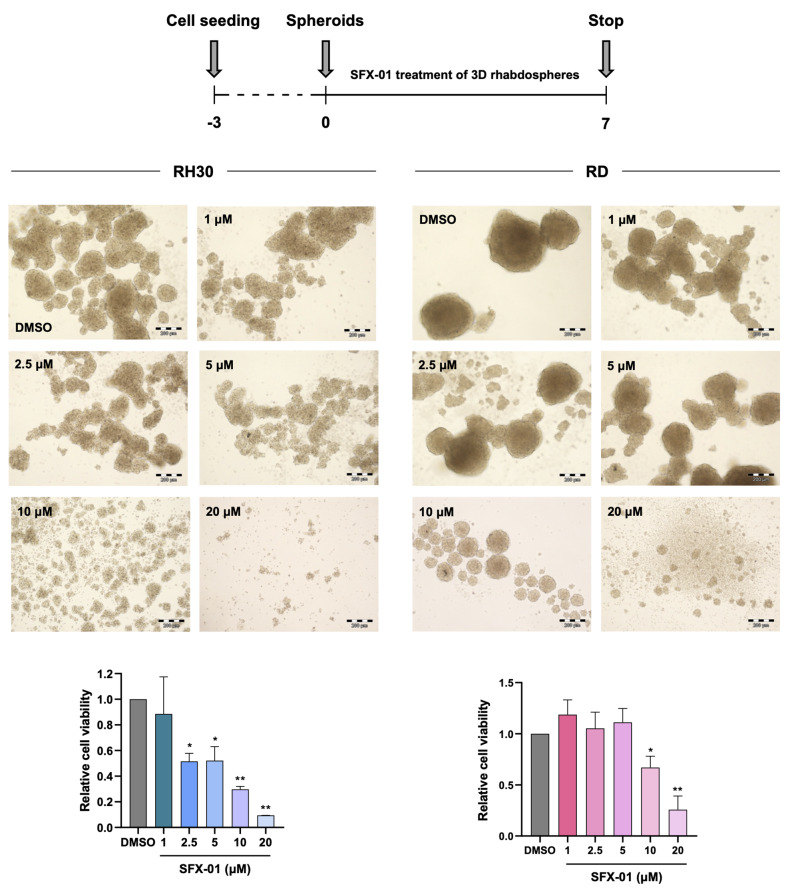
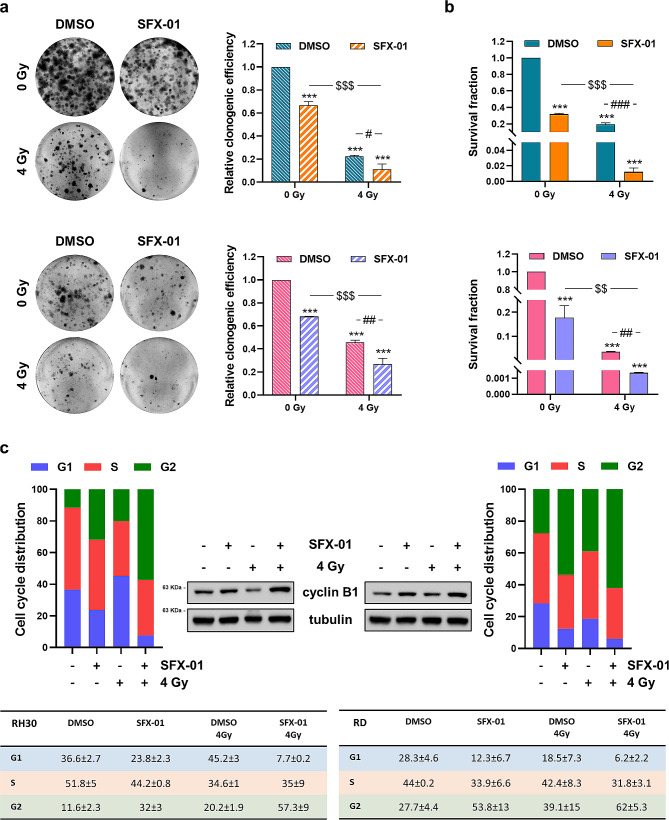
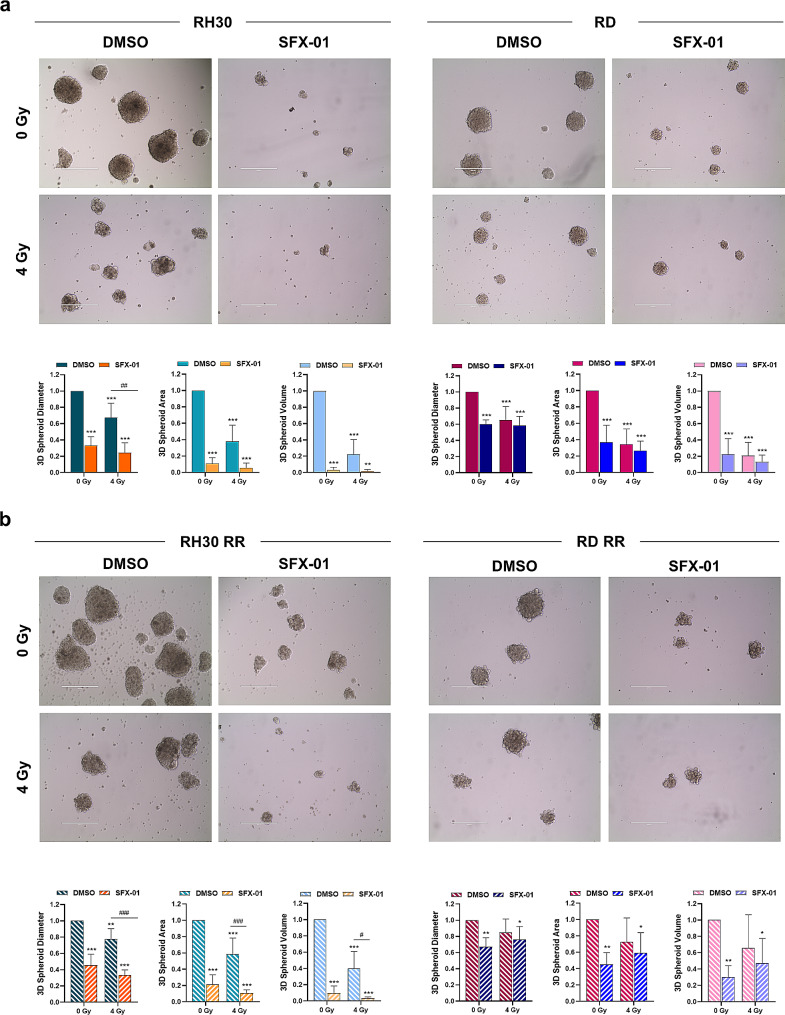
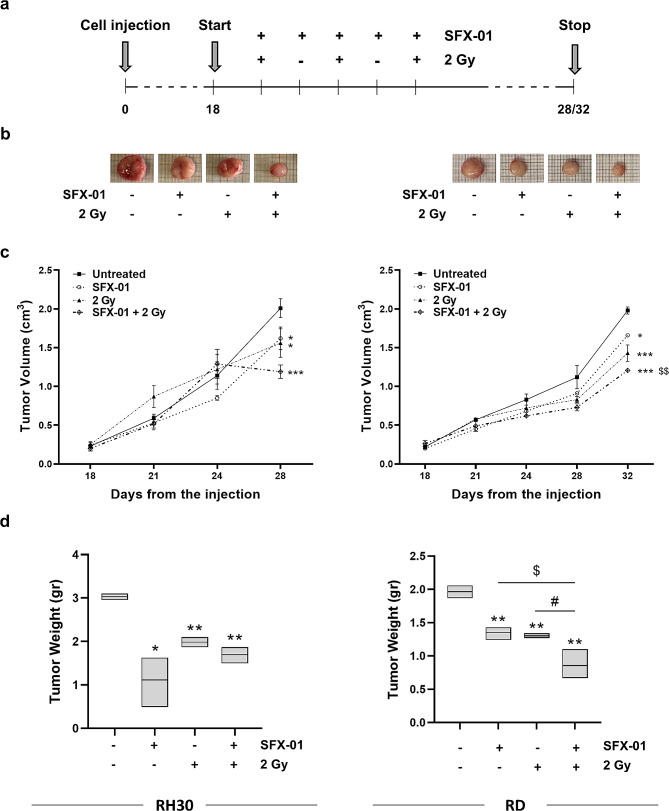
Results: SFX-01 treatment exhibited cytostatic and cytotoxic effects, mediated by G2 cell cycle arrest, apoptosis induction and suppression of autophagy. Moreover, SFX-01 was able to inhibit the formation and the proliferation of 3D tumorspheres as monotherapy and in combination with IR. Finally, SFX-01, when orally administered as single agent, displayed a pattern of efficacy at reducing the growth of tumour masses in RMS xenograft mouse models; when combined with a radiotherapy regime, it was observed to act synergistically, resulting in a more positive outcome than would be expected by adding each exposure alone.

Conclusions: In summary, our results provide evidence for the antitumour properties of SFX-01 in preclinical models of RMS tumours, both as a standalone treatment and in combination with irradiation. These forthcoming findings are crucial for deeper investigations of SFX-01 molecular mechanisms against RMS and for setting up clinical trials in RMS patients in order to use the SFX-01/IR co-treatment as a promising therapeutic approach, particularly in the clinical management of aggressive RMS disease.

Keywords: 3D tumorspheres; Cell cycle arrest; Oxidative stress; Radiotherapy; Rhabdomyosarcoma, SFX-01; Sulforaphane.


Conflict of interest statement

C.F. is a scientific advisor at Evgen Pharma. The other authors declare that they have no competing interests.

Figures

Fig. 1
Fig. 1
Proliferation and morphology evaluation in RMS cells exposed to SFX-01. (a) MTT assay performed on RH30 and RD cells treated for 72 h with increasing concentrations of SFX-01. Each point is the mean ± SD of two independent experiments each performed in sextuplicate. (b) Trypan blue assay showing RH30 and RD cell proliferation at 72 h post SFX-01 exposure (10 µM) expressed as fold increase over DMSO treated cells, arbitrarily set at 1. Histograms represent mean values ± SD of at least three independent experiments. Statistical analyses were performed by using Student’s t-test: ***, p < 0.001 vs. DMSO. Images showing the morphological assessment by Giemsa staining. Scale bar: 200 μm
Fig. 2
Fig. 2
Analysis of cell cycle progression in SFX-01 treated RH30 and RD cells. (a) Cell cycle distribution of RH30 (upper panels) and RD (lower panels) cells treated or not for 72 h with 10 µM SFX-01. Representative plots of FACS analysis; histograms showing the mean values of four independent experiments; tables reporting the mean values ± SD for each cell cycle phase. (b) Western blot assay of cyclin B1 and cyclin D1 in RMS cells exposed to 10 µM SFX-01 or DMSO. Tubulin expression was used as loading control. Representative blots of three independent experiments. Western blots were cropped to improve the conciseness of the results. The original Western blot images can be found in Supplementary File_uncropped. (c) Western blot analysis performed on nuclear (N) and cytoplasmic (C) protein extracts from RH30 and RD cells treated for 72 h with SFX-01. Lamin B1 was used as control for nuclear fraction, whilst β-actin for cytoplasmic control. Representative blots of two independent experiments. Western blots were cropped to improve the conciseness of the results. The original Western blot images can be found in Supplementary File_uncropped. (d) Western blot of several cell cycle inhibitors. Tubulin expression was used as loading control. Representative blots of three independent experiments. Western blots were cropped to improve the conciseness of the results. The original Western blot images can be found in Supplementary File_uncropped. (e) q-PCR analysis showing p21 mRNA levels in RH30 and RD cells exposed to SFX-01 expressed as fold increase over DMSO treated cells, arbitrarily set at 1. Transcript levels were normalised to GAPDH mRNA. Results are expressed as mean values ± SD of four independent experiments, each performed in triplicate. Statistical analyses were performed by using Student’s t-test: **, p < 0.01 vs. DMSO
Fig. 3
Fig. 3
Evaluation of SFX-01 effects on apoptosis in RH30 and RD cells. (a) Cytofluorimetric analysis of apoptotic process in RH30 (left panels) and RD (right panels) cells exposed to SFX-01 (10 µM) or DMSO. Plots representing a single experiment; histograms showing the mean values of three independent experiments; tables reporting the mean values ± SD of the different cell populations. (b) Relative expression of cleaved PARP protein shown by Western blot assay. Tubulin expression was used as loading control. Representative blots of two independent experiments. Western blots were cropped to improve the conciseness of the results. The original Western blot images can be found in Supplementary File_uncropped
Fig. 4
Fig. 4
Effect of SFX-01 treatment on autophagy, ROS production and antioxidant gene expression. (a) Western blot analysis of autophagic markers p62 and LC3-I/II in RH30 and RD cells at 72 h post SFX-01 treatment. Tubulin expression was used as internal control. Western blots were cropped to improve the conciseness of the results. Representative blots of four independent experiments. The original Western blot images can be found in Supplementary File_uncropped. (b) TEM analysis to monitor autophagy in RH30 and RD cells exposed to SFX-01 or DMSO. Autophagosomes, characterised by double membrane, and lysosomal structures are indicated by the red arrows. Autolysosomes were not detected. N: nucleus; M: mitochondria; PM: plasma membrane. (c) Cytofluorimetric analysis of total reactive oxygen species produced by RH30 (upper panel) and RD (lower panel) cells 48 h post SFX-01 pre-incubation. (d) NRF2 transcript levels and specific downstream targets analysed by q-PCR assay in RH30 (upper panel), and RD (lower panel) cells treated with 10 µM SFX-01. Results are expressed as fold increase over DMSO treated cells, arbitrarily set at 1. GAPDH mRNA level was used as endogenous control. Data are expressed as mean values ± SD of four independent experiments, each performed in triplicate. Statistical analyses were performed by using Student’s t-test: *, p < 0.05; **, p < 0.01 and ***, p < 0.001 vs. DMSO
Fig. 5
Fig. 5
Migration and invasion ability in RH30 and RD cells after SFX-01 treatment. Trans-well migration (a) and invasion (b) assays in RH30 and RD cells exposed to SFX-01 or DMSO. Histograms showing the fold increase over DMSO treated cells, arbitrarily set at 1. Statistical analyses were performed by using Student’s t-test: **, p < 0.01 and ***, p < 0.001 vs. DMSO. Scale bar: 400 μm. (c) Representative imagines of Wound healing assays in RH30 and RD cells at different time points after SFX-01 incubation. Scale bar: 800 μm
Fig. 6
Fig. 6
Assessment of RMS-derived spheroids after SFX-01 exposure. RH30 and RD cells were maintained in DMEM-F12 in ultra-low attachment plates and treated with 10 µM SFX-01 or DMSO. After 7 and 14 days, RH30 cells (a) and RD cells (d) were photographed for the evaluation of tumorsphere formation. Scale bar: 400 μm. Diameter, area and volume evaluation of RH30 (b) and RD (e) spheroids with AnaSP software. Histograms represent mean values ± SD of two independent experiments. Statistical analyses were performed by using Student’s t-test: *, p < 0.05, **, p < 0.01 and ***, p < 0.001 vs. DMSO at 7 days; #, p < 0.05; ##, p < 0.01 and ###, p < 0.001 vs. DMSO at 14 days. (c-f) Trypan blue assay showing the proliferation of rhabdospheres at 7- and 14-days post SFX-01 exposure (10 µM) expressed as fold increase over DMSO treated cells (7 days), arbitrarily set at 1. Histograms represent mean values ± SD of three independent experiments. Statistical analyses were performed by using Student’s t-test: *, p < 0.05; **, p < 0.01 and ***, p < 0.001 vs. DMSO at 7 days; ##, p < 0.01 vs. DMSO at 14 days
Fig. 7
Fig. 7
Evaluation of SFX-01 treatment on proliferation of RMS-derived spheroids. RH30 and RD cells maintained in DMEM-F12 in ultra-low attachment plates and treated with increasing concentration of SFX-01 or DMSO. After 7 days RH30 and RD cells were photographed (scale bar: 200 μm) and then were dissociated to assess cell vitality by trypan blue assay. Results were plotted as fold increase over DMSO treated cells, arbitrarily set at 1. Statistical analyses were performed by using Student’s t-test: *, p < 0.05 and **, p < 0.01 vs. DMSO
Fig. 8
Fig. 8
Evaluation of SFX-01/IR simultaneous treatment on clonogenic potential and proliferation of RMS cells. (a) Clonogenic ability of RH30 (upper panels) and RD (lower panels) cells treated or not with SFX-01 (10 µM) and exposed or not to IR (4 Gy). Representative pictures of colonies stained with crystal violet; histograms show the colony forming efficiency calculated by crystal violet absorbance from three independent experiments, each performed in triplicate. Each bar represents the means ± SD. Statistical analyses were performed by using two-way ANOVA: ***, p < 0.001 vs. DMSO/0 Gy; $$$, p < 0.001 vs. SFX-01/0 Gy; #, p < 0.05 and ##, p < 0.01 vs. DMSO/4 Gy. (b) MHDSA performed in RH30 (upper panel) and RD (lower panel) cells 11 days after the combined treatment by using Trypan blue dye exclusion test. Results were plotted as mean ± SD of two independent experiments. Statistical analyses were performed by using two-way ANOVA: ***, p < 0.001 vs. DMSO/0 Gy; $$, p < 0.01 and $$$, p < 0.001 vs. SFX-01/0 Gy; ##, p < 0.01 and ###, p < 0.001 vs. DMSO/4 Gy. (c) Histograms showing the cell cycle distribution of RH30 (left panel) and RD (right panels) cells pre-incubated with SFX-01 and exposed to IR. Mean values ± SD of each cell cycle phase of two independent experiments are reported in the tables. Western blot assay showing cyclin B1 up-regulation in RMS cells treated with SFX-01 and exposed to a single dose of 4 Gy. Tubulin expression was used as loading control. Representative blots of two independent experiments. Western blots were cropped to improve the conciseness of the results. The original Western blot images can be found in Supplementary File_uncropped
Fig. 9
Fig. 9
Analysis of specific markers of DNA damage and response pathway. γ-H2AX expression levels analysed by Western blot in RH30 and RD cells 48 h after SFX-01 treatment and 24 h post radiation exposure. Tubulin was used as loading control. Representative blots of three independent experiments. Western blots were cropped to improve the conciseness of the results. The original Western blot images can be found in Supplementary File_uncropped. Levels of phosphorylated and total form of DNA-PKcs and ATM analysed by automated Western blot (Protein Simple WES Western technology) in RMS cells after the simultaneous treatment. Vinculin was used as internal control. Representative images of two independent experiments
Fig. 10
Fig. 10
Spheroids formation in parental and clinically relevant radioresistant RMS cell lines. (a) Parental RH30 and RD cells and (b) radioresistant RH30 RR and RD RR cells maintained in DMEM-F12 in ultra-low attachment plates pre-treated with 10 µM SFX-01 or DMSO for 24 h and subsequently exposed or not to IR (4 Gy). After 14 days, cells were photographed for the evaluation of 3D spheroid formation. Scale bar: 400 μm. Lower panels showing the analysis of spheroid diameter, area and volume performed with AnaSP software on images acquired in two independent experiments. Bars represent the fold increase over DMSO/0 Gy sample, arbitrarily set at 1. Statistical analyses were performed by using two-way ANOVA: *, p < 0.05; **, p < 0.01 and ***, p < 0.001 vs. DMSO/ 0 Gy; #, p < 0.05, ##, p < 0.01 and ###, p < 0.001 vs. DMSO/4 Gy
Fig. 11
Fig. 11
Effect of SFX-01/irradiation co-treatment on tumour growth in mouse xenograft. (a) Diagram illustrating the experiment procedure. Treatment started 18 days from cell injection, when tumours reached an initial volume of about 0.2 cm3. Mice received SFX-01 or vehicle by mouth once daily for five consecutive days and were irradiated, or not, every other day with a single dose of 2 Gy. (b) Images of RH30 and RD untreated, SFX-01, IR and SFX-01 + IR tumours explanted from mice post euthanasia at the end of the experiment. (c) Growth curves of tumour volumes from RH30 and RD xenografts collected from untreated, SFX-01-treated, irradiated (2 Gy), or co-treated (SFX-01 + 2 Gy) mice. Each point is the mean ± SD of three mice per group. Statistical analyses were performed by using two-way ANOVA: *, p < 0.05, **, p < 0.01 and ***, p < 0.001 vs. untreated; $$, p < 0.01 vs. SFX-01. (d) Box plots showing tumour weights of RH30 and RD xenografts treated or not with SFX-01 and exposed or not to IR. Each box represents minimum to maximum and mean value of three mice per group. Statistical analyses were performed by using two-way ANOVA: *, p < 0.05 and **, p < 0.01 vs. untreated; $, p < 0.05 vs. SFX-01; #, p < 0.05 vs. 2 Gy

Similar articles

References

    1. Skapek SX, Ferrari A, Gupta AA, Lupo PJ, Butler E, Shipley J, et al. Rhabdomyosarcoma Nat Rev Dis Primers. 2019;5:1. doi: 10.1038/s41572-018-0051-2. - DOI - PMC - PubMed
    1. Dagher R, Helman L. Rhabdomyosarcoma: an overview. Oncologist. 1999;4:34–44. doi: 10.1634/theoncologist.4-1-34. - DOI - PubMed
    1. Parham DM, Barr FG. Classification of Rhabdomyosarcoma and its molecular basis. Adv Anat Pathol. 2013;20:387–97. doi: 10.1097/PAP.0b013e3182a92d0d. - DOI - PMC - PubMed
    1. Anderson J, Gordon A, Pritchard-Jones K, Shipley J. Genes, chromosomes, and rhabdomyosarcoma. Genes Chromosomes Cancer. 1999;26:275–85. doi: 10.1002/(SICI)1098-2264(199912)26:4<275::AID-GCC1>3.0.CO;2-3. - DOI - PubMed
    1. Barr FG. Gene fusions involving PAX and FOX family members in alveolar rhabdomyosarcoma. Oncogene. 2001;20:5736–46. doi: 10.1038/sj.onc.1204599. - DOI - PubMed

MeSH terms

Substances

LinkOut - more resources