. 2024 Aug;31(8):1237-1250.
doi: 10.1038/s41417-024-00795-3. Epub 2024 Jul 8.

Long-term severe hypoxia adaptation induces non-canonical EMT and a novel Wilms Tumor 1 (WT1) isoform

Affiliations

Long-term severe hypoxia adaptation induces non-canonical EMT and a novel Wilms Tumor 1 (WT1) isoform

Jordan Quenneville et al. Cancer Gene Ther. 2024 Aug.

Abstract

The majority of cancer deaths are caused by solid tumors, where the four most prevalent cancers (breast, lung, colorectal and prostate) account for more than 60% of all cases (1). Tumor cell heterogeneity driven by variable cancer microenvironments, such as hypoxia, is a key determinant of therapeutic outcome. We developed a novel culture protocol, termed the Long-Term Hypoxia (LTHY) time course, to recapitulate the gradual development of severe hypoxia seen in vivo to mimic conditions observed in primary tumors. Cells subjected to LTHY underwent a non-canonical epithelial to mesenchymal transition (EMT) based on miRNA and mRNA signatures as well as displayed EMT-like morphological changes. Concomitant to this, we report production of a novel truncated isoform of WT1 transcription factor (tWt1), a non-canonical EMT driver, with expression driven by a yet undescribed intronic promoter through hypoxia-responsive elements (HREs). We further demonstrated that tWt1 initiates translation from an intron-derived start codon, retains proper subcellular localization and DNA binding. A similar tWt1 is also expressed in LTHY-cultured human cancer cell lines as well as primary cancers and predicts long-term patient survival. Our study not only demonstrates the importance of culture conditions that better mimic those observed in primary cancers, especially with regards to hypoxia, but also identifies a novel isoform of WT1 which correlates with poor long-term survival in ovarian cancer.


Conflict of interest statement

The authors declare no competing interests.

Figures

Fig. 1
Fig. 1. Long-term severe hypoxia adaptation induces EMT-like morphological changes.
A The definitions of hypoxia and anoxia commonly used in the literature and their effect on HIF activity. B Confocal microscopy images of B16-HG cells under normal culture conditions (left), or after CoCl2 treatment (200 µM, 24 h). Scale bars: top = 20 µm; bottom = 10 µm. Green: HIF1α-GFP. Red: mCherry (cytoplasmic). C Definition of the Long-Term Hypoxia (LTHY) time course. D GFP levels of B16-HG cells over the course of the LTHY protocol. Numbers represent geometric Mean Fluorescent Intensity (geoMFI) of GFP signal. E B16-HG cell morphology under normal tissue culture conditions (left). B16-HG cell morphology after reaching the 0.3%O2 timepoint of the LTHY protocol (right). Scale bars: top = 100 µm; bottom = 50 µm. F Western blot (top) and analysis (bottom) of B16-HG harvested at indicated LTHY time points and probed for EMT-associated E-Cadherin (E-Cad), N-cadherin (N-Cad) and vimentin (Vim) and loading control calnexin (Caln). Band intensities were normalized to loading control. Data expressed as expression fold change relative to the 5%O2 condition.
Fig. 2
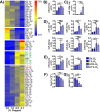
Fig. 2. Long-term hypoxia adaptation induces an miRNA signature linked to EMT.
A Hierarchically clustered heatmap of all differentially expressed (Benjamini-Hochberg adjusted p-value < 0.05 in the 5% vs 0.1% O2 comparison, and > 100 normalized DESeq2 reads in any condition) miRs, normalized to contribution to total expression in the dataset. Red denotes the classical hypoxia-induced miR, miR-210-3p. Green denotes EMT-promoting miRs miR-221/222. Blue and purple denote other miRs of interest. Heatmap clustered using WardD.2 hierarchical linkage metric, with the number of clusters chosen subjectively. B Expression values for miR-210-3p. C Expression values for miR-125b-1-3p. D Expression values for miRs of interest in cluster 4. E Expression values for miRs of interest in cluster 5. F, G Expression values for genes Cpeb1 and Sema6d. B, G Expression levels are DESeq2 normalized reads. * denotes relative significance as calculated by DESeq2 Benjamini-Hochberg adjusted p-value (padj). *padj < 0.05, **padj < 0.01, ***padj < 0.001.
Fig. 3
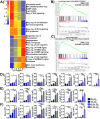
Fig. 3. Long-term hypoxia adaptation induces non-canonical EMT at the mRNA level.
A LTHY DEG k-means clustered heatmap. Gene expression normalized using row Z-score. Cluster number was determined using the elbow method. GO term enrichment was done using DAVID and cluster gene lists as input. Displayed GO terms are all significantly enriched (p < 0.05). B, C GSEA of LTHY 5% vs 0.1% DEGS. B Enrichment plot for Hallmark of Hypoxia. C Enrichment plot for Hallmark of Epithelial-Mesenchymal Transition. Normalized Enrichment Scores (NES) and statistical significance are found in each plot, as calculated by GSEA. D Expression values for genes associated with negative regulation of TGFβ and BMP signaling, and negative regulation of SMAD phosphorylation. E Expressions of EMT effector genes. F Expressions of potential EMT-driving genes. DF Values are DESeq2 normalized reads, error bars are SD. * denotes relative significance as calculated by DESeq2 Benjamini–Hochberg adjusted p-value (padj). *padj < 0.05, **padj < 0.01, ***padj < 0.001.
Fig. 4
Fig. 4. The long-term hypoxia adaptation induces novel truncated Wt1 mRNA transcripts from an intronic HRE-driven promoter.
A LTHY read coverage of the Wt1 locus, at 0.1% O2 of the LTHY time course, generated in IGV. Number ranges are coverage depths at the nucleotide level. Histogram is representative of replicates (n = 2, n2 shown). Introns 1–4 are condensed for visual clarity. B Transcription Factor Binding Site analysis of murine Wt1 intron 5 from beginning of intron 5 to beginning of RNAseq read coverage for Wt1. Only considered TFBSs with a score ≥ 0.95. Intron 5 sequence is broken into 40 bins, ~500 bp/bin. Analysis done using TFBStools in R. C FACS samples of the empty promoter-reporter construct, and the wild-type (WT) across the LTHY time course. Gate represents mCherry+ gate used for promoter activity calculations. FACS plots are representative of their triplicates. D Functional investigation into tWT1 promoter subregions. “Dist”: Distal region. “P1”: Proximal subregion 1. “P2”: Proximal subregion 2. “pT”: Poly-Thymine stretch. +: DNA region is present. −: DNA region is not present. M: DNA region has specific TFBSs scrambled. Promoter activity calculated using a ratio ZsGreen expression in transduced cells relative to untransduced cells, normalized to their normoxic counterparts. Significance calculated using 2-way ANOVA with Tukey’s multiple comparisons. Black stars represent intra-construct statistical comparisons; only reporting statistics relative to 5% O2. Blue stars represent significance relative to WT at 0.1% O2. Other comparisons are not shown for visual clarity. E Functional investigation into the P1 subregion of the tWt1 promoter at 0.1% O2. Promoter activity was calculated as in D. Statistics are a 2-way ANOVA with Tukey’s multiple comparisons test. Black stars represent statistical comparisons. Blue stars represent significance relative to WT at 0.1% O2. Other comparisons not shown for visual clarity. D, E “-“: an absence of subregion. “+“: presence of wild-type sequence. “M”: Transcription factor binding sites listed in Fig. S4F are scrambled. *p < 0.05. **p < 0.01. ***p < 0.001 ****p < 0.0001.
Fig. 5
Fig. 5. Novel truncated Wt1 transcripts encode efficiently translated proteins that accumulate in the nucleus.
A Splicing events observed in LTHY data. Percentages are the average between replicates, coverage depths are overlaid. B Potential open reading frames (ORFs) derived from the tWt1 intron 5 sequence in E7 isoforms. Purple: Intron 5 derived sequence. Orange: Exon 7 derived sequence. Bold: Canonical WT1 ORF (third ORF). Bright-green/dark-green: In/out of frame start codons. Red: Stop codons. C Possible tWt1 isoforms. Purple: Intronic sequence. Orange: Exonic sequence. Blue: KTS motif. D GFP levels of DOX-induced expression of tWT1-GFP isoforms in B16 cells. E Microscopy images of tWT1-GFP fusion constructs. Nuclear staining was performed using Hoechst 33342 (Thermo FIsher: H1399) as per the manufacturers protocol. F Western Blot of HEK cells expressing DOX inducible GFP or E7K-tWT1-GFP. Top: anti-Calnexin. Bottom: anti-GFP. G Mass Spectrometry (MS) coverage of E7K-tWt1 purified from HEK cells. Refer to the legend for full annotation.
Fig. 6
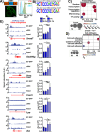
Fig. 6. Novel E7-tWT1 isoform retains DNA binding ability and is associated with genes involved in EMT.
A Left: top: schematic of cWt1 CDS. GFP was linked C-terminally as per the E7-GFP construct. Bottom: microscopy image of cWt1 under Dox induction. Right: GFP induction levels of cWt1 relative to E7-GFP. Induction was performed after 36 h of incubation at 0.5% O2, as per the LTHY protocol. All Dox inductions were performed at 2 µg/mL. B Known and de novo TF motif analysis of E7-K tWT1 ChIPseq data. The known motif p-value = 1e−78, is found in 36% of called peaks. The de novo motif p-value = 1e−105, motif is found in 30% of ChIPseq peaks. C, D Functional annotation bubbleplots of ChIPseq called peaks. E E7-tWT1 ChIPseq coverage and LTHY RNAseq expression profiles for genes of interest. cWt1 and input chromatin were used as negative controls. Black arrow denotes CDS start. * denotes relative significance as calculated by DESeq2 Benjamini-Hochberg adjusted p-value (padj). *padj < 0.05, **padj < 0.01, *** padj < 0.001.
Fig. 7
Fig. 7. Novel tWT1 transcripts are expressed in human cancers and are indicative of poor long-term survival in ovarian cancers.
A tWT1 expression in human melanoma cell lines undergoing LTHY as measured by qPCR. Expression presented as relative to fold change (FC) to the 5% O2 condition B tWT1 expression in ZR75 cells during LTHY incubation in the absence of estradiol (E2), relative to the 5% O2 timepoint. C Left: sunburst plot of Leucegene samples based on WT1 gene and isoform expression. Iso WT1 denotes the number of samples where WT1 isoform calling could be performed. Right: Breakdown of tWT1-G/P expression levels in tWT1 expressing Leucegene samples. Isoform calling was done using km and the isoform specific difference between G and P, using km’s Expectation-Maximization algorithm. D tWT1-GFP expression levels as determined by FACS in HEK293T cells. tWT1-GFP expression was induced by 2 µg/mL DOX for 36 hs at the 0.5% O2 timepoint of the LTHY protocol. E Left: Sunburst plot of TCGA-OV samples by WT1 isoform expression. Right: Breakdown of tWT1-G/P expression levels in tWT1-G/P expressing TCGA-OV samples. Isoform calling was done using km and the isoform-specific difference between G and P, using km’s Expectation-Maximization algorithm. F WT1 and tWT1 mRNA expression in human ovarian cancer cell line OVCAR3 after completing the LTHY adaptation, relative to normoxia. G RT-PCR of human tWT1 isoforms from normoxic OVCAR3 cDNA. H Delta-CT values calculated from OVCAR3 and TOV3291G cells in normoxic conditions using RPL10 as housekeeping gene to assess baseline expression. I WT1 and tWT1 mRNA expression in human ovarian cancer cell line TOV3291G after completing LTHY, relative to normoxia. Data presented as relative expression to normoxic condition, J Survival curve analyses for TCGA-OV (ovarian cancer) based on WT1 expression subsets. Left: Kaplan-Meier estimation survival curve of TCGA-OV samples, comparing samples which express any isoform of WT1 versus those with no WT1 expression. Curves are not significantly different (p = 0.26). Right: Kaplan-Meier estimation survival curve of TCGA-OV samples, comparing samples which express tWT1 isoforms (isoforms G or P) versus those which exclusively express canonical WT1 isoforms. Two-sided p-value of the whole curve is 0.12. Two-sided p-value of post-median data (126 observations) is 0.039. WT1 expression and isoform calling were determined by detection of exons 1, 1a, 2, 4, 7, and isoform G exon 1 by km.

Similar articles

References

    1. The Global Cancer Observatory, International Agency for Research on Cancer, World Health Organization. World Bank High Income Population Cancer Fact Sheet [Internet]. 2021 [cited 2023 Jun 27]. Available from https://gco.iarc.fr/today/data/factsheets/populations/986-high-income-fa....
    1. Ritchie H, Spooner F, Roser M Causes of Death. 2018 [cited 2023 Jun 27]. Causes of death. Available from: https://ourworldindata.org/causes-of-death.
    1. Roma-Rodrigues C, Mendes R, Baptista PV, Fernandes AR. Targeting tumor microenvironment for cancer therapy. Int J Mol Sci. 2019;20:840. 10.3390/ijms20040840 - DOI - PMC - PubMed
    1. Vaupel P, Mayer A. Hypoxia in cancer: significance and impact on clinical outcome. Cancer Metastasis Rev. 2007;26:225–39. 10.1007/s10555-007-9055-1 - DOI - PubMed
    1. Muz B, de la Puente P, Azab F, Azab AK. The role of hypoxia in cancer progression, angiogenesis, metastasis, and resistance to therapy. Hypoxia (Auckl). 2015;3:83–92. 10.2147/HP.S93413 - DOI - PMC - PubMed

LinkOut - more resources