. 2024 Sep;25(9):3870-3895.
doi: 10.1038/s44319-024-00195-6. Epub 2024 Jul 5.

The septin cytoskeleton is required for plasma membrane repair

Affiliations

The septin cytoskeleton is required for plasma membrane repair

M Isabella Prislusky et al. EMBO Rep. 2024 Sep.

Abstract

Plasma membrane repair is a fundamental homeostatic process of eukaryotic cells. Here, we report a new function for the conserved cytoskeletal proteins known as septins in the repair of cells perforated by pore-forming toxins or mechanical disruption. Using a silencing RNA screen, we identified known repair factors (e.g. annexin A2, ANXA2) and novel factors such as septin 7 (SEPT7) that is essential for septin assembly. Upon plasma membrane injury, the septin cytoskeleton is extensively redistributed to form submembranous domains arranged as knob and loop structures containing F-actin, myosin IIA, S100A11, and ANXA2. Formation of these domains is Ca2+-dependent and correlates with plasma membrane repair efficiency. Super-resolution microscopy revealed that septins and F-actin form intertwined filaments associated with ANXA2. Depletion of SEPT7 prevented ANXA2 recruitment and formation of submembranous actomyosin domains. However, ANXA2 depletion had no effect on domain formation. Collectively, our data support a novel septin-based mechanism for resealing damaged cells, in which the septin cytoskeleton plays a key structural role in remodeling the plasma membrane by promoting the formation of SEPT/F-actin/myosin IIA/ANXA2/S100A11 repair domains.

Keywords: Annexin A2; F-actin; Plasma Membrane Repair; Pore-forming Toxin; Septin.


Conflict of interest statement

The authors declare no competing interests.

Figures

Figure 1
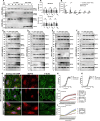
Figure 1. SEPT6 and SEPT7 are required for efficient plasma membrane repair.
(A) HeLa cells were transfected with non-targeting siRNA (Ctr. siRNA) or with siRNAs targeting SEPT6 and SEPT7 (Dataset EV1). After 72 h, cells were lysed and analyzed by SDS-PAGE and immunoblotting. Serial dilutions of Ctr. (100% to 6.25%) and undiluted septin siRNA-treated (100%) cell lysates were loaded in the gel to facilitate the quantification of the KD efficiencies. Blots are representative of at least 5 independent experiments (N = 5). KD efficiencies for SEPT6 were 39.5% ± 8.6; 3.6% ± 3.6; and 45.5% ± 12.5 for siRNA1, 2, and 3, respectively (average ± standard error of mean (SEM)). KD efficiencies for all SEPT7 siRNAs were >90%. (BD) Ctr. and SEPT-specific siRNAs treated cells were exposed to LLO (0.5 nM) for 30 min in M1 (1.2 mM Ca2+) (B, C) or M2 (Ca2+-free) (D), supplemented with TO-PRO-3. Data are the average TO-PRO-3 fluorescence intensities expressed in arbitrary units (AI) ± SEM of at least N = 3 independent experiments at time point 30 min. (E) Control HeLa cells and DiSEPT7-shRNA HeLa cells were cultured for 72 h in the presence (+) or in the absence (−) of Dox (50 μg/ml) and were tested for SEPT7 KD efficiency by immunoblotting. The presented blot is representative of N = 8 independent experiments with a KD efficiency of 88.75 ± 3.2% (Average ± SEM). (F) Control HeLa cells and DiSEPT7-shRNA1 HeLa cells were cultured for 72 h with or without DOX and then washed to remove the DOX. Cells were exposed, or not, to 0.5 nM LLO for 30 min in M1 or M2 supplemented with TO-PRO-3. Data are expressed as the average ratio of the TO-PRO-3 fluorescence intensity of DOX-treated over TO-PRO-3 fluorescence intensity of non-treated (Ctr.) cells (RDox/Ctr.) ± SEM of N = 5 independent experiments at time point 30 min. (G) HeLa cells were pre-treated with 100 μM FCF (in DMSO), vehicle DMSO, or untreated, C for 16 h. Cells were then subjected to the repair assay for 30 min with 0.5 nM LLO in M1 or M2 with TO-PRO-3. Due to FCF reversibility, FCF and DMSO were added to the buffers during the repair assay. Data are the average ± SEM of N = 2 independent experiments for the Ca2+-free condition and N = 4 independent experiments for 1.2 mM Ca2+ condition at 30 min. (H) HeLa cells were treated for 72 h with Ctr. siRNA or SEPT7-siRNA 1 and were exposed to PLY for 30 min in M1, supplemented with TO-PRO-3. Data are the average TO-PRO-3 fluorescence intensity expressed in arbitrary units (AI) ± SEM of N = 5 independent experiments at time point 30 min. (I) HeLa cells were transfected with Ctr. siRNA or ANXA2-siRNAs (Dataset EV1). After 72 h, cells were lysed. Control cell lysates (100%) and annexin A2 siRNA-treated cell lysates (100%) were loaded in the gel to facilitate the quantification of the KD efficiencies. The blot is representative of 6 independent experiments (N = 6, Average ± SEM) for ANXA2 siRNA 3, and N = 1 for ANXA2 siRNA 1 and siRNA 2. (J) Ctr.-, SEPT7-siRNA 1-, and ANXA2-siRNA 3-treated cells were mechanically wounded in M1 or M2 buffers. The number of Emerald cells were counted to represent the number of damaged cells and the number of Ruby cells that were originally green were counted to represent the number of not recovered cells. The data is expressed as the number of non-recovered cells (Ruby)/the number of Damaged cells (Emerald) which have been normalized to the Ca2+-free condition, %Max Damage ± SEM of N = 6 independent experiments. Data Information: TO-PRO-3 intensity was measured by fluorescence microscopy (B, F, H) or by spectrofluorometry (C, D, G). In (BD) and (FG), data were log10 transformed and analyzed using linear mixed-effects models and a Holm’s procedure was used to control for multiple comparisons in (B). (*P < 0.05, **P < 0.01, ***P < 0.001, and ****P < 0.0001). In (H) and (J), data were analyzed by a one-tailed Students Paired T-Test (*P < 0.05, **P < 0.01). Source data are available online for this figure.
Figure 2
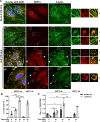
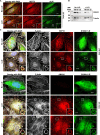
Figure 2. The septin cytoskeleton is remodeled in LLO-perforated cells.
HeLa cells were incubated without (No LLO) or with 0.5 nM LLO for 5–15 min in repair permissive buffer M1. Cells were fixed, permeabilized and fluorescently labeled with anti-septin primary Abs (Alexa Fluor 568-conjugated secondary), F-Actin (Alexa Fluor 488- or 647-conjugated phalloidin), and nuclei (DAPI). (A) Representative images at time point 15 min. Septin fluorescence images are presented with the same intensity scaling to visualize the partial dissociation of septin filaments from the actin stress fibers. Selected regions were magnified and the septin fluorescence display was artificially enhanced only in Abii to show that a portion of the septin cytoskeleton remains associated with actin stress fibers. Scale bars are 10 μm (Aa–d) and 2 μm in magnified images. Images were acquired by z-stack widefield microscopy, denoised, deconvolved, and presented as the best focus images, except for (Aa) and (Ab) which are single planes focused on actin stress fibers. Representative knob and loop structures are indicated by unfilled and filled arrowheads, respectively. (B) The percentage of cells with septin knobs and loops (%Cells with K + L) and (C) the average number of knobs or loops per total cells (N(K or L)/Total cell) were enumerated based on SEPT2 or SEPT7 fluorescence. A total of 300–750 cells were analyzed in each experimental condition, error bar show SEM of at least N = 3. Data were analyzed by a one-tailed Students Unpaired T-Test (*P < 0.05, **P < 0.01, ***P < 0.001, and ****P < 0.0001). Source data are available online for this figure.
Figure 3
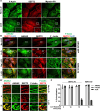
Figure 3. The septin cytoskeleton colocalizes with F-actin, myosin-IIA, and ANXA2 in LLO-perforated cells.
HeLa cells were incubated without (No LLO) or with 0.5 nM LLO for 5–15 min in repair permissive buffer M1. Cells were fixed, permeabilized and fluorescently labeled for SEPT2 (Alexa Fluor 568-conjugated secondary), myosin-IIA (Alexa Fluor 488-conjugated secondary), F-actin (Alexa Fluor 647-conjugated phalloidin), ANXA2 (Alexa Fluor 488-conjugated secondary), and nuclei (DAPI) for microscopy analyses. (A) Representative images of cells labeled for SEPT2, F-Actin, and myosin-IIA at time point 15 min. Scale bars are 10 μm or 1 μm in zoomed regions. (B, B’) HeLa cells were transiently transfected, or not, to express ANXA2-GFP. Representative images of cells labeled for SEPT2, F-Actin, and ANXA2 at time point 15 min. Scale bars are 10 μm in (B) and 2 μm in (B’). (B’) Enlarged regions from (B) to better visualize the septin colocalization with F-actin and ANXA2-GFP in both loop and non-loop regions. Fluorescence display was enhanced only in (B’ii). (A, B, B’) All images were acquired by z-stacks widefield microscopy, denoised, deconvolved, and presented as the best focus images. (C) The percentages of colocalization of the septins with ANXA2, F-actin, and ALIX were measured from a total of 300–750 cells in each experimental condition, N = 3, Average ± SEM for all SEPT2 Ab conditions. Source data are available online for this figure.
Figure 4
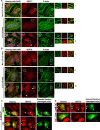
Figure 4. The septin cytoskeleton redistributes with F-actin and ANXA2 in close association with the plasma membrane.
(A, A’) HeLa cells were transiently transfected to express Lck-mTurquoise2 (Lck-mT2) and incubated with 0.5 nM LLO for 15 min in M1. Cells were fixed, permeabilized, and fluorescently labeled for SEPT2 (Alexa Fluor 568) and F-actin (Alexa Fluor 647). Widefield Z-stack was deconvolved and a single plane is presented. Scale bar is 10 μm. Arrows point to additional SEPT2, F-actin, and Lck colocalization. (Ai) and (Aii) are regions enlarged from (A), scale bars are 1 μm. (B) HeLa cells were exposed to 0.5 nM LLO, or not, for 15 min in M1 and were fixed, permeabilized, and fluorescently labeled for SEPT2 (Alexa Fluor 568-conjugated secondary), ANXA2 (Alexa Fluor 488-conjugated secondary), and F-actin (Alexa Fluor 647-conjugated phalloidin). Z-stack images were acquired by resonant scanning confocal microscopy with 0.1 μm steps. Images show the 3-D projection of the deconvolved overlay of SEPT2, F-actin, and ANXA2 displayed with a z-depth coding. (C, D, D’) FCF-treated cells were exposed to 0.5 nM LLO for 15 min in M1 and were fixed, permeabilized, and fluorescently labeled for SEPT2 (Alexa Fluor 568-conjugated secondary), ANXA2 (Alexa Fluor 488-conjugated secondary), and F-actin (Alexa Fluor 647-conjugated phalloidin). Images were acquired by spinning disk confocal microscopy. (C) A 3-D projection of all deconvolved images (44.99 μm × 56.07 μm × 3.4 μm) and overlayed with a z depth code. (D) A 3-D overlay of SEPT2, F-actin, and ANXA2. (D’) The overlay and individual channels of two selected loop structures with an optical depth of 1.4 μm (scale bar is 1 μm).
Figure 5
Figure 5. Septins form circular filaments intertwined with F-actin and connected to ANX A2.
(A) HeLa cells, pre-treated with 100 μM FCF, were incubated with 0.5 nM LLO for 15 min in M1. Cells were fixed, permeabilized, and fluorescently labeled for SEPT2 (Alexa Fluor 568-conjugated secondary), F-actin (Alexa Fluor 647-conjugated phalloidin), and nuclei (DAPI). 3-D representation of individual channels and 3-D overlay with depth coding of a denoised and deconvolved Z-stack acquired by resonant scanning confocal microscopy (106 μm × 106 μm × 5 μm), 0.2 μm step size. (Ai) Enlarged 3-D representations of (A) and its binary overlay. (B) HeLa cells were incubated with 0.5 nM LLO for 15 min in M1. Cells were fixed, permeabilized, and fluorescently labeled for SEPT2 (Alexa Fluor 568-conjugated secondary), ANXA2 (Alexa Fluor 647-conjugated secondary) and F-actin (ATTO 488-conjugated phalloidin). Images were acquired by super-resolution STORM microscopy (step size 0.2 μm). Each panel (Bi–iii) displays molecules detected within a 0.8 μm optical depth. Scale bar is 1 μm.
Figure 6
Figure 6. Redistribution of the septin cytoskeleton is functionally correlated with the plasma membrane repair efficiency.
(A) HeLa cells transfected with ANXA2-GFP were incubated with 0.5 nM LLO for 15 min in M1 or M2 buffers. Cells were fixed, permeabilized, and fluorescently labeled for SEPT2 (Alexa Fluor 568-conjugated secondary), F-actin (Alexa Fluor 647-conjugated phalloidin), and nuclei (DAPI). Scale bars are 10 μm. (B, C) Cells were treated as indicated in (A) and (D). The average number of septin knobs and loops per cell presenting these structures (N(K+ L)/Cell) Average ± SEM (B), and the percentage of cells presenting these structures (% Cells with K + L) Average ± SEM (C) were enumerated based on septin widefield fluorescence images. A total of 300–750 cells were analyzed in each experimental condition from duplicate wells, N = 3 independent experiments at minimum. (D) Control untreated, FCF (100 μM) pre-incubated, and vehicle DMSO pre-incubated HeLa cells were incubated with 0.5 nM LLO for 15 min in M1. Equivalent concentrations of FCF and DMSO were maintained during LLO exposure. Cells were fixed, permeabilized, and fluorescently labeled for SEPT2 (Alexa Fluor 568-conjugated secondary), F-actin (Alexa Fluor 647-conjugated phalloidin), and nuclei (DAPI). Z stack images were acquired by widefield microscopy and were denoised, deconvolved, and presented as best-focus projection images. Representative loops structures are indicated by filled arrowheads. Scale bars are 10 μm. Data Information: In (B and C), linear mixed-effects models were used for analysis, ****P < 0.0001. Source data are available online for this figure.
Figure 7
Figure 7. Redistribution of F-actin and ANXA2 is dependent on SEPT7 expression.
(A) HeLa cells transfected with Ctr. siRNA or SEPT7-siRNA 1 were incubated with 0.5 nM LLO for 15 min in M1. Cells were fixed, permeabilized, and labeled for SEPT2 (Alexa Fluor 568-conjugated secondary), F-Actin (Alexa Fluor 647-conjugated phalloidin), ANXA2 (Alexa Fluor 488-conjugated secondary), and nuclei (DAPI). Presented images are the best-focus projections generated from deconvolved widefield Z-stacks and are displayed with the same intensity scaling for each fluorescence setting. Representative loop structures are indicated by filled arrowheads. Scale bars are 10 μm. (Ai) and (Aii) are regions enlarged from (A), scale bars are 2 μm. (B) Same experiment as in (A) but cells were transfected with Ctr. siRNA, SEPT7-siRNA 1, or ANXA2-siRNA 3 and SEPT7 and SEPT9 were also labeled with fluorescent Abs. The number of knobs and loops per total cells (NK+L/Total cells) were enumerated based on F-actin labeling in cells fluorescently labeled with anti-SEPT2, -SEPT7, and -SEPT9 antibodies. A total of 150–300 cells were analyzed from duplicate wells, per experimental condition. For the SEPT2-labeled cells, N = 6 independent experiments for the Ctr.- and SEPT7-siRNA treated cells, N = 4 in the ANXA2-siRNA treated cells. N = 1 for SEPT7 and SEPT9 Ab labeling. (C) HeLa cells were transfected with Ctr. siRNA or with SEPT7-siRNA 1 and incubated with 0.5 nM LLO (+), or not (−), for 15 min in M1. Cells were fixed, permeabilized, and labeled for SEPT2 (Alexa Fluor 568-conjugated secondary), F-Actin (Alexa Fluor 647-conjugated phalloidin), ANXA2 (Alexa Fluor 488-conjugated secondary), and nuclei (DAPI). Fluorescence images (z-stacks) were acquired by widefield microscopy. The ANXA2 images were deconvolved and the number of ANXA2 specks were automatically counted in 3D by the software. At least 100 cells were analyzed for each experimental condition, N = 3 independent experiments. (D) HeLa cells were transfected with Ctr. siRNA or with ANXA2-siRNA 3 and incubated with 0.5 nM LLO, or not (Ctr.), for 15 min in M1. Cells were labeled indicated in (A). Data Information: In (A and D), the presented images are the best-focus projections from deconvolved z-stacks acquired by widefield microscopy and are displayed with the same intensity scaling for each fluorescence setting. Scale bars are 10 μm. In (B) and (C), data are expressed as average ± SEM and a one-tailed Students Paired T Test was used for analysis, *P < 0.05, **P < 0.01, and ****P < 0.0001. Source data are available online for this figure.
Figure EV1
Figure EV1. SEPT2 and SEPT9 silencing do not affect plasma membrane repair.
(A) HeLa cells were transfected with Ctr.-, SEPT2-, or SEPT9-siRNAs (Dataset EV1). After 72 h, cells were lysed and analyzed by SDS-PAGE and immunoblotting for septin and tubulin expression. Serial dilutions of control- (100% to 6.25%) and undiluted septin- (100%) siRNA treated cell lysates were loaded in the gel to facilitate the quantification of the KD efficiencies. Blots are representative of at least N = 5. KD efficiencies were >90%. (A’) HeLa cells were treated for 72 h with Ctr. or SEPT-siRNAs and were exposed to LLO (0.5 nM) for 30 min in M1 containing TO-PRO-3. Data are the average TO-PRO-3 fluorescence intensities expressed in arbitrary units (AI) ± SEM of at least N = 3 independent experiments at time point 30 min. (B) HeLa cells were exposed, or not, to 0.5 nM LLO in M1 or M2 for 5 min on ice to allow LLO to bind the plasma membrane. Cells were washed and warmed up to 37 °C for 5, 10, 15, 30 min, 2 h, and 24 h. In the last min of incubation, cells were exposed for 1 min to 100 µM propidium iodide. About 1300 cells were analyzed per experimental condition and data are expressed as the average nuclear Propidium Iodide fluorescence intensities expressed in arbitrary units (AI) ± SEM of at least N = 3 independent experiments. N = 4 independent experiments for the 5-30 min conditions. Data show that plasma membrane integrity is recovered fully between 30 min to 2 h, at the whole population level. (CF) HeLa cells were transfected with Ctr.- or SEPT-siRNAs as in (A). Blots are representative of at least N = 5. (E) Comparing control siRNA-treated cells to SEPT7-siRNA-treated cells, SEPT6 expression was reduced by 44.8% ± 24.4; 70% ± 21.2; and 52.3% ± 19.6 for siRNA1, 2, and 3, respectively, SEPT2 expression was reduced by 59.6% ± 4.3; 46.4% ± 7.7; and 40.1% ± 6.9 for siRNA1, 2, and 3, respectively. SEPT 9 expression was reduced by at least 90% for all three siRNAs. KD of SEPT2, 6, and 9 did not appear to affect the expression of the other tested septins. (G) HeLa cells were transfected with non-targeting Ctr. siRNA, SEPT7-siRNA 1, or SEPT2-siRNA 2. Cells were incubated without LLO for 15 min in M1 (1.2 mM Ca2+), fixed, permeabilized, and labeled with anti-SEPT9 primary Ab (and Alexa Fluor 568-conjugated secondary), F-actin (Alexa Fluor 488-conjugated phalloidin), and nuclei (DAPI). Z-stack images were acquired by widefield microscopy, denoised, deconvolved, and displayed as best-focus projection images. Scale bars: 10 μm. (H) The hemolytic assay showing that the presence of DOX at the indicated concentrations does not affect LLO pore formation (N = 3 independent experiments, Average ± SEM). Note that in the repair assay, DOX-treated cells were washed three times, so only traces of DOX were present in the medium during the repair assay. (I, J) HeLa cells were pre-treated with the indicated concentrations of FCF, or corresponding DMSO dilutions, or left untreated (Ctr.) for 16 h. Equivalent concentrations of FCF and DMSO were maintained in the buffer during the repair assay. Cells were exposed to LLO for 30 min in M1 or M2 supplemented with TO-PRO-3. Data are expressed as the average TO-PRO-3 fluorescence intensities in arbitrary unit of N = 2 to N = 4 (each with 4 to 8 technical replicates) ± SEM at each time point. (K) The hemolytic assay showed that FCF at the highest concentration does not affect LLO pore formation (N = 3 independent experiments, Average ± SEM). Data Information: (A’, B) Data were log10 transformed and analyzed using linear mixed-effects models. *P < 0.05.
Figure EV2
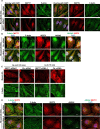
Figure EV2. The septin cytoskeleton is remodeled in LLO-perforated and mechanically-wounded cells.
HeLa cells were incubated without (No LLO) or with 0.5 nM LLO for 5–15 min in M1. Cells were chemically fixed, permeabilized, and fluorescently labeled with anti-SEPT9, or SEPT7, or SEPT2 primary Abs (Alexa Fluor 568-conjugated secondary), F-Actin (Alexa Fluor 488-conjugated phalloidin), and nuclei (DAPI). (A, B) SEPT7 (A) and SEPT9 (B) fluorescence images are presented with the same intensity scaling showing the loss of septin association with actin stress fibers. To better visualize septin and actin filaments, selected regions were enlarged (Aai, Abi, Aci,ii, Bai, Bbii, Bciii) and the septin fluorescence display was the same for all images except for Abi and Bbii which intensity was amplified. All images were acquired by z-stack widefield microscopy, deconvolved, and presented as the best focus images, except for Aa, Ab, Ba, and Bb images which are single planes focused on actin stress fibers. Representative septin knob and loop structures are indicated by unfilled and filled arrowheads, respectively. Scale bars are 10 μm and 2 μm in the enlarged images (C, D) HeLa cells, pre-treated with 100 μM FCF, with vehicle DMSO (C) or untreated (D), were mechanically wounded in M1 (2 mM Ca2+) or M2 (Ca2+- Free) medium in the presence of Emerald Dextran to identify the sites of cell wounding. Cells were washed, fixed, permeabilized and fluorescently labeled with anti-septin primary Abs (Alexa Fluor 647-conjugated secondary), and nuclei (DAPI). All images were acquired by z-stacks widefield microscopy, denoised, deconvolved, and presented as the best focus images. Scale bars are 10 μm. Filled arrowheads point to remodeled septin structures.
Figure EV3
Figure EV3. The septin cytoskeleton redistributes with S100A11.
(A) Cells were fluorescently labeled for SEPT2 (Alexa Fluor 568-conjugated secondary), ALIX (Alexa Fluor 488-conjugated secondary), and nuclei (DAPI) at time point 15 min. (B) HeLa cells were exposed, or not, to 0.5 nM LLO for 15 min in M1. Cells were lysed and analyzed by SDS-PAGE and immunoblotting to measure ANXA2 expression level. Serial dilutions (100% to 25%) of cell lysates were loaded in the gel (representative of N = 3 independent experiments) and tubulin was used as loading control. Data showed that ANXA2 expression was not increased under LLO treatment. (C) HeLa cells were fluorescently labeled for SEPT2 (Alexa Fluor 568-conjugated secondary), F-Actin (Alexa Fluor 488-conjugated phalloidin), ANXA2 (Alexa Fluor 647-conjugated secondary), S100A11 (either anti-mouse (-M) Alexa Fluor 647-conjugated secondary or anti-rabbit (-R) Alexa Fluor 568-conjugated secondary) and nuclei (DAPI) at time point 15 min. Data Information: In (A and C), all images were acquired by z-stacks widefield microscopy, denoised, deconvolved, and presented as the best focus images except (A) which are single planes. Scale bars are 10 μm or 2 μm in zoomed-in regions.
Figure EV4
Figure EV4. Organization of the septin and actin cytoskeletons in FCF- and DMSO-pre-treated control cells.
Untreated, FCF (100 μM) pre-treated, and vehicle DMSO pre-treated HeLa cells were incubated without LLO (No LLO) for 15 min in M1. Cells were fixed, permeabilized, and fluorescently labeled for SEPT2 (Alexa Fluor 568-conjugated secondary Abs), F-actin (Alexa Fluor 647-conjugated phalloidin), and nuclei (DAPI). Z-stack images were acquired by widefield microscopy and were denoised, deconvolved, and presented as best-focus projection images. Scale bars are 10 μm.
Figure EV5
Figure EV5. Myosin-IIA redistribution is SEPT7-dependent.
(AD) HeLa cells were transfected with Ctr. siRNA, SEPT7-siRNA 1 (AC), or ANXA2-siRNA 3 (D) for 72 h. Cells were incubated with (C) or without (AD) LLO for 15 min in M1. Cells were fixed, permeabilized, and labeled with SEPT Ab (Alexa Fluor 568-conjugated secondary), F-Actin (Alexa Fluor 488-conjugated phalloidin), nuclei (DAPI), (B, D) ANXA2 (Alexa Fluor 647-conjugated secondary) and (C) Myosin IIA (Alexa Fluor 568-conjugated secondary). Scale bars: 10 μm. Data Information: (BD) Z-stack images were acquired by widefield microscopy, denoised, deconvolved, and displayed as best-focus projection images, except for (A) which are single-plane images focused on actin stress fibers.

Update of

Similar articles

Cited by

References

    1. Andrade LO (2019) Plasma membrane repair involvement in parasitic and other pathogen infections. Curr Top Membr 84:217–238 10.1016/bs.ctm.2019.08.002 - DOI - PubMed
    1. Angelis D, Karasmanis EP, Bai X, Spiliotis ET (2014) In silico docking of forchlorfenuron (FCF) to septins suggests that FCF interferes with GTP binding. PLoS ONE 9:e96390 10.1371/journal.pone.0096390 - DOI - PMC - PubMed
    1. Atanassoff AP, Wolfmeier H, Schoenauer R, Hostettler A, Ring A, Draeger A, Babiychuk EB (2014) Microvesicle shedding and lysosomal repair fulfill divergent cellular needs during the repair of streptolysin O-induced plasmalemmal damage. PLoS ONE 9:e89743 10.1371/journal.pone.0089743 - DOI - PMC - PubMed
    1. Ayyar BV, Ettayebi K, Salmen W, Karandikar UC, Neill FH, Tenge VR, Crawford SE, Bieberich E, Prasad BVV, Atmar RL et al (2023) CLIC and membrane wound repair pathways enable pandemic norovirus entry and infection. Nat Commun 14:1148 10.1038/s41467-023-36398-z - DOI - PMC - PubMed
    1. Banerji R, Karkee A, Kanojiya P, Saroj SD (2021) Pore-forming toxins of foodborne pathogens. Compr Rev Food Sci Food Saf 20:2265–2285 10.1111/1541-4337.12737 - DOI - PubMed

LinkOut - more resources