. 2024 Jul 4;14(1):105.
doi: 10.1038/s41408-024-01090-y.

Patient-specific computational models predict prognosis in B cell lymphoma by quantifying pro-proliferative and anti-apoptotic signatures from genetic sequencing data

Affiliations

Patient-specific computational models predict prognosis in B cell lymphoma by quantifying pro-proliferative and anti-apoptotic signatures from genetic sequencing data

Richard Norris et al. Blood Cancer J. .

Abstract

Genetic heterogeneity and co-occurring driver mutations impact clinical outcomes in blood cancers, but predicting the emergent effect of co-occurring mutations that impact multiple complex and interacting signalling networks is challenging. Here, we used mathematical models to predict the impact of co-occurring mutations on cellular signalling and cell fates in diffuse large B cell lymphoma and multiple myeloma. Simulations predicted adverse impact on clinical prognosis when combinations of mutations induced both anti-apoptotic (AA) and pro-proliferative (PP) signalling. We integrated patient-specific mutational profiles into personalised lymphoma models, and identified patients characterised by simultaneous upregulation of anti-apoptotic and pro-proliferative (AAPP) signalling in all genomic and cell-of-origin classifications (8-25% of patients). In a discovery cohort and two validation cohorts, patients with upregulation of neither, one (AA or PP), or both (AAPP) signalling states had good, intermediate and poor prognosis respectively. Combining AAPP signalling with genetic or clinical prognostic predictors reliably stratified patients into striking prognostic categories. AAPP patients in poor prognosis genetic clusters had 7.8 months median overall survival, while patients lacking both features had 90% overall survival at 120 months in a validation cohort. Personalised computational models enable identification of novel risk-stratified patient subgroups, providing a valuable tool for future risk-adapted clinical trials.


Conflict of interest statement

The authors declare no competing interests.

Figures

Fig. 1
Fig. 1. Computational modelling of the cell cycle and apoptosis reveal limited impact of archetypal double hit mutations on their respective molecular networks.
AC Apoptosis model simulations. DF Cell cycle model simulations. A Schematic of the apoptosis model leading to cleavage of PARP. Green border: pro-apoptotic regulator, red border: anti-apoptotic regulator, bold black: fate-determining species in the model. B (top) The percentage of cleaved PARP over time for two simulations (WT and BCL2 overexpressed) using the apoptosis model. There is a delay in PARP cleavage in the presence of overexpressed BCL2. B (bottom) Increasing time to death for cells with increasing BCL2 expression. C Graph showing distribution of time to death in a simulation of 1000 cells, unmutated (black) compared to 1.5-fold BCL2 upregulation (green). D Schematic of the impact of cMyc on the cell cycle model. Green border: pro-apoptotic regulator, red border: anti-apoptotic regulator, bold black: fate-determining species in the model. E (top) Output of the abundancies of different cell cycle proteins run to a limit cycle for a WT cell (solid line) and a cell in which MYC is overexpressed (dotted line) showing a slight shortening of the cell cycle for some. CycA/D/E = Cyclin A/D/E, Cdh1 = cdc20 homologue 1. E (bottom) Time for completion of cell cycle phases for cells with varying MYC expression showing the main effect is in G1. F Distribution of time to cell division for simulations of heterogeneous populations of 1000 cells. Unmutated (black) compared to 1.5-fold MYC upregulation (green) show very little difference. G Number of cells, from the simulations in (F), for which the cell cycle has arrested in unmutated cells and cells in which MYC is upregulated 1.5-fold. Upregulated MYC substantially reduces the number of cells in cell cycle arrest.
Fig. 2
Fig. 2. Multi-scale modelling of mutations in subsets of DLBCL and Multiple Myeloma recapitulates clinical trial data.
A (left) Simplified schematic model divided into component signalling pathways featuring NF-κB signalling, apoptosis, the cell cycle and differentiation (adapted from ref. 11), full details provided in Supplementary Material. A (right) Schematic representation of the progression of cell lineages over time during multiscale simulations. The example depicts a mutation that allows cells to continue to proliferate when they would otherwise die. B, C Simulated cell population size (cell count) over time for wild-type (blue), individual mutations (orange and red) and double hits where both mutations are combined (green). D Overall survival (OS) data for groups of patients with MYC and BCL2/BCL6 mutations. E Cell population size (cell count) over time for simulations of gain1q multiple myeloma. CKS1B and MCL1 are located on chromosome 1q and therefore amplifications in this chromosome increase the abundance of both of these genes. F Progression-free survival (PFS) data for groups of patients with upregulation of CKS1B and MCL1 due to 2, 3 or 4 or more copies of chromosome 1q. NR not reached.
Fig. 3
Fig. 3. Multiple mutations can create anti-apoptotic and pro-proliferative signalling.
A Abundance of MYC mRNA (left) and BCL2 (right) mRNA in simulations of wild-type (WT) (dash), an IKK-activating mutation (green), a BCL2-activating mutation (blue) and a MYC-activating mutation (orange) over time. Note that BCL2 mRNA is elevated at t = 0 as the model transitions from steady state phase (with enforced survival signal) to the dynamic phase (with dynamically-determined survival signal). B Changes in the abundance of Cdh1 protein at 6 h in the simulations from (A). Each simulated concentration is subtracted from the WT simulation and plotted on a log scale as either an increase or decrease in abundance. Note that both MYC and IKK activating mutations decrease Cdh1 indicating a more rapid transition from G1 to S phase. C Changes in the abundance of cCytoc (cytoplasmic cytochrome c, left) protein, and cSmac (cytoplasmic second mitochondria-derived activator of caspase, right) at 6 h in the simulations from (A). Each simulated concentration is subtracted from the WT simulation and plotted on a log scale as either an increase or decrease. Note that both BCL2 and IKK activating mutations decrease both cSmac and cCytoc indicating reduced apoptotic signalling. D Pipeline to incorporate mutational events from genetic sequencing to create patient-specific models. Example mutational mappings are shown, including the model parameters they modify. The full mapping is provided on in the Github repository (https://github.com/SiFTW/norrisEtAl/blob/main/muts2Params.csv). E Violin plot showing the concentration of Cdh1 in individual patient simulations created as shown in (D). Each abundance is standardised and displayed as a z-score. The region with below mean abundance of Cdh1 is highlighted in green and labelled as PP (pro-proliferative), with example patients highlighted that are within and outside this region. F Concentration of cSmac (left) and cCytoC (right) in individual patient simulations created as shown in (D). Each abundance is standardised and displayed as a z-score. The region with below mean abundance of each protein is highlighted in blue and labelled as PP (pro-proliferative), with example patients highlighted that are within and outside this region. Note that patient 1 (LS3593) is neither AA or PP, 2 (RICOVER_977) is only AA, 3 (RICOVER_126) is AAPP, and 4 (LS2305) is PP only.
Fig. 4
Fig. 4. Patient-specific modelling and stratification by pro-proliferation and anti-apoptotic species predicts prognosis of DLBCL patients.
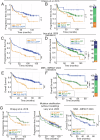
Kaplan-Meier (KM) plots were generated using modelling of patient data derived from Chapuy et al. (A, B), and then validated using Lacy et al. (C, D), and the MSK IMPACT cohort (E-F). A KM plot comparing progression-free survival (PFS) for DLBCL patients classified as simultaneously anti-apoptotic (AA) and pro-proliferative (PP)(AAPP) or not (Other), using personalised simulations. B KM plot comparing PFS for DLBCL patients classified as simultaneously anti-apoptotic and pro-proliferative (AAPP, prange), only one of AA or PP (green), or neither (Other, blue), using personalised simulations. The proportion of patients in each group is shown on the right. KM plots generated the same way as (A, B) using patients from ref. [8], stratified using AAPP alone (C), AA and/or PP (D). KM plots generated the same way as (AC) using patients from the MSK IMPACT Heme cohort (2024), stratified using AAPP alone (E), AA and/or PP (F). G KM plots, generated without modelling in the indicated cohorts, comparing PFS/OS for patients with at least one mutation mapping to each of the cell cycle and apoptotic networks (AAPP, orange), with at least one mutation mapping to either the AA or PP network but not both (AA or PP, green), and patients who don’t have a mutation that maps to either AA or PP signalling networks (Other, blue). Significance values from log rank test indicated as follows: * P ≤ 0.05, ** P ≤ 0.01, *** P ≤ 0.001.
Fig. 5
Fig. 5. Computational modelling identifies poor prognosis patients in all cell-of-origin and genetic groupings and can be combined with multiple establish prognostic metrics to reliably stratify patients.
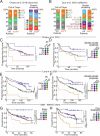
A Grouped bar plot showing the percentage of AAPP and non-AAPP patients in each cell-of-origin (left) genetic cluster from Chapuy et al. [7] (right). C1-5 = cluster 1 to 5 as assigned in the original publicaiton. B Grouped bar plot showing the percentage of AAPP and non-AAPP patients in each cell-of-origin (left) genetic cluster from Lacy et al. 2020 [8] (right). Cluster names maintained from Lacy et al. Kaplan-Meier analysis of progression-free survival (PFS) in patients from Chapuy et al. (C) and Lacy et al (E) stratified into: low IPI and neither AA or PP signalling (blue), low IPI with one or more AA/PP signalling states (purple), high IPI without AAPP signalling (green), high IPI with simultaneous AAPP signalling (orange). Kaplan-Meier analysis of PFS in patients from Chapuy et al. (D) and Lacy et al. (F) stratified into: good-prognosis genetic cluster and neither AA or PP signalling (blue), good-prognosis genetic cluster with one or more AA/PP signalling states (purple), poor-prognosis genetic cluster without AAPP signalling (green), poor-prognosis genetic cluster with simultaneous AAPP signalling (orange). G Kaplan-Meier analysis of overall survival in DLBCL patients from the Memorial Sloan Kettering (MSK) IMPACT - Heme cohort stratified into: stage ≤ 3 with neither AA or PP signalling (blue), stage ≤ 3 with one or more AA/PP signalling states (purple), stage 4 without AAPP signalling (green), stage 4 with simultaneous AAPP signalling (orange). H Kaplan-Meier analysis of overall survival in DLBCL patients from the MSK IMPACT - Heme cohort stratified into: no prior treatment with neither AA or PP signalling (blue), no prior treatment with one or more AA/PP signalling states (purple), treatment prior to arrival at MSK without AAPP signalling (green), treatment prior to arrival at MSK with simultaneous AAPP signalling (orange). ABC Activated B Cell, GCB Germinal Centre B cell, N/A no data available, UNC unclassified, NEC Not Elsewhere Classified, IPI International Prognostic Index, Stage = International Classification of Diseases for Oncology staging. Poor prognosis clusters in Chapuy et al: 2, 3 and 5. Poor prognosis clusters in Lacy et al: BCL2, MYD88, NEC, NOTCH2. Low IPI: 1–3 Chapuy et al. and ‘Low’ to ‘Low/Intermediate’ Lacy et al. Significance values from log rank test indicated as follows: * P ≤ 0.05, ** P ≤ 0.01, *** P ≤ 0.001, **** P ≤ 0.0001.

Similar articles

References

    1. Maura F, Bolli N, Angelopoulos N, Dawson KJ, Leongamornlert D, Martincorena I, et al. Genomic landscape and chronological reconstruction of driver events in multiple myeloma. Nat Commun. 2019;10:3835. doi: 10.1038/s41467-019-11680-1. - DOI - PMC - PubMed
    1. Mosquera Orgueira A, Ferreiro Ferro R, Díaz Arias J, Aliste Santos C, Antelo Rodríguez B, Bao Pérez L, et al. Detection of new drivers of frequent B-cell lymphoid neoplasms using an integrated analysis of whole genomes. PLoS One. 2021;16:e0248886. doi: 10.1371/journal.pone.0248886. - DOI - PMC - PubMed
    1. Cheah C, Herbert K, O’rourke K, Kennedy GA, George A, Fedele P, et al. A multicentre retrospective comparison of central nervous system prophylaxis strategies among patients with high-risk diffuse large B-cell lymphoma. Br J cancer. 2014;111:1072–9. doi: 10.1038/bjc.2014.405. - DOI - PMC - PubMed
    1. Hartert KT, Wenzl K, Krull JE, Manske M, Sarangi V, Asmann Y, et al. Targeting of inflammatory pathways with R2CHOP in high-risk DLBCL. Leukemia. 2021;35:522–33. doi: 10.1038/s41375-020-0766-4. - DOI - PMC - PubMed
    1. Sehn LH, Salles G. Diffuse Large B-Cell Lymphoma. N. Engl J Med. 2021;384:842–58. doi: 10.1056/NEJMra2027612. - DOI - PMC - PubMed

Publication types