. 2024 Jul 4:13:e84798.
doi: 10.7554/eLife.84798.

Hsp47 promotes biogenesis of multi-subunit neuroreceptors in the endoplasmic reticulum

Affiliations

Hsp47 promotes biogenesis of multi-subunit neuroreceptors in the endoplasmic reticulum

Ya-Juan Wang et al. Elife. .

Abstract

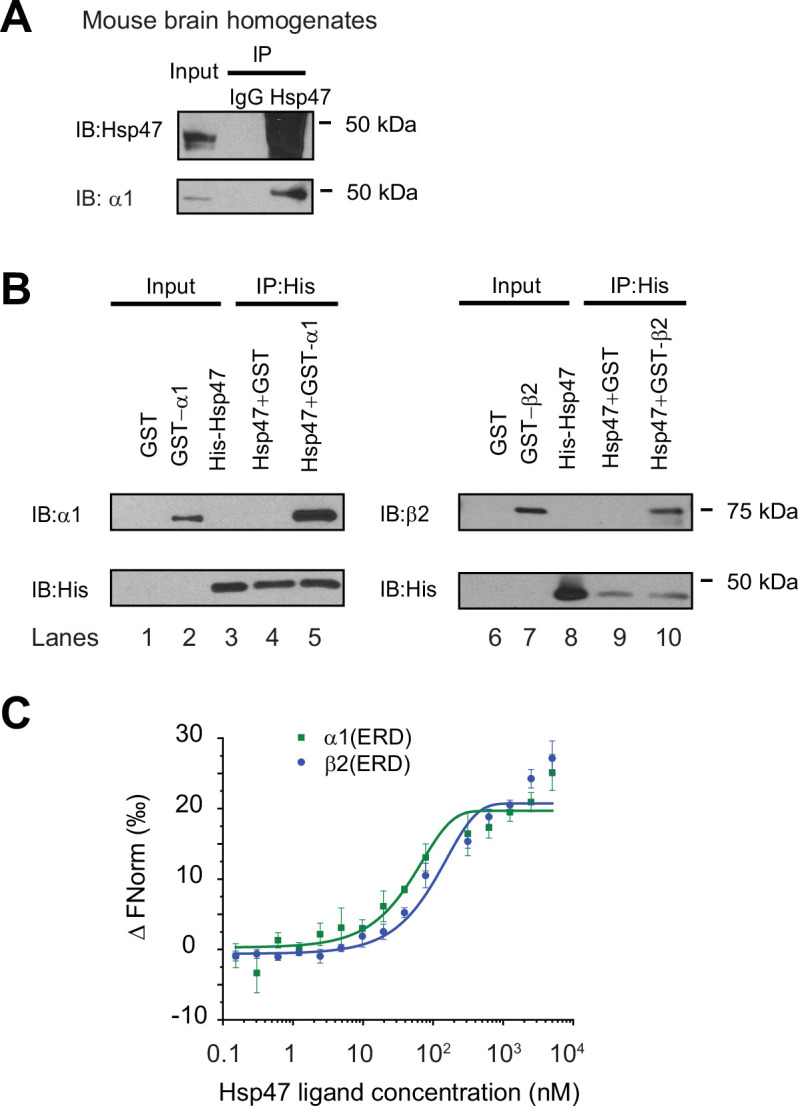
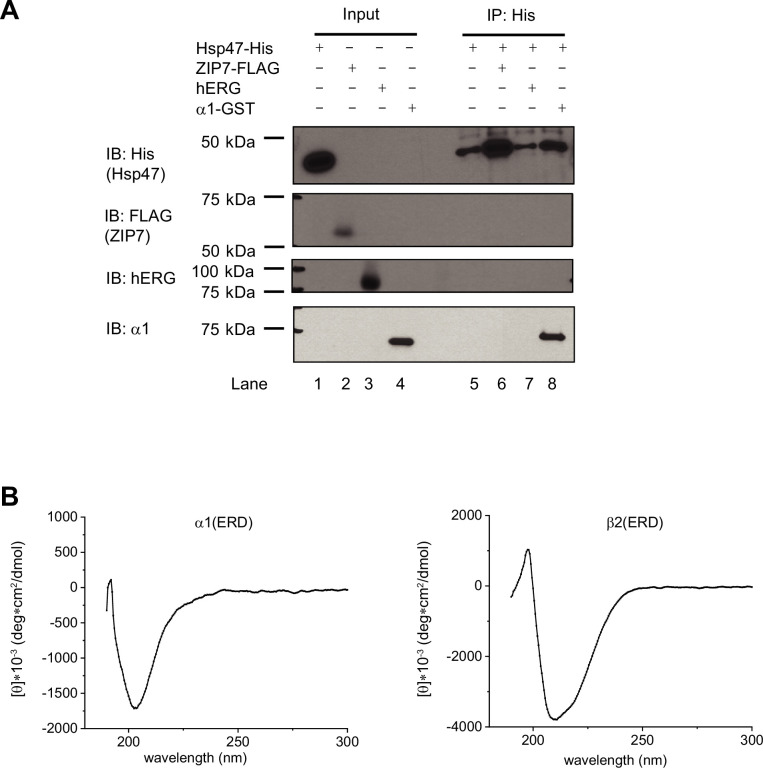
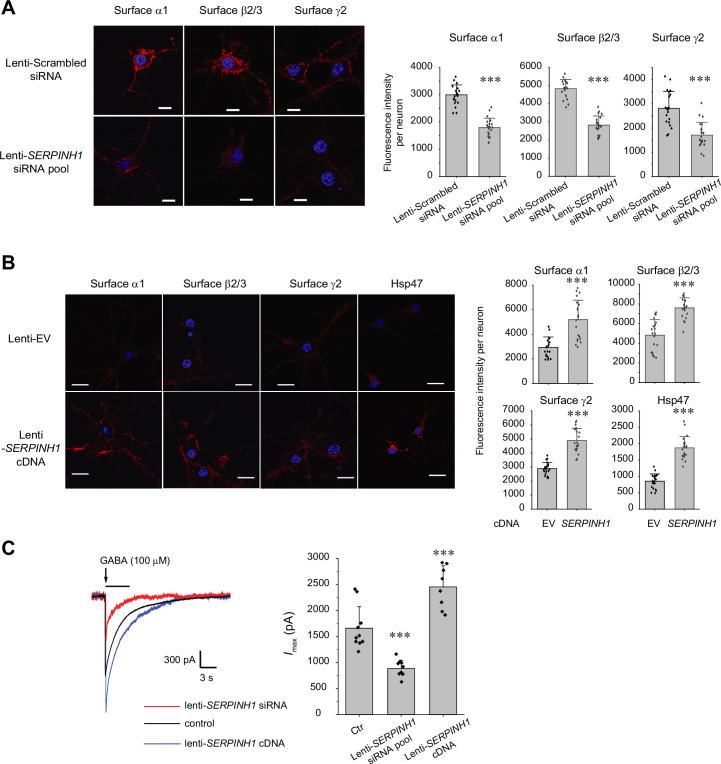
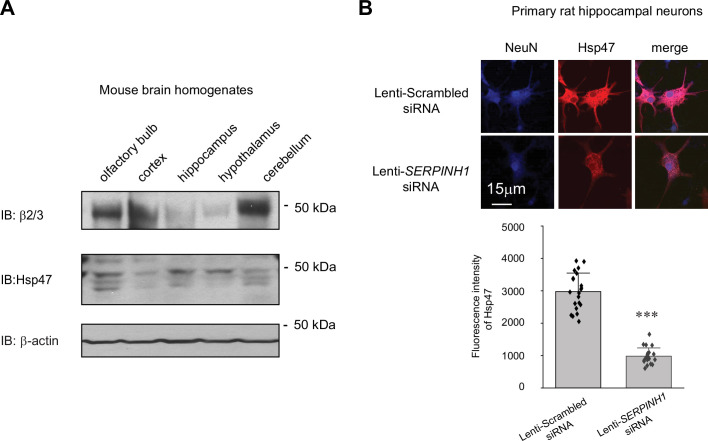
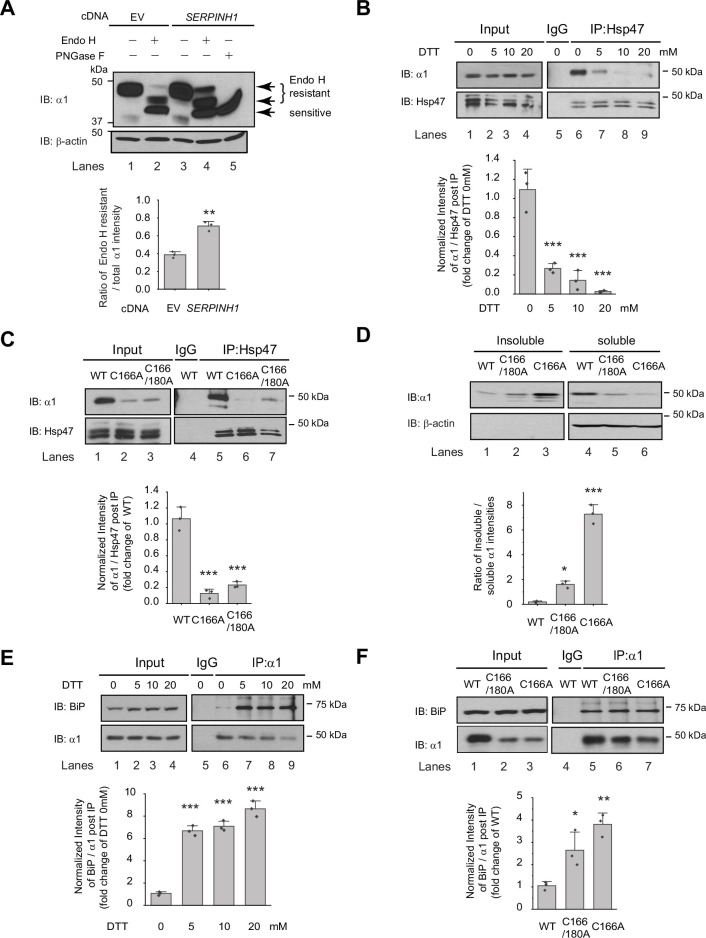
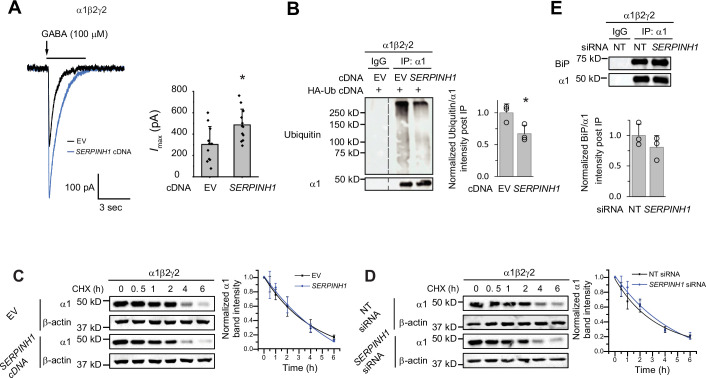
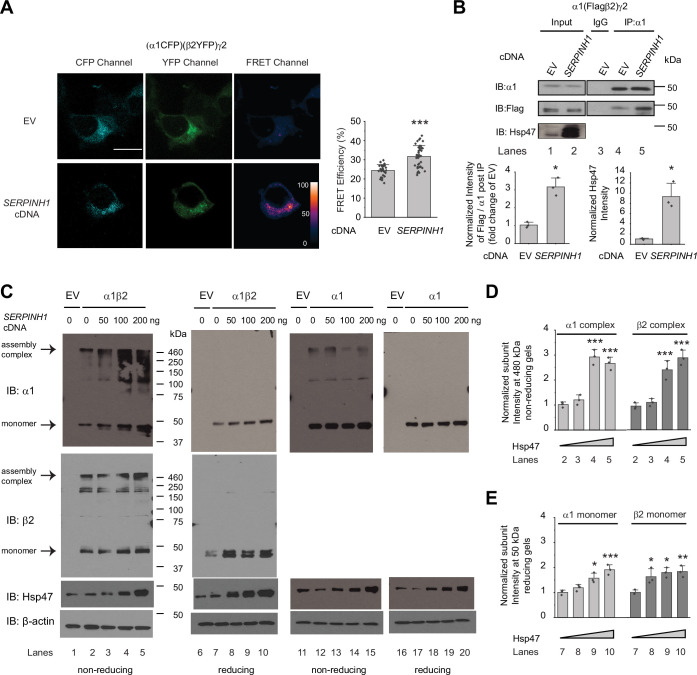
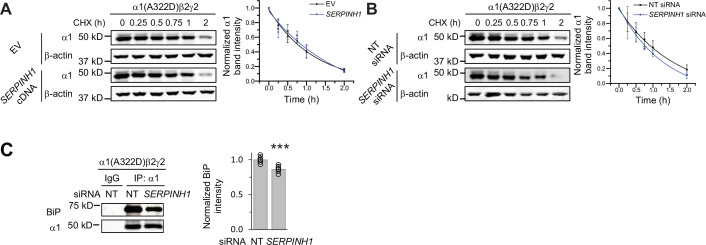
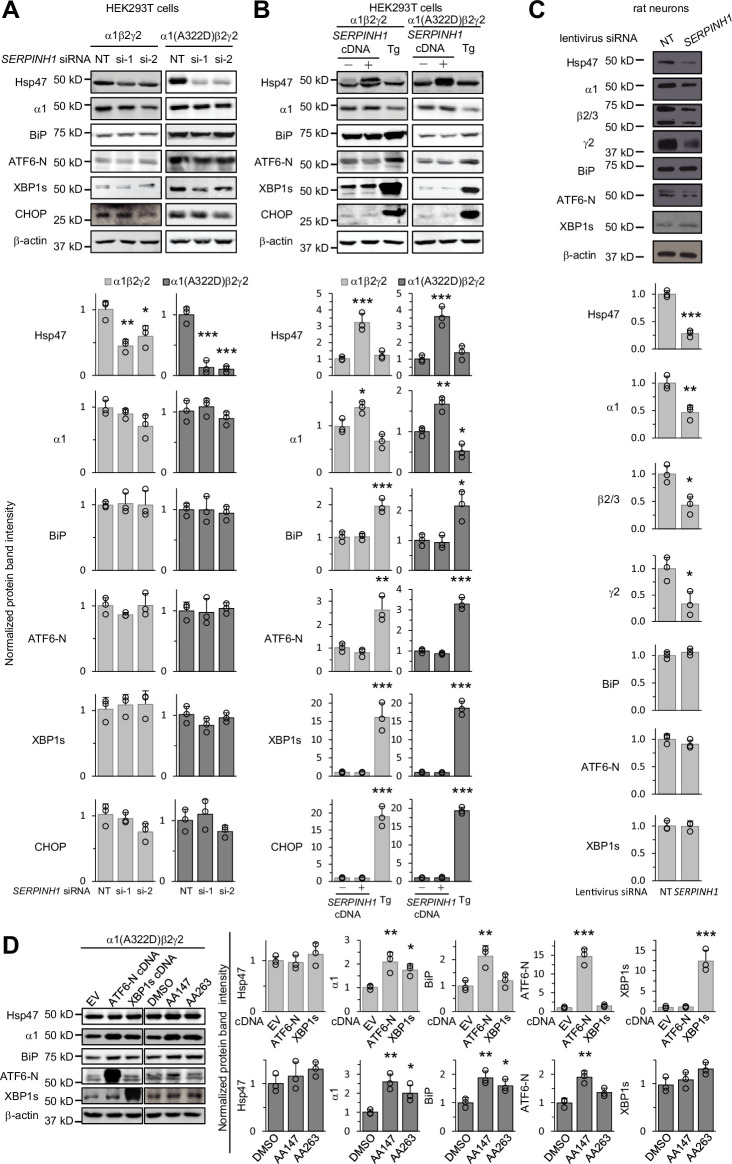
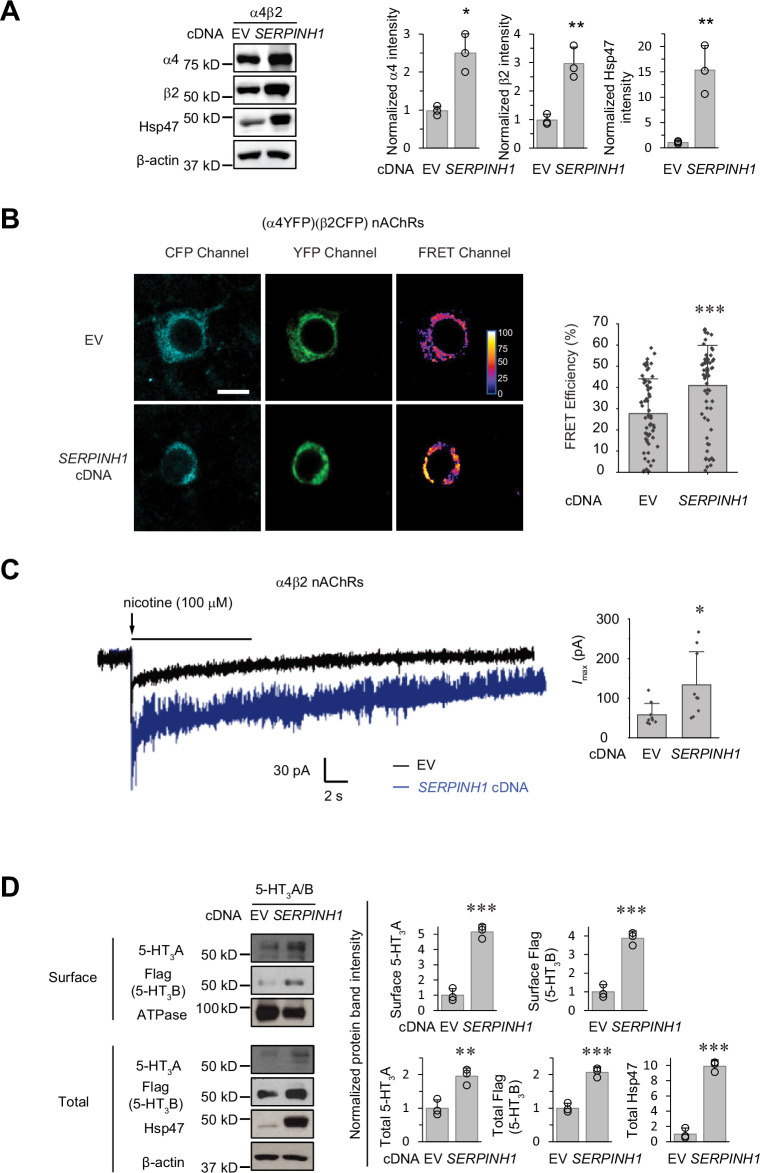
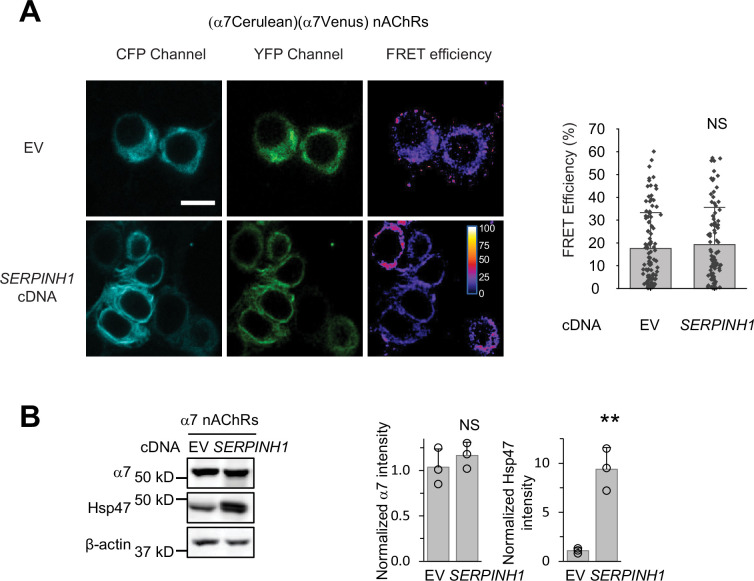
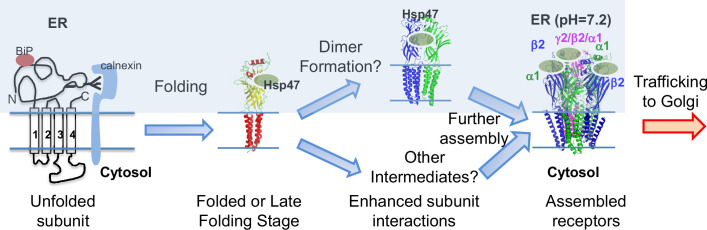
Protein homeostasis (proteostasis) deficiency is an important contributing factor to neurological and metabolic diseases. However, how the proteostasis network orchestrates the folding and assembly of multi-subunit membrane proteins is poorly understood. Previous proteomics studies identified Hsp47 (Gene: SERPINH1), a heat shock protein in the endoplasmic reticulum lumen, as the most enriched interacting chaperone for gamma-aminobutyric acid type A (GABAA) receptors. Here, we show that Hsp47 enhances the functional surface expression of GABAA receptors in rat neurons and human HEK293T cells. Furthermore, molecular mechanism study demonstrates that Hsp47 acts after BiP (Gene: HSPA5) and preferentially binds the folded conformation of GABAA receptors without inducing the unfolded protein response in HEK293T cells. Therefore, Hsp47 promotes the subunit-subunit interaction, the receptor assembly process, and the anterograde trafficking of GABAA receptors. Overexpressing Hsp47 is sufficient to correct the surface expression and function of epilepsy-associated GABAA receptor variants in HEK293T cells. Hsp47 also promotes the surface trafficking of other Cys-loop receptors, including nicotinic acetylcholine receptors and serotonin type 3 receptors in HEK293T cells. Therefore, in addition to its known function as a collagen chaperone, this work establishes that Hsp47 plays a critical and general role in the maturation of multi-subunit Cys-loop neuroreceptors.

Keywords: GABAA receptors; Hsp47; assembly; biochemistry; cell biology; chemical biology; epilepsy; folding; human; mouse; proteostasis.


Conflict of interest statement

YW, XD, PZ, XC, MW, DH, RN, BH, FM, TM No competing interests declared

Figures

Figure 1.
Figure 1.. Hsp47 interacts with GABAA receptors.
(A) Endogenous interactions between GABAA receptor α1 subunits and Hsp47. Mouse brain homogenates from 8 to 10 weeks C57BL/6 J mice were immunoprecipitated with an anti-α1 antibody, and the immunoisolated eluents were blotted with indicated antibodies. IgG was included as a negative control for non-specific binding. Three biological replicates were performed. (B) Recombinant Hsp47 binds recombinant α1 subunit and β2 subunit of GABAA receptors in vitro. GST, GST-tagged α1 or GST-tagged β2 recombinant protein was mixed with His-tagged Hsp47 in buffers containing 1% Triton X-100. The protein complex was isolated by immunoprecipitation using an anti-His antibody, and the immunopurified eluents were separated by SDS-PAGE and blotted with indicated antibodies. Three biological replicates were performed. (C) MicroScale Thermophoresis (MST) was used to determine the binding affinities between Hsp47, an ER luminal chaperone, to RED-labeled His-α1(ERD) and His-β2(ERD). Increasing concentrations of recombinant Hsp47 proteins (0.2 nM – 10 μM) were incubated with 50 nM RED-labeled His-α1(ERD) or His-β2(ERD) in PBS with Tween-20 (0.05%). Then samples were loaded to the capillaries and measured using a Monolith NT.115 instrument with the settings of 40% LED/excitation and 40% MST power. Three biological replicates were performed. The data were analyzed using the Monolith software for the calculation of the dissociation constant (Kd). IP, immunoprecipitation; IB, immunoblotting.
Figure 1—figure supplement 1.
Figure 1—figure supplement 1.. The GABAA receptor biogenesis pathway.
Individual GABAA receptor subunits fold in the endoplasmic reticulum (ER). Properly folded subunits assemble into a heteropentamer in the ER for subsequent trafficking to the plasma membrane. Unassembled and misfolded subunits are degraded by the ER-associated degradation (ERAD) pathway. The GABAA receptor cartoons are built from the cryo-EM structure of human α1β2γ2 GABAA receptors (PDB: 6X3 S). The large intracellular loop between TM3-TM4 is missing in the structure.
Figure 1—figure supplement 2.
Figure 1—figure supplement 2.. In vitro interactions between Hsp47 and membrane proteins.
(A) Recombinant His-tagged Hsp47 protein was mixed with FLAG-tagged ZIP7, hERG, GST-tagged GABAA receptor α1 recombinant proteins, or buffer only in binding buffers (50 mM Tris, pH 7.5, 150 mM NaCl, and 2 mM N-dodecyl-β-D-maltoside (DDM)). The protein complex was isolated by immunoprecipitation using an anti-His antibody, and the immunopurified eluents were separated by SDS-PAGE and blotted with indicated antibodies. Three biological replicates were performed. (B) Representative circular dichroism (CD) spectra of α1 subunit ERD domain and β2 subunit ERD domain. Molar ellipticity [θ] was plotted against the wavelength (nm). Each CD Spectrum was measured by accumulating three spectra to obtain the average with the blank correction.
Figure 2.
Figure 2.. Hsp47 positively regulates the surface expression of endogenous GABAA receptors in cultured neurons.
(A, B) Effect of knocking down Hsp47 (A) and overexpressing Hsp47 (B) on the surface expression of endogenous GABAA receptor subunits in primary rat hippocampal neurons. Cultured neurons were transduced with SERPINH1 siRNA lentivirus or scrambled siRNA lentivirus (A) and with SERPINH1 cDNA lentivirus or empty vector (EV) lentivirus (B) at days in vitro (DIV) 10. Forty-eight hours post transduction, surface GABAA receptors were stained using anti-α1 subunit, anti-β2/β3 subunit, or anti-γ2 subunit antibodies without membrane permeabilization. The cells were then washed, and permeabilized before we stained the nuclei with DAPI. Hsp47 staining was carried out after membrane permeabilization. At least 20 neurons from at least three transductions were imaged by confocal microscopy for each condition. Representative images are shown on the left side. Scale bar = 10 μm (A) or 20 μm (B). Quantification of the fluorescence intensity of the surface GABAA receptor subunits or Hsp47 after background correction per neuron was shown on the right. (C) Whole-cell patch clamping was performed to record GABA-induced currents. Neurons were subjected to transduction as in (A) and (B). The recordings were carried out 48 hr post transduction. Eight to ten neurons from three transductions were recorded. Representative traces are shown in the left-hand panel. Peak current amplitude (Imax) is shown on the right. The holding potential was set at −60 mV. pA: picoampere. Each data point is reported as mean ± SD. Statistical significance was calculated using t-test (A, B) or one-way ANOVA followed by post hoc Tukey’s HSD test (C). *** p<0.001.
Figure 2—figure supplement 1.
Figure 2—figure supplement 1.. Hsp47 expression in the central nervous system.
(A) Hsp47 and GABAA receptor β2/β3 subunit protein expression in various mouse brain regions according to SDS-PAGE and Western blot analysis. Three biological replicate experiments were performed from tissue isolated from three different mice for each brain region. (B) Hsp47 knockdown in cultured rat hippocampal neurons. Cultured neurons were subjected to transduction with SERPINH1 siRNA lentivirus or scrambled siRNA lentivirus at days in vitro (DIV) 10. Forty-eight hours post-transduction, neurons were fixed, permeabilized, and stained using anti-Hsp47 or anti-NeuN (a marker of the neuron nuclei) antibodies. Neurons were visualized using a confocal microscope. Representative images are shown for each condition. Scale bar = 15 μm. in the bottom panel, we display the quantification of the Hsp47 staining fluorescence intensity after background correction. The analysis was performed on at least 20 cells accumulated from a minimum of three individual coverslips from either the SERPINH1 siRNA lentivirus or scrambled siRNA lentivirus conditions. Each data point is reported as mean ± SD. Statistical significance was calculated using an unpaired two-tailed Student’s t-Test. *** p<0.001.
Figure 3.
Figure 3.. Hsp47 preferentially binds the folded conformation of GABAA receptor subunits.
(A) Overexpression of Hsp47 increases the endo H-resistant post-ER glycoform of the α1 subunit in HEK293T cells stably expressing α1β2γ2 GABAA receptors. The peptide-N-glycosidase F (PNGase F) enzyme cleaves the innermost GlcNAc and serves a control for unglycosylated α1 proteins (lane 5). Two endo H-resistant bands were detected for the α1 subunit since there are two N-glycosylation sites in α1, indicated by the bracket (lanes 2 and 4). Quantification of the ratio of endo H-resistant / total α1 subunit bands, as a measure of the ER-to-Golgi trafficking efficiency, is shown on the bottom. (B) Dithiothreitol (DTT) treatment decreases the interaction between Hsp47 and α1 subunit of GABAA receptors. HEK293T cells stably expressing WT α1β2γ2 GABAA receptors were treated with indicated concentration of DTT in the PBS buffer for 10 min. Then Triton X-100 cell extracts were immunoprecipitated with a mouse anti-Hsp47 antibody, and the immunoisolated eluents were subjected for immunoblotting assay. Quantification of the relative intensity of α1/Hsp47 post IP, as a measure of their interactions, is shown on the bottom panel. (C) Disulfide bond mutations in the α1 subunit decrease the interaction between Hsp47 and α1 subunit of GABAA receptors. HEK293T cells were transiently transfected with WT α1β2γ2, α1(C166A)β2γ2, or α1(C166A, C180A)β2γ2 subunits. Forty-eight hours post transfection, Triton X-100 cell extracts were immunoprecipitated with a mouse anti-Hsp47 antibody, and the immunoisolated eluents were subjected for immunoblotting assay. Quantification of the relative intensity of α1/Hsp47 post IP is shown on the bottom panel. (D) Disulfide bond mutations in the α1 subunits decrease the solubility of the α1 subunit protein. HEK293T cells were transiently transfected as in (C). Forty-eight hours post transfection, the Triton X-100 detergent soluble fractions and the Triton X-100 detergent insoluble fractions were isolated for immunoblotting assay. Quantification of the ratio of insoluble/soluble fractions, as a measure of relative aggregation, is shown on the bottom panel. (E) DTT treatment increases the interaction between BiP and α1 subunit of GABAA receptors. HEK293T cells stably expressing α1β2γ2 GABAA receptors were treated with indicated concentrations of DTT in PBS for 10 minutes. Then Triton X-100 cell extracts were immunoprecipitated with a mouse anti-α1 antibody, and the immunoisolated eluents were subjected for immunoblotting assay. Quantification of the relative intensity of BiP/α1 post IP is shown on the bottom panel. (F) The disulfide mutations of α1 subunit increase the interaction between BiP and the α1 subunit. HEK293T cells were transiently transfected as in (C). Forty-eight hours post transfection, Triton X-100 cell extracts were immunoprecipitated with a mouse anti-α1 antibody, and the immunoisolated eluents were subjected for immunoblotting assay. Quantification of the relative intensity of BiP/α1 post IP is shown on the bottom panel. IP, immunoprecipitation; IB, immunoblotting. For (A)-(F), three biological replicates were performed. Each data point is reported as mean ± SD. Significant difference was analyzed by t-test (A), or a one-way ANOVA followed by post hoc Tukey’s HSD test (B–F). *, p<0.05; **, p<0.01; ***, p<0.001.
Figure 3—figure supplement 1.
Figure 3—figure supplement 1.. Effect of Hsp47 on the degradation of wild type GABAA receptors.
(A) Whole-cell patch clamping was performed to record GABA-induced currents. HEK293T cells expressing α1β2γ2 GABAA receptors were transfected with empty vector (EV) control or SERPINH1 cDNA plasmids. The recording was carried out 48 hr post transfection. The holding potential was set at –60 mV. Representative traces were shown. Quantification of the peak currents (Imax) from 11 to 12 cells from three transfections is shown on the right. pA: picoampere. (B) HEK293T cells expressing α1β2γ2 GABAA receptors were transfected with HA-ubiquitin together with empty vector (EV) control or SERPINH1 cDNA plasmids. Forty-eight hours post transfection, cells were lysed and the total proteins were immunoprecipitated with anti-α1 antibody. The eluents were probed with indicated antibodies. Three biological replicates were performed. (C, D) HEK293T cells expressing α1β2γ2 GABAA receptors were transfected with empty vector (EV) control or SERPINH1 cDNA plasmids (C), or transfected with non-targeting (NT) control siRNA or siRNA against SERPINH1 (D). Forty-eight hours post transfection, cycloheximide (CHX), a potent protein synthesis inhibitor, was added to the cell culture media for the indicated time. The remaining α1 protein levels were monitored and plotted against the CHX application time. Three biological replicates were performed. (E) HEK293T cells expressing α1β2γ2 GABAA receptors were transfected with non-targeting (NT) control siRNA or siRNA against SERPINH1. Forty-eight hours post transfection, cells were lysed and the total proteins were immunoprecipitated with anti-α1 antibody. The eluents were probed with indicated antibodies. Three biological replicates were performed. Each data point is reported as mean ± SD. Statistical significance was calculated using two-tailed Student’s t-Test. *, p<0.05.
Figure 4.
Figure 4.. Hsp47 promotes the assembly of GABAA receptors.
(A) Hsp47 overexpression increases FRET efficiency between CFP-tagged α1 subunit and YFP-tagged β2 subunit of GABAA receptors. HEK293T cells were transfected with CFP-tagged α1 subunit, YFP-tagged β2 subunit, and γ2 subunit; in addition, cells were transfected with empty vector (EV) control or Hsp47 cDNA. Forty-eight hours post transfection, pixel-based FRET was used to measure the FRET efficiency between α1-CFP and β2-YFP by using a confocal microscope. Representative images were shown for the CFP channel (1st columns), YFP channel (2nd columns), and FRET efficiency (3rd columns). Scale bar = 10 μm. Quantification of the FRET efficiency from 30 to 41 cells from at least three transfections was achieved using the ImageJ PixFRET plug-in, and shown on the right. (B) Overexpression of Hsp47 increases the interaction between α1 and β2 subunit of GABAA receptors. HEK293T cells stably expressing α1(Flag-β2)γ2 GABAA receptors were transfected with empty vector (EV) control or SERPINH1 cDNA. Forty-eight hours post transfection, Triton X-100 cell extracts were immunoprecipitated with a mouse anti-α1 antibody, and the immunoisolated eluents were subjected to immunoblotting assay. Three biological replicates were performed. Quantification of the relative intensity of Flag-β2 / α1 post IP is shown on the bottom. (C) HEK293T cells were transiently transfected with empty vector (EV), α1 subunits alone, or both α1 and β2 subunits of GABAA receptors together with SERPINH1 cDNA plasmids at various concentrations. Forty-eight hours post transfection, cells were lysed in RIPA buffer, and the total cell lysates were subjected to SDS-PAGE under non-reducing conditions and reducing conditions and immunoblotting analysis. Three biological replicates were performed. (D) Quantification of the 480 kDa band intensities for α1 and β2 subunits under non-reducing conditions (lanes 2–5 in C) (n=3). (E) Quantification of the 50 kDa band intensities for α1 and β2 subunits under reducing conditions (lanes 7–10 in C) (n=3). IP, immunoprecipitation; IB, immunoblotting. Each data point is reported as mean ± SD. Significant difference was analyzed by t-test (A, B) or a one-way ANOVA followed by post hoc Tukey’s HSD test (D, E). *, p<0.05; **, p<0.01; ***, p<0.001.
Figure 4—figure supplement 1.
Figure 4—figure supplement 1.. Dose-response curves of GABAA receptors.
HEK293T cells were transfected with α1, β2, and γ2 subunits of GABAA receptors, or α1-CFP, β2-YFP, and γ2 subunits. Forty-eight hours post-transfection, whole-cell patch-clamping electrophysiological recordings were carried out using IonFlux Mercury 16 ensemble plates to calculate EC50 values for GABA (n=3–6 ensembles; each ensemble recording included 20 cells). The holding potential was set at –60 mV. Each data point is reported as mean ± SD.
Figure 5.
Figure 5.. Hsp47 positively regulates the functional surface expression of epilepsy-associated GABAA receptors.
(A) Overexpression of Hsp47 increases the endo H-resistant post-ER glycoform of the α1 subunit in HEK293T cells expressing α1(A322D)β2γ2 GABAA receptors. PNGase F treatment serves as a control for unglycosylated α1 subunit (lane 5). Two endo H-resistant bands were detected for the α1 subunit, indicated by the bracket (lanes 2 and 4). Three biological replicates were performed. Quantification of the ratio of endo H-resistant / total α1 subunit bands, as a measure of the ER-to-Golgi trafficking efficiency, is shown on the bottom. (B) HEK293T cells expressing α1(A322D)β2γ2 GABAA receptors were transfected with HA-ubiquitin together with empty vector (EV) control or SERPINH1 cDNA plasmids. Forty-eight hours post transfection, cells were lysed and the total proteins were immunoprecipitated with anti-α1 antibody. The eluents were probed with indicated antibodies. Three biological replicates were performed. (C) HEK293T cells expressing α1(A322D)β2γ2 GABAA receptors were transfected with empty vector (EV) control or SERPINH1 cDNA plasmids. Forty-eight hours post transfection, the surface proteins were measured using a cell surface protein biotinylation assay. The Na+/K+ ATPase serves as a loading control for biotinylated membrane proteins. Alternatively, cells were lysed, and the total cell lysates were subjected to reducing SDS-PAGE and immunoblotting analysis. β-actin serves as a total protein loading control. Three biological replicates were performed. Protein intensities were quantified using ImageJ and shown on the bottom. (D) Whole-cell patch clamping was performed to record GABA-induced currents. HEK293T cells were treated as in (C). The recording was carried out 48 hr post transfection. The holding potential was set at –60 mV. Representative traces were shown. Quantification of the peak currents (Imax) from 17 to 20 cells from three transfections is shown on the right. pA: picoampere. (E) Positions of the four α1 variants are displayed as space-filling models in the 3D structure of α1β2γ2 GABAA receptors, built from 6X3S.pdb using PyMOL. (F) HEK293T cells expressing α1(S76R)β2γ2, α1(D219N)β2γ2, or α1(G251D)β2γ2 GABAA receptors were transfected with EV control or SERPINH1 cDNA plasmids. Forty-eight hours post transfection, the surface proteins were measured using a cell surface protein biotinylation assay. Three biological replicates were performed. (G) Whole-cell patch clamping was performed to record GABA-induced currents using the IonFlux Mercury 16 ensemble plates at a holding voltage of −60 mV. HEK293T cells were treated as in (F). The recording was carried out 48 hr post transfection. Application of GABA (100 μM, 3 s) is indicated by the horizontal bar above the current traces. Each ensemble recording enclosed 20 cells. Quantification of the peak currents (Imax) is shown on the bottom (n=6–12 ensembles). Each data point is reported as mean ± SD. Statistical significance was calculated using two-tailed Student’s t-Test. *, p<0.05; **, p<0.01; ***, p<0.001.
Figure 5—figure supplement 1.
Figure 5—figure supplement 1.. Effect of Hsp47 on the degradation of a GABAA receptor variant.
(A, B) HEK293T cells expressing α1(A322D)β2γ2 GABAA receptors were transfected with empty vector (EV) control or SERPINH1 cDNA plasmids (A), or transfected with non-targeting (NT) control siRNA or siRNA against SERPINH1 (B). Forty-eight hours post transfection, cycloheximide (CHX), a potent protein synthesis inhibitor, was added to the cell culture media for the indicated time. The remaining α1 protein levels were monitored and plotted against the CHX application time. Three biological replicates were performed. (C) HEK293T cells expressing α1(A322D)β2γ2 GABAA receptors were transfected with non-targeting (NT) control siRNA or siRNA against SERPINH1. Forty-eight hours post transfection, cells were lysed and the total proteins were immunoprecipitated with anti-α1 antibody. The eluents were probed with indicated antibodies. Six biological replicates were performed. Each data point is reported as mean ± SD. Statistical significance was calculated using two-tailed Student’s t-Test. ***, p<0.001.
Figure 5—figure supplement 2.
Figure 5—figure supplement 2.. Overexpression of Hsp47 in HEK293T cells expressing a variety of pathogenic GABAA receptor variants.
HEK293T cells expressing α1(S76R)β2γ2, α1(D219N)β2γ2, or α1(G251D)β2γ2 GABAA receptors were transfected with empty vector (EV) control or SERPINH1 cDNA plasmids. Forty-eight hours post transfection, cells were lysed, and the total cell lysates were subjected to SDS-PAGE and immunoblotted for Hsp47. β-actin serves as a total protein loading control. Three biological replicates were performed. Quantification of Hsp47 protein levels was shown on the right. Each data point is reported as mean ± SD. Statistical significance was calculated using two-tailed Student’s t-Test. * p<0.05.
Figure 6.
Figure 6.. Genetic manipulations of Hsp47 do not activate the UPR.
(A) HEK293T cells expressing WT α1β2γ2 or α1(A322D)β2γ2 GABAA receptors were transiently transfected with non-targeting (NT) control siRNAs or siRNAs against SERPINH1 (#1 or #2). Forty-eight hours post-transfection, cells were lysed for SDS-PAGE and Western blot analysis. (B) HEK293T cells expressing WT α1β2γ2 or α1(A322D)β2γ2 GABAA receptors were transiently transfected with empty vector (EV) or SERPINH1 cDNA plasmids. Forty-eight hours post-transfection, cells were lysed for SDS-PAGE and western blot analysis. Thapsigargin (Tg) (0.5 μM, 16 hr), a pan-UPR activator, was used as a positive control to induce the UPR. (C) Cultured cortical neurons from E18 rats were transduced with SERPINH1 siRNA lentivirus or scrambled siRNA lentivirus at days in vitro (DIV) 10. Forty-eight hours post transduction, neurons were lysed for SDS-PAGE and western blot analysis. (D) HEK293T cells expressing α1(A322D)β2γ2 GABAA receptors were transiently transfected with empty vector (EV), ATF6-N cDNA, or XBP1s cDNA plasmids for 48 hr, or treated with DMSO vehicle control or ATF6 activators (AA147 (10 μM) or AA263 (10 μM)) for 24 hr. Afterwards, cells were lysed for SDS-PAGE and western blot analysis. Three biological replicates were performed. Each data point is reported as mean ± SD. Significant difference was analyzed by a one-way ANOVA followed by post hoc Tukey’s HSD test (A, B, D) or t-test (C). *, p<0.05; **, p<0.01; ***, p<0.001.
Figure 7.
Figure 7.. Hsp47 has a general effect on increasing the surface expression of the Cys-loop receptors.
(A) HEK293T cells were transfected with nAChR subunits (α4 (CHRNA4) and β2 (CHRNB2)) and empty vector (EV) control or SERPINH1 cDNA plasmids. Forty-eight hours post transfection, cells were lysed and the total proteins were evaluated using a western blot analysis. (B) Hsp47 overexpression increases FRET efficiency between CFP-tagged β2 subunit and YFP-tagged α4 subunit of nAChRs. HEK293T cells were transfected with CFP-tagged β2 subunit and YFP-tagged α4 subunit; in addition, cells were transfected with empty vector (EV) control or SERPINH1 cDNA. Forty-eight hours post transfection, pixel-based FRET was used to measure the FRET efficiency between β2-CFP and α4-YFP by using a confocal microscope. Representative images were shown for the CFP channel (1st columns), YFP channel (2nd columns), and FRET efficiency (3rd columns). Scale bar = 10 μm. Quantification of the FRET efficiency from 60 to 70 cells from at least three transfections was achieved using the ImageJ PixFRET plug-in, and shown on the right. (C) HEK293T cells were transfected with CFP-tagged β2 subunit and YFP-tagged α4 subunit of nAChRs; in addition, cells were transfected with empty vector (EV) control or SERPINH1 cDNA. Forty-eight hours post transfection, whole-cell patch clamping was performed to record nicotine-induced currents. Representative traces were shown. Quantification of the peak currents (Imax) from 9 cells from three transfections is shown on the right. The holding potential was set at –60 mV. pA: picoampere. (D) HEK293T cells were transfected with 5-HT3R subunits (5-HT3A and FLAG-tagged 5-HT3B) and empty vector (EV) control or SERPINH1 cDNA plasmids. Forty-eight hours post transfection, the surface proteins were measured using a cell surface protein biotinylation assay, and the total proteins were evaluated using a Western blot analysis. The Na+/K+ ATPase serves as a loading control for biotinylated membrane proteins. Three biological replicates were performed. Each data point is reported as mean ± SD. Statistical significance was calculated using two-tailed Student’s t-Test. * p<0.05; ** p<0.01; *** p<0.001.
Figure 7—figure supplement 1.
Figure 7—figure supplement 1.. Effect of Hsp47 on the biogenesis of α7 nAChRs.
(A) Hsp47 overexpression does not change the FRET efficiency between Cerulean (an improved CFP variant)-tagged α7 subunit and Venus (an improved YFP variant)-tagged α7 subunit of nAChRs. HEK293T cells were transfected with Cerulean-tagged α7 subunit and Venus-tagged α7 subunit at a 1:1 ratio; in addition, cells were transfected with empty vector (EV) control or SERPINH1 cDNA. Forty-eight hours post transfection, pixel-based FRET was used to measure the FRET efficiency between α7-Cerulean and α7-Venus by using a confocal microscope. Representative images were shown for the CFP channel (1st columns), YFP channel (2nd columns), and FRET efficiency (3rd columns). Scale bar = 10 μm. Quantification of the FRET efficiency from 90 to 105 cells from at least three transfections was achieved using the ImageJ PixFRET plug-in, and shown on the right. (B) HEK293T cells were transfected with nAChR α7 subunits and empty vector (EV) control or SERPINH1 cDNA plasmids. Forty-eight hours post transfection, cells were lysed and the total proteins were evaluated using a western blot analysis. Three biological replicates were performed. Each data point is reported as mean ± SD. Statistical significance was calculated using two-tailed Student’s t-Test. NS, not significant; ** p<0.01.
Figure 7—figure supplement 2.
Figure 7—figure supplement 2.. Effect of Hsp47 on the biogenesis of structurally diverse proteins.
(A) HEK293T cells were transfected with NMDA receptor subunits (GluN1 and GluN2A (WT or M705V)) and empty vector (EV) control or SERPINH1 cDNA plasmids. Forty-eight hours post transfection, the surface proteins were measured using a cell surface protein biotinylation assay, and the total proteins were evaluated using a Western blot analysis. The Na+/K+ ATPase serves as a loading control for biotinylated membrane proteins. Three biological replicates were performed. (B) HEK293T cells stably expressing FLAG-tagged hERG potassium channels (WT, N470D, or T65P) were transiently transfected with non-targeting (NT) control siRNA or siRNA against SERPINH1. Forty-eight hours post transfection, cells were lysed, and the total proteins were subjected to SDS-PAGE and immunoblotting with indicated antibodies. The 155 kDa band represents the mature form, and the 135 kDa band represents the immature ER form. Three biological replicates were performed. (C) Gaucher patient-derived fibroblasts carrying L444P β-glucocerebrosidase variant were transiently transfected with non-targeting (NT) control siRNA or siRNA against SERPINH1. Forty-eight hours post transfection, cells were lysed, and the total proteins were subjected to SDS-PAGE and immunoblotting with indicated antibodies. Three biological replicates were performed. Each data point is reported as mean ± SD. Statistical significance was calculated using an unpaired two-tailed Student’s t-Test. * p<0.05, ** p<0.01, *** p<0.001.
Figure 8.
Figure 8.. Proposed mechanism of Hsp47 in the assembly of GABAA receptors.
BiP and calnexin assist the subunit folding early in the ER lumen. Hsp47 operates after BiP and binds the folded states of the α1 or β subunits in the ER lumen. Hsp47 links the α1 and β subunits and promotes their inter-subunit interactions. As a result, Hsp47 promotes the formation of assembly intermediates and the native pentameric receptors in the ER. Assembled receptors will traffic to the Golgi and onward to the plasma membrane for function.

Update of

  • doi: 10.1101/2022.10.24.513629

Similar articles

Cited by

References

    1. Alder NN, Johnson AE. Cotranslational membrane protein biogenesis at the endoplasmic reticulum. The Journal of Biological Chemistry. 2004;279:22787–22790. doi: 10.1074/jbc.R400002200. - DOI - PubMed
    1. Balch WE, Morimoto RI, Dillin A, Kelly JW. Adapting proteostasis for disease intervention. Science. 2008;319:916–919. doi: 10.1126/science.1141448. - DOI - PubMed
    1. Balchin D, Hayer-Hartl M, Hartl FU. In vivo aspects of protein folding and quality control. Science. 2016;353:aac4354. doi: 10.1126/science.aac4354. - DOI - PubMed
    1. Barnes EM. Assembly and intracellular trafficking of GABAA receptors. International Review of Neurobiology. 2001;48:1–29. doi: 10.1016/s0074-7742(01)48012-3. - DOI - PubMed
    1. Bianchi FT, Camera P, Ala U, Imperiale D, Migheli A, Boda E, Tempia F, Berto G, Bosio Y, Oddo S, LaFerla FM, Taraglio S, Dotti CG, Di Cunto F. The collagen chaperone HSP47 is a new interactor of APP that affects the levels of extracellular beta-amyloid peptides. PLOS ONE. 2011;6:e22370. doi: 10.1371/journal.pone.0022370. - DOI - PMC - PubMed