. 2024 Sep;11(33):e2402473.
doi: 10.1002/advs.202402473. Epub 2024 Jul 4.

Biomimetic Metal-Organic Framework Gated Nanoplatform for Sonodynamic Therapy against Extensively Drug Resistant Bacterial Lung Infection

Affiliations

Biomimetic Metal-Organic Framework Gated Nanoplatform for Sonodynamic Therapy against Extensively Drug Resistant Bacterial Lung Infection

Jianling Huang et al. Adv Sci (Weinh). 2024 Sep.

Abstract

Novel antimicrobial strategies are urgently needed to treat extensively drug-resistant (XDR) bacterial infections due to the high mortality rate and lack of effective therapeutic agents. Herein, nanoengineered human umbilical cord mesenchymal stem cells (hUC-MSCs), named PMZMU, are designed as a sonosensitizer for synergistic sonodynamic-nano-antimicrobial therapy against gram-negative XDR bacteria. PMZMU is composed of a bacterial targeting peptide (UBI29-41) modified hUC-MSCs membrane (MSCm), a sonosensitizer meso-tetra(4-car-boxyphenyl) porphine doped mesoporous organo-silica nanoparticle and an acidity-responsive metal-organic framework ZIF-8. This innovative formulation enables efficient loading of polymyxin B, reduces off-target drug release, increases circulation and targeting efficacy, and generates reactive oxygen species upon ultrasound irradiation. PMZMU exhibits remarkable in vitro inhibitory activity against four XDR bacteria: Klebsiella pneumoniae, Acinetobacter baumannii, Pseudomonas aeruginosa (PA), and Escherichia coli. Taking advantage of the bacterial targeting ability of UBI29-41 and the inflammatory chemotaxis of hUC-MSC, PMZMU can be precisely delivered to lung infection sites thereby augmenting polymyxin B concentration. PMZMU-mediated sonodynamic therapy significantly reduces bacterial burden, relieves inflammatory damage by promoting the polarization of macrophages toward M2 phenotype, and improves survival rates without introducing adverse events. Overall, this study offers promising strategies for treating deep-tissue XDR bacterial infections, and guides the design and optimization of biomimetic nanomedicine.

Keywords: biomimetic nanoplatform; extensively drug resistant bacteria; mesenchymal stem cells; metal–organic framework; polymyxin B; sonodynamic therapy.


Conflict of interest statement

The authors declare no conflict of interest.

Figures
Scheme 1
Scheme 1
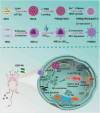
Preparation of PMZMU nanoparticles and schematic illustration of sonodynamic therapy for improving antimicrobial efficacy of XDR bacterial pneumonia. APTES, (3‐Aminopropyl) triethoxysilane; Zn2+, Zn (NO3)2·6H2O; 2‐Melm,2‐methylimidazole.
Figure 1
Figure 1
Structure of TMOS and TMOS@ZIF‐8. A) Scheme for the synthesis of TMOS and TMOS@ZIF‐8. B) Representative TEM image of TMOS. Scale bar: 50 nm. C–F) Representative TEM images of TMOS@ZIF‐8 with different TMOS to Zn (NO3)2 to 2‐MeIm. Scale bar: 50 nm. G) Energy‐dispersive X‐ray spectroscopy (EDS) spectrum element mapping of TMOS@ZIF‐8. H) EDS spectrum of TMOS@ZIF‐8. All the major elements (C, N, O, Si, and Zn) can be found in the spectrum. I) The X‐ray diffraction patterns of TMOS, ZIF‐8, and TMOS@ZIF‐8. J) N2 adsorption‐desorption isotherms of TMOS and TMOS@ZIF‐8. (K) Pore size distributions of TMOS and TMOS@ZIF‐8 nanoparticles.
Figure 2
Figure 2
Fabrication and characterization of MZMU. A) Representative TEM image of MZM. Scale bar:50 nm. B) Representative TEM images of MZMU. Scale bar: 50 nm. C) FTIR spectra of DSPE‐PEG2000‐Maleimide, UBI29‐41 and DSPE‐PEG2000‐ UBI29‐41. D) UV‐vis spectra of UBI29‐41 peptide, MZM and MZMU. E) Images of SDS‐PAGE gels to examine protein contents of whole mesenchymal stem cells (MSC), mesenchymal stem cell membranes (MSCm), TMOS@ZIF‐8 nanoparticles and MZMU nanoparticles. F) Confocal fluorescence images corresponding to co‐localization of DiO‐labeled MSC membrane modifications (DiO, green) and TMOS@ZIF‐8 nanoparticles (TCPP, red) in RAW264.7 cells incubated with 25 µg mL−1 MZMU nanoparticles for 2 h and 6 h. Scale bar:20 µm. G) Particle size of MZMU at different time points determined by DLS measurements. MZMU was dispersed in water, pH 7.4 PBS and DMEM at 4 °C for 21 days. (n = 3, Data are expressed in mean ± SD).
Figure 3
Figure 3
Dual‐responsive degradation and drug release behavior of PMZMU. A) Schematic for the PMB release profiles of PMZMU at different pH values and GSH‐containing medium. B) Thermogravimetric analysis (TGA) curves of MZMU and PMZMU. PMB release profiles of C) PMB@TMOS, D) PMZ, and E) PMZMU at different pH values and GSH‐containing medium. (n = 3, * p <0.05, ** p <0.01, *** p <0.001. Data are expressed in mean ± SD). F) Zinc ion release profiles of PMZMU at different pH values and GSH‐containing medium. (n = 3, * p <0.05, ** p <0.01, *** p <0.001. Data are expressed in mean ± SD). G) Representative TEM images showing the pH and GSH dual responsive degradation of PMZMU nanoparticles. Scale bar:100 nm.
Figure 4
Figure 4
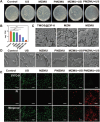
The antibacterial activity of PMZMU mediated SDT in vitro. A) Typical Photographs and B) strain counts of extensively drug‐resistant P. aeruginosa (XDR‐PA) calculated from spread‐plate assays after treated with PBS (control), US, MZMU, PMZMU, MZMU+US and PMZMU+US (n = 3, *** p <0.001. Data are expressed in mean ± SD). C) SEM image of XDR‐PA incubated with TMOS@ZIF‐8, MZM, and MZMU nanoparticle. D) SEM images of XDR‐PA after treated with PBS (control), US, MZMU, PMZMU, MZMU+US, and PMZMU+US. Scale bar:1 µm. E) Representative fluorescence images for live/dead bacterial staining assay of XDR‐PA after treated with PBS (control), US, MZMU, PMZMU, MZMU+US, and PMZMU+US, including PI signal (dead bacteria, red), SYTO‐9 signal (live bacteria, green), and merged pictures. Scale bar:200 µm.
Figure 5
Figure 5
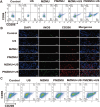
The antibacterial mechanism of PMZMU mediated sonodynamic therapy in vitro. A) Flow cytometry profiles of PI internalization by bacteria to evaluate membrane permeability after treated with PBS (Control), US, MZMU, PMZMU, MZMU+US and PMZMU+US. B) Quantitative analysis of PI uptake rate in bacteria after treated with PBS (Control), US, MZMU, PMZMU, MZMU+US and PMZMU+US. (n = 3, ** p <0.01, *** p <0.001. Data are expressed in mean ± SD). C) Flow cytometry profiles of ROS generation in XDR‐PA using flow cytometry with DCFH‐DA staining after treated with PBS (Control), US, MZMU, PMZMU, MZMU+US and PMZMU+US. D) Fluorescence images of XDR‐PA showing the production of ROS after different treatments. Scale bar:200 µm. E) Macroscopic XDR‐PA biofilm images of different treatment groups with crystal violet staining. F) 3D reconstructions of the fluorescence‐labeled XDR‐PA biofilms stained with SYTO‐9 (live bacteria) after different treatments. Scale bar:30 µm.
Figure 6
Figure 6
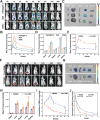
In vivo fluorescence imaging for the distribution of MZMU and PMB. A,B) In vivo fluorescence images of XDR‐PA lung infected mice and quantitative mean fluorescence intensity analysis of lung at different time points after intravenous injection with 100 µL TMOS@ZIF‐8, MZM and MZMU (4 mg mL−1). C,D) Ex vivo fluorescence images of major organs at 48 h after intravenous injection of TMOS@ZIF‐8, MZM and MZMU. E,F) In vivo biodistribution of PMB in XDR‐PA lung infected mice and quantitative mean fluorescence intensity analysis of lung at different time points after intravenous injection of free PMB and PMZMU (2 mg kg−1 PMB). G,H) Ex vivo fluorescence images of major organs at 48 h post‐injection of free PMB and PMZMU. I) The concentrations of PMB in lung tissues at comprehensive different time points. J) Pharmacokinetics of PMB in plasma. (n = 3, * p <0.05, ** p <0.01, *** p <0.001. Data are expressed in mean ± SD).
Figure 7
Figure 7
In vivo evaluation of antibacterial effects using the mouse acute XDR‐PA model. A) Schematic diagram of the in vivo treatment procedure for the antibacterial assay. B) Bacterial loads in lungs of mice after treated with saline (Control), US, MZMU, PMZMU, MZMU+US and PMZMU+US. (n = 6, ****p <0.0001,Data are expressed in mean ± SD). C) Giemsa staining of the lung tissue after various treatments. Scale bar:50 µm. D) H&E staining of the lung tissue after various treatments. Scale bar:50 µm. E) Fluorescence‐stained lung tissue sections in different treatment groups to measure ROS production in vivo. DAPI (blue fluorescence) represents the cell nucleus, while Dihydroethidium (red fluorescence) stands for ROS. Scale bar: 200 µm.
Figure 8
Figure 8
In vitro and in vivo evaluation of immunomodulatory functions. A) Flow scatter diagrams of CD86 (M1 marker) and CD206 (M2 marker) expression in macrophages (RAW 264.7) cells after different treatments B) Immunofluorescent co‐staining of CD206/iNOS/DAPI in lung tissues. Scale bar:50 µm. C) Flow cytometry graphs of the percentage of M2 macrophages (CD45+CD11b+F4/80+CD206+) and M1 macrophages (CD45+CD11b+F4/80+CD86+) in the spleen of mice in different treatment groups (n = 6).

Similar articles

References

    1. Horcajada J. P., Montero M., Oliver A., Sorlí L., Luque S., Gómez‐Zorrilla S., Benito N., Grau S., Clin. Microbiol. Rev. 2019, 10.1128/cmr.00031-19. - DOI - PMC - PubMed
    1. Leon‐Buitimea A., Morones‐Ramirez J. R., Yang J. H., Pena‐Miller R., Front. Bioeng. Biotechnol. 2021, 9, 636278. - PMC - PubMed
    1. Rabanal F., Cajal Y., Nat. Prod. Rep. 2017, 34, 886. - PubMed
    1. Yin J., Meng Q., Cheng D., Fu J., Luo Q., Liu Y., Yu Z., Appl. Microbiol. Biotechnol. 2020, 104, 3771. - PubMed
    1. Hussein M., Hu X., Paulin O., Crawford S., Tony Z. Q., Baker M., Schneider‐Futschik E. K., Zhu Y., Li J., Velkov T., Comput. Struct. Biotechnol. J 2020, 18, 2247. - PMC - PubMed

MeSH terms

Substances

LinkOut - more resources