. 2024 Jul 5;10(27):eado2365.
doi: 10.1126/sciadv.ado2365. Epub 2024 Jul 3.

Targeting IL-1 controls refractory pityriasis rubra pilaris

Affiliations

Targeting IL-1 controls refractory pityriasis rubra pilaris

Eloi Schmauch et al. Sci Adv. .

Abstract

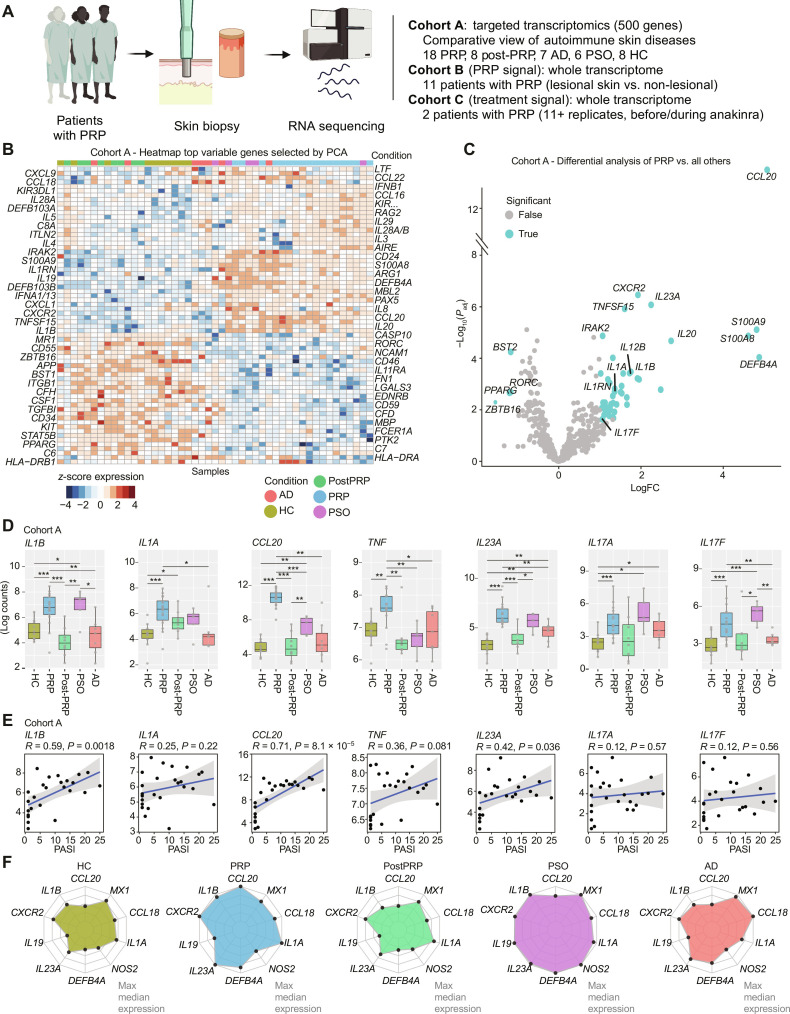
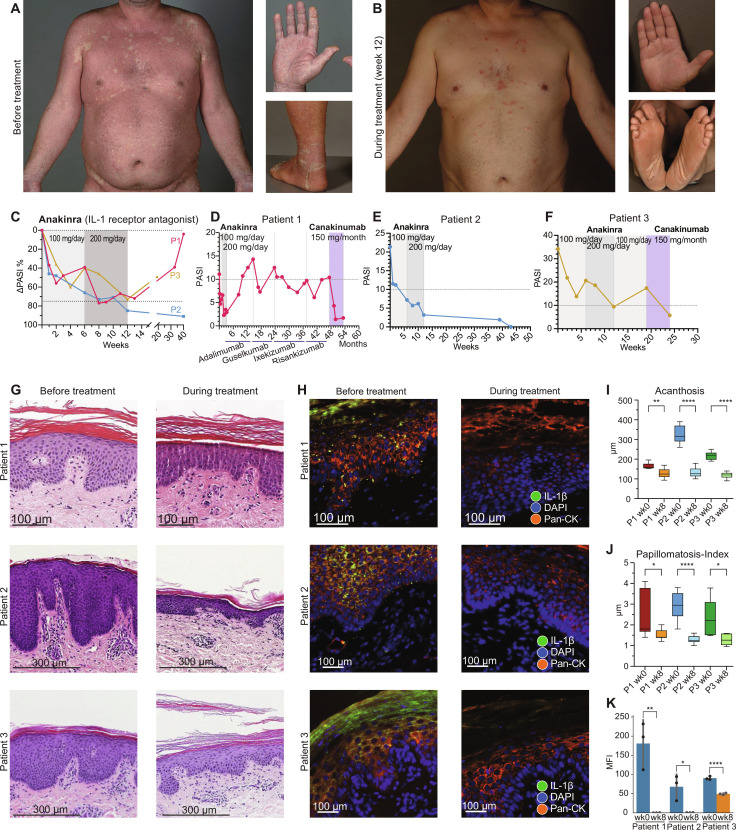
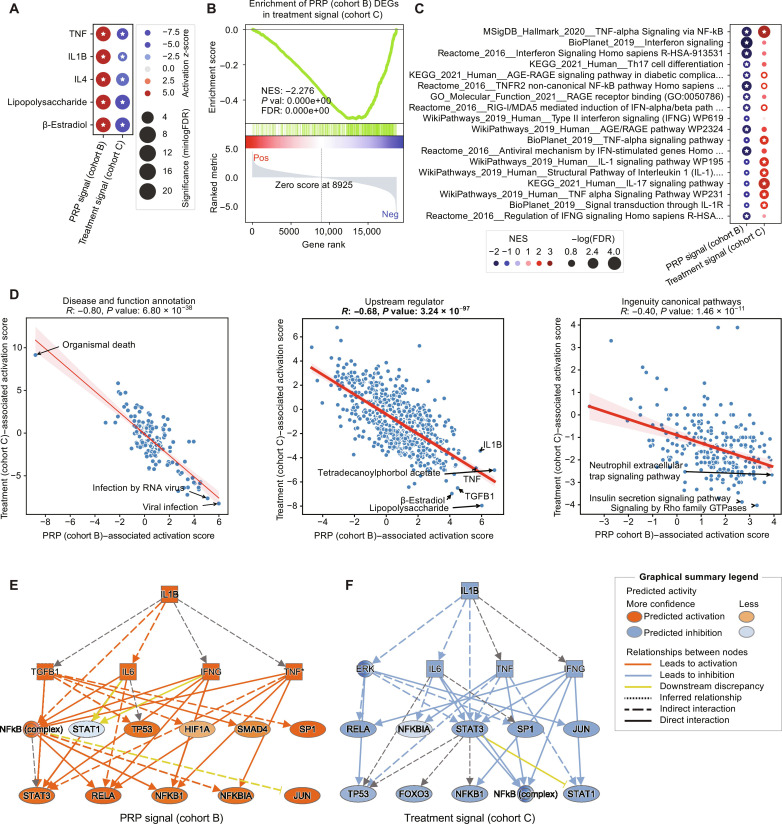
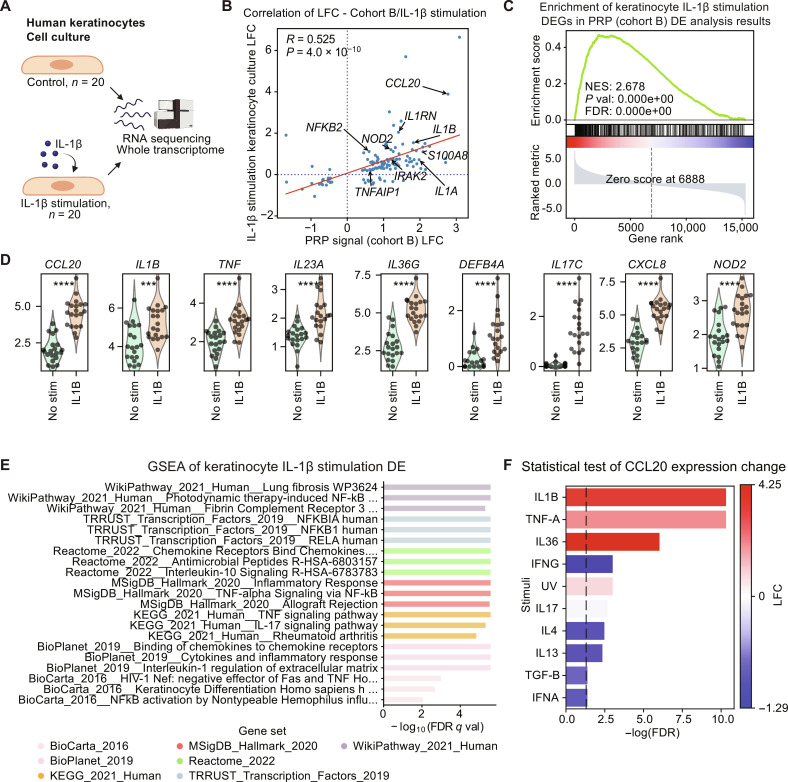
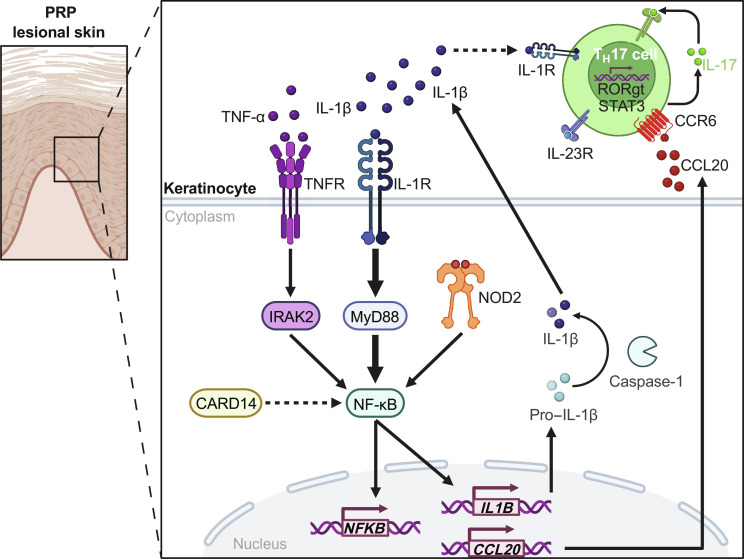
Pityriasis rubra pilaris (PRP) is a rare inflammatory skin disease with a poorly understood pathogenesis. Through a molecularly driven precision medicine approach and an extensive mechanistic pathway analysis in PRP skin samples, compared to psoriasis, atopic dermatitis, healed PRP, and healthy controls, we identified IL-1β as a key mediator, orchestrating an NF-κB-mediated IL-1β-CCL20 axis, including activation of CARD14 and NOD2. Treatment of three patients with the IL-1 antagonists anakinra and canakinumab resulted in rapid clinical improvement and reversal of the PRP-associated molecular signature with a 50% improvement in skin lesions after 2 to 3 weeks. This transcriptional signature was consistent with in vitro stimulation of keratinocytes with IL-1β. With the central role of IL-1β underscoring its potential as a therapeutic target, our findings propose a redefinition of PRP as an autoinflammatory keratinization disorder. Further clinical trials are needed to validate the efficacy of IL-1β antagonists in PRP.


Figures

Fig. 1.
Fig. 1.. Comparative transcriptomic analysis across PRP versus other cutaneous inflammatory diseases.
(A) Study overview. This study uses three transcriptomic cohorts to elucidate the molecular mechanisms of PRP. Cohort A explores the transcriptomic landscape of PRP, alongside that of other cutaneous inflammatory diseases (psoriasis and atopic dermatitis), patients after PRP (post-PRP), and healthy controls (HCs). Cohort B explores PRP signature at the whole transcriptome level, while cohort C explores the treatment response signature. Created with Biorender.com. (B) Heatmap displaying the top differentially expressed genes (DEGs) in cohort A as determined by principal components analysis (PCA). (C) Differential gene expression analysis comparing PRP samples to all other samples in cohort A. Colored points indicate significantly DEGs (Padj < 0.05) with a log fold change greater than 1. (D) Boxplots demonstrating the expression (log10 counts) of selected genes across different disease types (cohort A). (E) Scatter plot correlating selected gene expression in PRP and post-PRP samples with corresponding PASI scores (cohort A). PRP (n = 13), post-PRP (n = 8), psoriasis (PSO; n = 6), AD (n = 7), and HC (n = 8). (F) Spider plots representing selected genes across different diseases. The median expression for each group was calculated and normalized to the maximum values per gene.
Fig. 2.
Fig. 2.. Deep analysis of PRP biopsy RNA-seq data identifying a PRP molecular network with a central role of IL-1 signaling and IL-1β.
(A) Top five activated IPA upstream regulators from paired PRP versus control differential expression (DE) analysis, in untreated patients (cohort B). (B) Correlation analysis network from cohort B. Genes are colored by clusters. Cluster 1 contains IL1B. (C) Distribution of PRP DEGs across the 10 correlation clusters. The numbers on the bars are the numbers of genes in each cluster having significant DE in PRP (Padj < 0.05). The scale of the y axis is the percentage of genes in that cluster that had significant DE in PRP (Padj < 0.05). (D) Volcano plot of PRP DE results of genes belonging to the correlation cluster 1. Red: logFC >1, Padj < 0.05. (E) GSEA of PRP versus control DE for correlation cluster 1 (gene set, module 1 genes; DE, PRP signal; cohort B). NES, normalized enrichment score. (F) Correlation cluster 1 overrepresentation analysis (ORA; gene set enrichment), in GO molecular function (top plot), and GO biological process (bottom plot). GO, gene ontology. (G) STRING protein-protein interaction (PPI) network analysis for the correlation cluster 1 genes, with zoom-in to the two main PPI subclusters. Zoomed-out image is in fig. S3F.
Fig. 3.
Fig. 3.. Clinical course of patients during anti–IL-1 treatment.
(A and B) Patient 1 before (A, week 0) and during (B, week 12) anakinra treatment. (C) ΔPASI improvement (%) during anakinra treatment in patients 1 to 3. Dose of 100 mg/day from weeks 0 to 6 and of 200 mg/days from weeks 6 to 12. P1, patient 1; P2, patient 2; P3, patient 3. (D to F) Treatment course of all three patients, with respective PASI score. The time course started at the beginning of anakinra treatment. Anakinra, 100 or 200 mg/day (gray shade). Canakinumab, 150 mg/month (purple). Patient 1 was treated with many biologics, but only anakinra and canakinumab proved effective (D). Patient 2 was successfully treated with anakinra (E). Patient 3 saw a positive response under both anakinra and canakinumab (F). (G) Representative hematoxylin and eosin staining from weeks 0 and 8 in patients 1 to 3. (H) Representative IL-1β immunofluorescence stainings from weeks 0 and 8 in patients 1 to 3. Scale bars, 100 μm. DAPI, 4′,6-diamidino-2-phenylindole. (I) Changes in acanthosis in all patients during treatment from weeks (wk) 0 and 8 (*P ≤ 0.05, **P ≤ 0.01, and ****P ≤ 0.0001). (J) Changes in papillomatosis index in all patients during treatment from weeks 0 and 8. (K) Mean fluorescence intensity (MFI) of IL-1β expression from the three patients, in lesional skin before and after treatment. *P ≤ 0.05, **P ≤ 0.01, and ****P ≤ 0.0001.
Fig. 4.
Fig. 4.. Anti–IL-1β treatment–associated PRP transcriptional signature reversion.
(A) Comparison of top PRP-associated IPA upstream regulators in PRP signal (cohort B) and treatment signal (cohort C). (B) GSEA with significant DEGs from PRP signal (cohort B) and treatment signal (cohort C) DE analysis. Pos, positive; Neg, negative. Here, PRP signal–associated genes with FDR < 0.05 and LFC > 0 constitute the gene set on which GSEA is run. (C) GSEA results of pathways of interest in PRP signal (cohort B) and treatment signal (cohort C). (D) Comparison of activation score of IPA enrichment (left to right: disease/function annotations, upstream regulators, and IPA canonical pathways), which are predicted to be associated with both PRP signal (cohort B) and treatment signal (cohort C). GTPases, guanosine triphosphatases. Pearson correlation and associated P values are calculated. (E) IPA upstream regulator mechanistic network of IL1B in PRP signal (cohort B). (F) IPA upstream regulator mechanistic network of IL1B in treatment signal (cohort C).
Fig. 5.
Fig. 5.. IL-1β as a key element of the PRP pathogenesis mechanism.
(A) Keratinocyte cultures derived from human samples were stimulated with IL-1β. RNA-seq was performed on 20 control and stimulated experiments, enabling the exploration of the transcriptomic response of human keratinocytes to IL-1β stimulation. Created with Biorender.com. (B) Correlation of logFC values for genes that are significantly DE (Padj < 0.05) both in IL-1β stimulation and PRP (cohort B). Regression line is shown in red. The correlation was significant with R = 0.525 and P = 4.0 × 10⁻¹⁰. (C) GSEA results of positively DEGs with keratinocyte IL-1β stimulation (forming a gene set) on PRP (cohort B) DE results. (D) Expression distribution of CCL20, IL1B, TNF, IL23A, IL36G, DEFB4A, IL17C, CXCL8, and NOD2 in keratinocyte cultures, with (IL1B) or without IL-1β stimulation (No stim). *P ≤ 0.05, **P < 0.01, ***P < 0.001, and ****P < 0.0001. (E) Associated GSEA results of keratinocyte IL-1β stimulation DE. (F) Statistical test of CCL20 expression change. Significance of CCL20 expression differences across various stimuli compared to no stimulation using paired t test. The x axis displays the −log10(FDR) with a significance threshold at FDR = 0.05, represented by a dashed line. Color indicates stimulation associated with the expression log fold change (LFC). Bars surpassing the line are statistically significant.
Fig. 6.
Fig. 6.. Proposed pathophysiology of PRP.
In keratinocytes, IL-1β signaling through MyD88 activates the NF-κB pathway. Concurrently, activation of this pathway can take place via TNF-α signaling via IRAK2 or directly from NOD2 and CARD14. As a result, there is an up-regulated expression of CCL20, leading to its secretion, and pro–IL-1β, which is potentially cleaved by caspase-1 into its active form, IL-1β, for secretion. The secreted IL-1β binds in a feed-forward loop to its own receptors. The secreted CCL20 attracts TH17 cells to the keratinocytes through CCR6 binding. IL-1β also can activate TH17 cells. In this setting, IL-1β would induce not only its own production but also CCL20 production to further attract TH17 cells, as well as directly activate these TH17 cells. Created with Biorender.com.

Similar articles

Cited by

References

    1. Kromer C., Sabat R., Celis D., Mössner R., Systemic therapies of pityriasis rubra pilaris: A systematic review. J. Dtsch. Dermatol. Ges. 17, 243–259 (2019). - PubMed
    1. Roenneberg S., Biedermann T., Pityriasis rubra pilaris: Algorithms for diagnosis and treatment. J. Eur. Acad. Dermatol. Venereol. 32, 889–898 (2018). - PubMed
    1. Haynes D., Strunck J. L., Topham C. A., Ortega-Loayza A. G., Kent G., Cassidy P. B., Hu R., Choate K., Wang Z., Liu Y., Greiling T. M., Evaluation of Ixekizumab treatment for patients with pityriasis rubra pilaris: A single-arm trial. JAMA Dermatol. 156, 668–675 (2020). - PMC - PubMed
    1. Boudreaux B. W., Pincelli T. P., Bhullar P. K., Patel M. H., Brumfiel C. M., Li X., Heckman M. G., Pittelkow M. R., Mangold A. R., Sluzevich J. C., Secukinumab for the treatment of adult-onset pityriasis rubra pilaris: A single-arm clinical trial with transcriptomic analysis. Br. J. Dermatol. 187, 650–658 (2022). - PubMed
    1. Iredale H. E., Meggitt S. J., Photosensitive pityriasis rubra pilaris. Clin. Exp. Dermatol. 31, 36–38 (2006). - PubMed

MeSH terms