. 2024 Jul 2;14(1):15099.
doi: 10.1038/s41598-024-66078-x.

Boiling histotripsy exhibits anti-fibrotic effects in animal models of liver fibrosis

Affiliations

Boiling histotripsy exhibits anti-fibrotic effects in animal models of liver fibrosis

Chanmin Joung et al. Sci Rep. .

Abstract

Liver fibrosis is a hallmark of chronic liver disease which could lead to liver cirrhosis or liver cancer. However, there is currently lack of a direct treatment for liver fibrosis. Boiling histotripsy (BH) is an emerging non-invasive high-intensity focused ultrasound technique that can be employed to mechanically destruct solid tumour at the focus via acoustic cavitation without significant adverse effect on surrounding tissue. Here, we investigated whether BH can mechanically fractionate liver fibrotic tissue thereby exhibiting an anti-fibrotic effect in an animal model of liver fibrosis. BH-treated penumbra and its identical lobe showed reduced liver fibrosis, accompanied by increased hepatocyte specific marker expression, compared to the BH-untreated lobe. Furthermore, BH treatment improved serological liver function markers without notable adverse effects. The ability of BH to reduce fibrosis and promote liver regeneration in liver fibrotic tissue suggests that BH could potentially be an effective and reliable therapeutic approach against liver fibrosis.

Keywords: Acoustic cavitation; Anti-fibrotic treatment; Boiling histotripsy; High intensity focused ultrasound; Liver fibrosis; Liver regeneration.


Conflict of interest statement

The authors declare no competing interests.

Figures
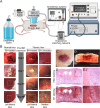
Figure 1
Figure 1
(A) A schematic diagram of the experimental setup for boiling histotripsy (BH) treatment. HIFU; high intensity focused ultrasound. (B) Chronological gross morphological changes of both normal and fibrotic liver tissue on days 0, 7, 21 and 90 after the BH treatment. The square with broken line indicates BH-treated regions. (Scale bar, 5 mm). (C–D) Gross and cross-sectional images of fibrotic liver tissues after BH treatment on Day 0. (C) Top view of BH-treated fibrotic liver tissue after cardiac perfusion. The broken line indicates a cross–section line for histological observation. (Scale bar, 10 mm). (D) Cross section of BH-treated fibrotic liver tissue after cardiac perfusion. (Scale bar, 10 mm). (E–F) Histological images of (E) haematoxylin and eosin (H&E) or (F) Masson’s trichrome–stained liver tissues collected on Day 0. (Scale bar, 1 mm). Images (i) show the highlighted areas (between BH-treated and untreated areas) in (E to F, enclosed by a square with broken lines) at higher magnifications. (Scale bar, 250 µm; magnification ×100).
Figure 2
Figure 2
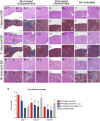
Cross sectional images of the fibrotic liver tissues after BH treatment. (A–R) Histological images of (A–C, G–I, M–O) haematoxylin and eosin (H&E) or (D–F, J–L, P–R) Masson’s trichrome stained liver tissues collected on days 7, 21, and 90 after the BH treatment. (A, D, G, J, M, P) BH-treated region in the left lateral lobe (LLL). (B, E, H, K, N, Q) The BH-unaffected region in the BH-treated LLL. (C, F, I, L, O, R) BH–untreated median lobe (ML). (Scale bar, 1 mm). Images (c), (p), and (i) show the highlighted areas in (A to R, square with broken lines) at higher magnifications. (Scale bar, 250 µm; magnification ×100). c: BH-treated core, p: BH-treated penumbra. (S) Liver fibrosis index score for each region of fibrotic liver samples at days 7, 21, and 90 after the BH treatment. n = 6 for sham, n = 6 for Day 7, n = 5 for Day 21, n = 3 for Day 90. All values are shown as means ± standard deviation (SD, #P < 0.05 vs. BH-untreated (ML) of each time point).
Figure 3
Figure 3
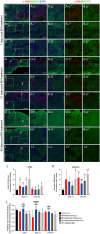
Clearance of myelofibroblasts and replenishment of lost hepatocytes after BH treatment. (A–I) Representative immunohistochemistry images of myelofibroblasts (α–SMA) and hepatocytes (ASGR1) in the cross–sectioned liver tissues collected on days 7, 21, and 90 after the BH. (A, D, G) BH-treated region in the LLL. (B, E, H) The BH-unaffected region in the BH-treated LLL. (C, F, I) BH-untreated ML. (Scale bar, 1 mm). Images (c′), (p′), (i′), and (ii′) show the highlighted areas in (A to I, square with broken lines) at higher magnifications with three channels (Red, Green, and Blue). Images (c″), (p″), (i″), and (ii″) show the highlighted areas in (A to I, square with broken lines) at higher magnifications with two channels (Red and Green). (Scale bar, 250 µm; magnification ×100). c: BH-treated core, p: BH-treated penumbra, i: severe fibrotic region, ii: mild fibrotic region. (J) Transcriptome levels of α-SMA for each region of the fibrotic liver at days 21 and 90 after the BH treatment. n = 6 for sham, n = 6 for Day 21, n = 4 for Day 90. (K) Transcriptome levels of Vimentin for each region of the fibrotic liver at days 21 and 90 after the BH treatment. n = 5 for sham, n = 8 for Day 21, n = 5 for Day 90. (L) Quantification of the fluorescence intensity of ASGR1 in each region of fibrotic liver samples at days 7, 21, and 90 after the BH treatment. n = 20 for sham, Day 7: n = 8 for BH-treated core (LLL), n = 14 for BH-treated penumbra (LLL), n = 26 for BH-treated identical lobe (LLL), n = 34 for BH-untreated (ML), Day 21: n = 4 for BH–treated core (LLL), n = 22 for BH-treated penumbra (LLL), n = 20 for BH-treated identical lobe (LLL), n = 37 for BH-untreated (ML), Day 90: n = 9 for BH-treated core (LLL), n = 26 for BH-treated penumbra (LLL), n = 47 for BH-treated identical lobe (LLL), n = 40 for BH-untreated (ML). All values are shown as means ± SD (P < 0.05 vs. Sham (LLL), ††P < 0.01 vs. Sham (LLL), †††P < 0.001 vs. Sham (LLL), *P < 0.05 vs. BH-treated core (LLL) of each time point, **P < 0.01 vs. BH-treated core (LLL) of each time point, ***P < 0.001 vs. BH–treated Core (LLL) of each time point, §P < 0.05 vs. BH-treated identical lobe (LLL) of each time point, §§P < 0.01 vs. BH-treated identical lobe (LLL) of each time point, §§§P < 0.001 vs. BH-treated identical lobe (LLL) of each time point, #P < 0.05 vs. BH-untreated (ML) of each time point, ##P < 0.01 vs. BH-untreated (ML) of each time point, ###P < 0.001 vs. BH-untreated (ML) of each time point).
Figure 4
Figure 4
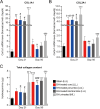
Collagen expression in fibrotic liver after BH treatment. (A) Transcriptome levels of collagen type I for each region of fibrotic liver at days 21, and 90 after the BH-treatment. n = 5 for sham, n = 6 for Day 21, n = 4 for Day 90. (B) Transcriptome levels of collagen type III for each region of fibrotic liver at days 21, and 90 after the BH-treatment. n = 6 for sham, n = 6 for Day 21, n = 4 for Day 90. (C) Quantification of the total collagen contents in each region of fibrotic liver at days 21 and 90 after the BH treatment. n = 6 for sham, n = 4 for Day 21, n = 4 for Day 90. All values are shown as means ± SD (P < 0.05 vs. Sham (LLL), ††P < 0.01 vs. Sham (LLL), †††P < 0.001 vs. Sham (LLL), #P < 0.05 vs. BH-untreated (ML) of each time point, ##P < 0.01 vs. BH-untreated (ML) of each time point, ###P < 0.001 vs. BH-untreated (ML) of each time point).
Figure 5
Figure 5
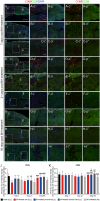
Replenishment of lost hepatocytes and inflammatory response after the BH treatment. (A–I) Representative immunohistochemistry images of hepatocytes (CD26) and CD68 positive cells in the cross–sectioned liver tissues collected on days 7, 21, and 90 after the BH. (A, D, G) BH-treated region in the LLL. (B, E, H) BH-unaffected region in the BH-treated LLL. (C, F, I) BH-untreated ML. (Scale bar, 1 mm). Images (c′), (p′), (i′), and (ii′) show the highlighted areas in (A to I, square with broken line) at higher magnifications with three channels (Red, Green, and Blue). Images (c″), (p″), (i″), and (ii″) show the highlighted areas in (A to I, square with broken line) at higher magnifications with two channels (Red and Green). (Scale bar, 250 µm; magnification ×100). c: BH-treated core, p: BH-treated penumbra, i: severe fibrotic region, ii: mild fibrotic region. (J and K) Quantification of the fluorescence intensity of CD26 and CD68 in each region of fibrotic liver samples at days 7, 21, and 90 after the BH treatment. n = 31 for sham, Day 7: n = 8 for BH-treated core (LLL), n = 19 for BH-treated penumbra (LLL), n = 55 for BH-treated identical lobe (LLL), n = 54 for BH-untreated (ML), Day 21: n = 5 for BH–treated core (LLL), n = 13 for BH-treated penumbra (LLL), n = 28 for BH-treated identical lobe (LLL), n = 25 for BH-untreated (ML), Day 90: n = 10 for BH-treated core (LLL), n = 21 for BH-treated penumbra (LLL), n = 54 for BH-treated identical lobe (LLL), n = 58 for BH-untreated (ML). All values are shown as means ± SD (*P < 0.05 vs. BH-treated core (LLL) of each time point, **P < 0.01 vs. BH-treated core (LLL) of each time point, ***P < 0.001 vs. BH-treated core (LLL) of each time point, §§§P < 0.001 vs. BH-treated identical lobe (LLL) of each time point, #P < 0.05 vs. BH-untreated (ML) of each time point, ##P < 0.01 vs. BH-untreated (ML) of each time point, ###P < 0.001 vs. BH-untreated (ML) of each time point).
Figure 6
Figure 6
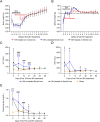
Recovery of surrogate markers of liver injury and body weight after TAA-induced liver fibrosis and BH treatment. (A) Changes in body weight after TAA-induced liver fibrosis and BH treatment. Week −4 to −1: n = 8 for BH-untreated fibrotic liver, n = 13 for BH-treated on fibrotic liver, Week 0 to 3: n = 9 for BH-treated on normal liver, n = 8 for BH-untreated fibrotic liver, n = 13 for BH-treated on fibrotic liver, Week 4 to 6: n = 9 for BH-treated on normal liver, n = 0 for BH-untreated fibrotic liver, n = 13 for BH-treated on fibrotic liver, Week 7 to 13: n = 9 for BH-treated on normal liver, n = 0 for BH-untreated fibrotic liver, n = 10 for BH-treated on fibrotic liver. Data are presented as means ± SD. One–way ANOVA followed by a post-hoc Tukey’s test was used. No significant change was observed. (B) Changes in body weight differences during a week (ΔBody weight: Week n + 1 body weight − Week n body weight) after TAA-induced liver fibrosis and BH treatment. (C–E) Changes in serum AST, ALT, and direct bilirubin in response to TAA-induced liver fibrosis and BH treatment. Day 0 to 14: n = 4 for Sham, n = 8 for BH–untreated fibrotic liver, n = 24 for BH-treated on fibrotic liver, Day 21: n = 4 for Sham, n = 8 for BH-untreated fibrotic liver, n = 22 for BH-treated on fibrotic liver, Day 21: n = 4 for Sham, n = 8 for BH-untreated fibrotic liver, n = 22 for BH-treated on fibrotic liver, Day 28: n = 4 for Sham, n = 0 for BH-untreated fibrotic liver, n = 13 for BH-treated on fibrotic liver, Day 45 to 90: n = 4 for Sham, n = 0 for BH-untreated fibrotic liver, n = 6 for BH-treated on fibrotic liver. All values are shown as means ± SD (P < 0.05 vs. Sham, ††P < 0.01 vs. Sham, †††P < 0.001 vs. Sham, #P < 0.05 vs. BH-untreated fibrotic liver, ###P < 0.001 vs. BH-untreated fibrotic liver).

Similar articles

References

    1. Higashi T, Friedman SL, Hoshida Y. Hepatic stellate cells as key target in liver fibrosis. Adv. Drug. Deliv. Rev. 2017;121:27–42. doi: 10.1016/j.addr.2017.05.007. - DOI - PMC - PubMed
    1. Iredale JP. Models of liver fibrosis: Exploring the dynamic nature of inflammation and repair in a solid organ. J. Clin. Invest. 2007;117:539–548. doi: 10.1172/JCI30542. - DOI - PMC - PubMed
    1. Tsochatzis EA, Bosch J, Burroughs AK. Liver cirrhosis. Lancet. 2014;383:1749–1761. doi: 10.1016/S0140-6736(14)60121-5. - DOI - PubMed
    1. GBD 2015 Risk Factors Collaborators Global, regional, and national comparative risk assessment of 79 behavioural, environmental and occupational, and metabolic risks or clusters of risks, 1990–2015: A systematic analysis for the Global Burden of Disease Study 2015. Lancet. 2016;388:1659–1724. doi: 10.1016/S0140-6736(16)31679-8. - DOI - PMC - PubMed
    1. Xi Y, et al. The anti-fibrotic drug pirfenidone inhibits liver fibrosis by targeting the small oxidoreductase glutaredoxin-1. Sci. Adv. 2021;7:eabg9241. doi: 10.1126/sciadv.abg9241. - DOI - PMC - PubMed