Intrinsically Disordered Membrane Anchors of Rheb, RhoA, and DiRas3 Small GTPases: Molecular Dynamics, Membrane Organization, and Interactions
- PMID: 38942776
- PMCID: PMC11265623
- DOI: 10.1021/acs.jpcb.4c01876
Intrinsically Disordered Membrane Anchors of Rheb, RhoA, and DiRas3 Small GTPases: Molecular Dynamics, Membrane Organization, and Interactions
Abstract
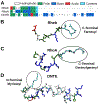
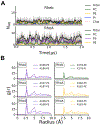
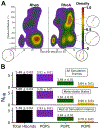
Protein structure has been well established to play a key role in determining function; however, intrinsically disordered proteins and regions (IDPs and IDRs) defy this paradigm. IDPs and IDRs exist as an ensemble of structures rather than a stable 3D structure yet play essential roles in many cell-signaling processes. Nearly all Ras superfamily GTPases are tethered to membranes by a lipid tail at the end of a flexible IDR. The sequence of the IDR is a key determinant of membrane localization, and interaction between the IDR and the membrane has been shown to affect signaling in RAS proteins through the modulation of dynamic membrane organization. Here, we utilized atomistic molecular dynamics simulations to study the membrane interaction, conformational dynamics, and lipid sorting of three IDRs from small GTPases Rheb, RhoA, and DiRas3 in model membranes representing their physiological target membranes. We found that complementarity between the lipidated IDR sequence and target membrane lipid composition is a determinant of conformational plasticity. We also show that electrostatic interactions between anionic lipids and basic residues on IDRs are correlated with sampling of semistable conformational substates, and lack of these interactions is associated with greater conformational diversity. Finally, we show that small GTPase IDRs with a polybasic domain alter local lipid composition by segregating anionic lipids and, in some cases, excluding other lipids from their immediate vicinity in favor of anionic lipids.
Conflict of interest statement
The authors declare no competing financial interest.
Figures


Update of
-
Intrinsically disordered membrane anchors of Rheb, RhoA and DiRas3 small GTPases: Molecular dynamics, membrane organization, and interactions.bioRxiv [Preprint]. 2024 Apr 28:2024.04.25.591151. doi: 10.1101/2024.04.25.591151. bioRxiv. 2024. Update in: J Phys Chem B. 2024 Jul 11;128(27):6518-6528. doi: 10.1021/acs.jpcb.4c01876 PMID: 38712287 Free PMC article. Updated. Preprint.
Similar articles
-
From disorder comes function: Regulation of small GTPase function by intrinsically disordered lipidated membrane anchor.Curr Opin Struct Biol. 2024 Aug;87:102869. doi: 10.1016/j.sbi.2024.102869. Epub 2024 Jun 28. Curr Opin Struct Biol. 2024. PMID: 38943706 Free PMC article. Review.
-
Intrinsically disordered membrane anchors of Rheb, RhoA and DiRas3 small GTPases: Molecular dynamics, membrane organization, and interactions.bioRxiv [Preprint]. 2024 Apr 28:2024.04.25.591151. doi: 10.1101/2024.04.25.591151. bioRxiv. 2024. Update in: J Phys Chem B. 2024 Jul 11;128(27):6518-6528. doi: 10.1021/acs.jpcb.4c01876 PMID: 38712287 Free PMC article. Updated. Preprint.
-
Conformational ensemble-dependent lipid recognition and segregation by prenylated intrinsically disordered regions in small GTPases.Commun Biol. 2023 Nov 2;6(1):1111. doi: 10.1038/s42003-023-05487-6. Commun Biol. 2023. PMID: 37919400 Free PMC article.
-
The RIT1 C-terminus associates with lipid bilayers via charge complementarity.Comput Biol Chem. 2021 Apr;91:107437. doi: 10.1016/j.compbiolchem.2021.107437. Epub 2021 Jan 19. Comput Biol Chem. 2021. PMID: 33517146
-
Features of molecular recognition of intrinsically disordered proteins via coupled folding and binding.Protein Sci. 2019 Nov;28(11):1952-1965. doi: 10.1002/pro.3718. Epub 2019 Sep 4. Protein Sci. 2019. PMID: 31441158 Free PMC article. Review.
Cited by
-
From disorder comes function: Regulation of small GTPase function by intrinsically disordered lipidated membrane anchor.Curr Opin Struct Biol. 2024 Aug;87:102869. doi: 10.1016/j.sbi.2024.102869. Epub 2024 Jun 28. Curr Opin Struct Biol. 2024. PMID: 38943706 Free PMC article. Review.
References
-
- Oldfield CJ; Dunker AK Intrinsically Disordered Proteins and Intrinsically Disordered Protein Regions. Annu. Rev. Biochem 2014, 83, 553–584. - PubMed
-
- Iakoucheva LM; Brown CJ; Lawson JD; Obradović Z; Dunker AK Intrinsic Disorder in Cell-Signaling and Cancer-Associated Proteins. J. Mol. Biol 2002, 323 (3), 573–584. - PubMed
MeSH terms
Substances
Grants and funding
LinkOut - more resources
Full Text Sources

