Review
. 2024 Sep:312:107285.
doi: 10.1016/j.bpc.2024.107285. Epub 2024 Jun 25.

Understanding the structural dynamics of human islet amyloid polypeptide: Advancements in and applications of ion-mobility mass spectrometry

Affiliations
Review

Understanding the structural dynamics of human islet amyloid polypeptide: Advancements in and applications of ion-mobility mass spectrometry

Zijie Dai et al. Biophys Chem. 2024 Sep.

Abstract

Human islet amyloid polypeptide (hIAPP) forms amyloid deposits that contribute to β-cell death in pancreatic islets and are considered a hallmark of Type II diabetes Mellitus (T2DM). Evidence suggests that the early oligomers of hIAPP formed during the aggregation process are the primary pathological agent in islet amyloid induced β-cell death. The self-assembly mechanism of hIAPP, however, remains elusive, largely due to limitations in conventional biophysical techniques for probing the distribution or capturing detailed structures of the early, structurally dynamic oligomers. The advent of Ion-mobility Mass Spectrometry (IM-MS) has enabled the characterisation of hIAPP early oligomers in the gas phase, paving the way towards a deeper understanding of the oligomerisation mechanism and the correlation of structural information with the cytotoxicity of the oligomers. The sensitivity and the rapid structural characterisation provided by IM-MS also show promise in screening hIAPP inhibitors, categorising their modes of inhibition through "spectral fingerprints". This review delves into the application of IM-MS to the dissection of the complex steps of hIAPP oligomerisation, examining the inhibitory influence of metal ions, and exploring the characterisation of hetero-oligomerisation with different hIAPP variants. We highlight the potential of IM-MS as a tool for the high-throughput screening of hIAPP inhibitors, and for providing insights into their modes of action. Finally, we discuss advances afforded by recent advancements in tandem IM-MS and the combination of gas phase spectroscopy with IM-MS, which promise to deliver a more sensitive and higher-resolution structural portrait of hIAPP oligomers. Such information may help facilitate a new era of targeted therapeutic strategies for islet amyloidosis in T2DM.

Keywords: Amylin; IAPP; Ion-mobility mass spectrometry; Mass spectrometry; Protein aggregation; Type-II diabetes Mellitus.


Conflict of interest statement

Declaration of competing interest The authors declare that they have no known competing financial interests or personal relationships that could have appeared to influence the work reported in this paper.

Figures

Figure 1
Figure 1
The sequence of Prepro-IAPP, proIAPP and mature IAPP. The primary sequence of mature IAPP is highlighted in red. The disulphide bond between the Cysteine 2 and Cysteine 7 is also shown in the mature IAPP sequence and the C-terminal amidation is shown. Processing of Pro-IAPP to produce IAPP involves multiple steps and multiple enzymes.
Figure 2
Figure 2
Sequence of human IAPP (hIAPP), S20G mutant of hIAPP and rat IAPP. Differences in the residues of S20G-hIAPP and rIAPP, relative to the hIAPP sequence, are highlighted in red.
Figure 3.
Figure 3.
Schematic illustration of hIAPP amyloid formation. The soluble hIAPP monomers can first assemble into oligomeric intermediates through primary nucleation and elongation. Secondary oligomer formation becomes dominant when a critical amount of fibril is formed, whereby the surface of pre-formed fibrils plays a catalytical role in promoting IAPP oligomer formation. Oligomers can further convert and elongate into fibrils, or the oligomers may potentially dissociate into monomers as reported by Michaels et al. using a similar aggregate system. However, experimental data for IAPP oligomers dissociation into monomers by a spontaneous process requires further investigation (67). This figure is patterned after those reported in Camargo et al. and Michaels et al. (70). Copyright © 2020 Thomas C. T. Michaels et al. under exclusive license to Springer Nature Limited.
Figure 4
Figure 4
Schematic illustration of Ion-mobility separation. Top Panel: Ions of the same m/z are separated based on their conformation. The ion with a more extended conformation (blue) experiences more collisions with the buffer gas in the drift tube than the compact ion (purple), resulting in a longer arrival time. Bottom Panel: Ions of the same m/z are separated based on their oligomeric state. Ions with a higher charge state (annotated as 2n+) experience stronger interactions with the electric field, leading to a shorter arrival time compared to ions with a lower charge state (annotated as n+)
Figure 5
Figure 5
Representative applications and utility of extracted collision cross-section (CCS) measurements. (a) CCS values are plotted against the mass-to-charge (m/z) ratio, delineating the conformational space of diverse biomolecular classes. (b) Correlation of CCS values with oligomeric state (n), with the data fitted to compare against models of fibril growth (depicted by a black solid line) and isotropic growth (shown by a cyan solid line), facilitating the differentiation of oligomer shapes during formation. (c) Driftscope plots from ESI-IM-MS display drift time distributions and relative intensity for the compounds identified. (d) CIU (Collision Induced Unfolding) heatmaps from ESI-IM-MS chart the drift time against an ascending collision voltage (V), typically employed to probe the structural stability of protein ions and their conformational shifts. Figures are re-plotted to demonstrate methods reported in the referenced work (96, 98, 99, 107, 108). Figure 5 (a) is patterned with permission from Anal Bioanal Chem. 2009 May; 394(1): 235–244DOI:10.1007/s00216-009-2666-3. Copyright © 2009, Springer-Verlag. Figure 5 (b) is reprinted with permission from Nat Chem. 2011 February; 3(2): 172–177. doi:10.1038/nchem.945. Copyright © 2010, Springer Nature Limited. Figure 5 (c) is reprinted with permission from Anal. Chem. 2014, 86, 21, 10674–10683. DOI: 10.1021/ac502593n. Copyright © 2014 American Chemical Society. Figure 5 (d) is adapted with permission from Chemical Reviews 2023 123 (6), 2902–2949. DOI: 10.1021/acs.chemrev.2c00600. Copyright © 2023 Emilia Christofi and Perdita Barran.
Figure 6
Figure 6
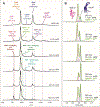
The ATD of 50 μM hIAPP N-terminal fragment variants at pH 7.4. The WT N-terminal fragment, reduced fragment and the cysteine-to-Serine mutant are represented in blue, green and orange colours, respectively. The peaks are assigned as charge state/oligomer number (z/n). The CCS values for each peak are also shown. J Reprinted with permission from Journal of the American Society for Mass Spectrometry 2016 27 (6), 1010–1018. DOI: 10.1007/s13361-016-1347-7. Copyright 2016 American Chemical Society.
Figure 7.
Figure 7.
The effect of proline substitution on the amyloid formation. (A) The temporal aggregation profile of hIAPP and its variants with single proline substitution, as tracked by ThT fluorescence intensity: hIAPP-WT (black), IAPPA25P (cyan), IAPPS28P (blue), and IAPPS29P (red). (B) The temporal aggregation profile of hIAPP and double proline substitution variants, as determined by ThT fluorescence intensity: hIAPP-WT (black), IAPPA25P S28P(purple), IAPPA25P S29P (green) and IAPPS28P S29P (orange). (C) ESI-MS spectrum of the hIAPP and proline substitution variants, annotated with their respective oligomeric (n) and ionic (z) states, denoted as nz+. Adapted with permission from ACS Chemical Biology 2020 15 (6), 1408–1416. DOI: 10.1021/acschembio.9b01050. Copyright 2020 American Chemical Society.
Figure 8.
Figure 8.
(A) IM-MS mass spectra of hIAPP under varying zinc concentrations. A shift is observed as the zinc ratio increases. (B) The ATD of the 993 m/z peak under varying zinc ratio. Higher zinc concentration increases the abundance of a more extended hIAPP conformation (746 Å2). Reprinted with permission from The Journal of Physical Chemistry B 2018 122 (43), 9852–9859. DOI: 10.1021/acs.jpcb.8b06206. Copyright 2018 American Chemical Society.
Figure 9
Figure 9
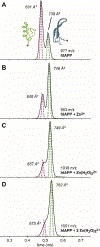
The ATDs of monomeric 1/+4 hIAPP in the mixture of different types of zinc adducts at a concentration of 50:1 Zn2+/hIAPP. (A) hIAPP alone, (B) hIAPP with anhydrous Zn2+, the peak shift towards an increased abundance of the more extended hIAPP conformation, (C, D) hIAPP with hydrated zinc adducts result in more significant peak shift. Reprinted with permission from The Journal of Physical Chemistry B 2018 122 (43), 9852–9859. DOI: 10.1021/acs.jpcb.8b06206. Copyright 2018 American Chemical Society.
Figure 10
Figure 10
ESI-mass spectra and ESI-IM-MS Driftscope plots for hIAPP variants. The oligomeric state (n) and charge state (z) are labelled as nz+. The mass spectrum of different IAPP variants exhibits predominantly +2 and +3 monomers and minor amounts of dimers, trimers, and tetramer (except for I26P). The ESI-IM-MS Driftscope plots illustrate the drift time and relative intensity of the oligomers identified. Reprinted with permission from Chemical Science 2017 8,5030. DOI: 10.1039/c7sc00620a. Copyright 2017 Chemical Science.
Figure 11
Figure 11
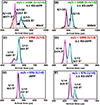
ESI-mass spectra and arrival time distributions of homo- and hetero-oligomers formed by hIAPP sequence variants. (a) The 1:1 mixture of the wildtype hIAPP and H18L variant, and the +5 charge state homo- and hetero-dimers. (*) indicates a dominant conformation. (#) represents a more compact conformation. (b) The 1:1 mixture of the wild type and I26P. The arrow highlighted the absence of the I26P homodimer. Reprinted with permission from Chemical Science 2017 8,5030. DOI: 10.1039/c7sc00620a. Copyright 2017 Chemical Science.
Figure 12
Figure 12
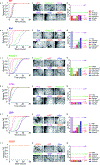
Fibrillation of the IAPP variants. (a-f) (i) The amyloid formation of hIAPP sequence variants individually and in 1:1 mixture, using ThT fluorescence for tracking, with the variants represented by distinct colours: WT (red), Rat (dark blue), +Free-CT (green), +H18L (red), +I26P (purple), and +S20G (orange). Panel (ii) presents negative stain Transmission Electron Microscopy (TEM) images of each variant’s sample after 5 days at 25 °C in a quiescent state. Panels (a-f) (iii) bar chart comparing the lag times derived from ThT fluorescence experiments for 1:1 mixtures of each variant. Reprinted with permission from Chemical Science 2017 8,5030. DOI: 10.1039/c7sc00620a. Copyright 2017 Chemical Science.
Figure 13.
Figure 13.
Arrival Time Distributions (ATDs) depict: (A) and (B) the peak signal for R3-IAPP hetero-oligomers at m/z = 1438 under drift cell injection energies of 40 eV and 100eV, respectively; (C) the +3 charge state R3-tau alone; (D) the +3 charge state R3-tau in coexistence with IAPP; (E) the +4 charge state IAPP alone; (F) the +4 charge state IAPP in coexistence with R3-tau. Reprinted with permission from ACS Chemical Neuroscience 2019 10 (11), 4757–4765. DOI: 10.1021/acschemneuro.9b00516. Copyright 2019 American Chemical Society.

Similar articles

References

    1. Kahn SE, D’Alessio DA, Schwartz MW, Fujimoto WY, Ensinck JW, Taborsky GJ, and Porte D. 1990. Evidence of cosecretion of islet amyloid polypeptide and insulin by β-cells. Nestle. Nutr. Works. Se. 39:634–638. - PubMed
    1. Lukinius A, Wilander E, Westermark GT, Engström U, and Westermark P. 1989. Co-localization of islet amyloid polypeptide and insulin in the B cell secretory granules of the human pancreatic islets. Diabetologia. 32:240–244. - PubMed
    1. Stridsberg M, Sandler S, and Wilander E. 1993. Cosecretion of islet amylid polypeptide (IAPP) and insulin from isolated rat pancreatic islets following stimulation or inhibition of β-cell function. Regul. Pept. 45:363–70. - PubMed
    1. Lutz TA. 2013. The interaction of amylin with other hormones in the control of eating. Diabetes, Obesity and Metabolism. 15:99–111. - PubMed
    1. Lutz TA. 2010. The role of amylin in the control of energy homeostasis. American Journal of Physiology - Regulatory Integrative and Comparative Physiology. 298:R1475–R1484. - PubMed

MeSH terms

Substances

LinkOut - more resources