. 2024 Oct 7;223(10):e202403115.
doi: 10.1083/jcb.202403115. Epub 2024 Jun 27.

Centrosome-organized plasma membrane infoldings linked to growth of a cortical actin domain

Affiliations

Centrosome-organized plasma membrane infoldings linked to growth of a cortical actin domain

Rebecca Tam et al. J Cell Biol. .

Abstract

Regulated cell shape change requires the induction of cortical cytoskeletal domains. Often, local changes to plasma membrane (PM) topography are involved. Centrosomes organize cortical domains and can affect PM topography by locally pulling the PM inward. Are these centrosome effects coupled? At the syncytial Drosophila embryo cortex, centrosome-induced actin caps grow into dome-like compartments for mitoses. We found the nascent cap to be a collection of PM folds and tubules formed over the astral centrosomal MT array. The localized infoldings require centrosome and dynein activities, and myosin-based surface tension prevents them elsewhere. Centrosome-engaged PM infoldings become specifically enriched with an Arp2/3 induction pathway. Arp2/3 actin network growth between the infoldings counterbalances centrosomal pulling forces and disperses the folds for actin cap expansion. Abnormal domain topography with either centrosome or Arp2/3 disruption correlates with decreased exocytic vesicle association. Together, our data implicate centrosome-organized PM infoldings in coordinating Arp2/3 network growth and exocytosis for cortical domain assembly.


Conflict of interest statement

Disclosures: The authors declare no competing interests exist.

Figures

None
Graphical abstract
Figure 1.
Figure 1.
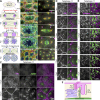
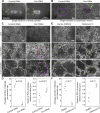
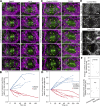
PM folds and tubules at centrosomal MTs during actin cap formation. (A) Schematics show a nascent actin cap forming above each centrosome of a telophase cortical compartment of the syncytial embryo. Subsequently, each cap expands above each daughter nucleus and grows into a dome-like compartment by metaphase of the next cycle. (B) Coexpressed markers of PM (PH-domain probe for PIP2) and mitotic spindle (Jupiter-GFP) shown from nuclear cycle 11–12 as 3D renderings of maximum intensity projections. Color-coded from apical surface (0 µm) to 10 µm below. White bracket shows PM folds across the full apical surface at prometaphase and metaphase 11 (basal pseudocleavage furrows are red and yellow). Corner brackets show PM folds restricted to apical surface domains above astral centrosomal MTs (pink arrows) at poles of anaphase and telophase 11 compartments. By prometaphase 12, each pole becomes a new compartment. (C) Z-sections show apical PM surface at 0 µm, PM infoldings at −1.5 µm above centrosomal MTs (corner brackets), and cross-sections of PM tubules at −5.8 µm amongst centrosomal MTs (curly brackets). (D) Closely spaced Z sections through one nascent cap show PM folds continuous with PM tubules (white arrows), which extend into centrosomal MTs (pink arrows). Features described in B–D seen in 10/10 embryos. (E) Z sections show the entry of extracellular dye (Dextran) in between folds and into connected tubules (arrows). Seen in 8/8 embryos. (F) Schematic of PM tubule extending from PM fold into astral centrosomal array and between ER membranes (ER imaging in Fig. 2).
Figure 2.
Figure 2.
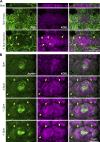
ER localization relative to nascent cap PM folds and tubules, and to centrosomal MTs. (A) Single sections of co-expressed markers of PM (a PH-domain probe for PIP3) and ER (KDEL-RFP) at telophase 11. PM folds of nascent cap (corner brackets) are mainly above ER. Arrows show PM tubules of nascent cap extending downward between ER regions. Seen in 5/5 embryos. (B) Single sections of co-expressed markers of MTs (Jupiter-GFP) and ER (KDEL-RFP) at telophase 11. Arrows show centrosomal astral MTs emanating upward through ER regions. Seen in 5/5 embryos.
Figure S1.
Figure S1.
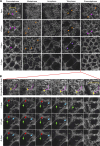
Changes to PM morphology over the cell cycle. (A) Z-sections of PIP2–positive PM from nuclear cycle 11–12. The yellow bracket shows a prometaphase compartment. Pink arrows show apical surface tubules at prometaphase. Orange arrows show PM folds at the apical periphery of prometaphase compartments, over the full surface of metaphase compartments, and restricted to the poles of telophase compartments. Purple arrows show PM tubules beneath PM folds at telophase. Corner brackets show a nascent cap at telophase. (B) Higher time resolution imaging of PIP2–positive PM from telophase 11 to prometaphase 12. 1.5 µm projections of the apical surface show movement of a PM fold (yellow arrows) to the periphery of forming compartment (purple dots and yellow bracket). Z-sections show apically directed regression of PM tubules over the same time (red, green, and blue arrows show example tubules). The features described in A and B were seen in 5/5 embryos.
Figure S2.
Figure S2.
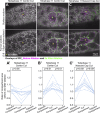
Comparison of astral centrosomal microtubule abundance, PM tubule numbers, and PM tubule depths from metaphase to telophase of cycle 11. The dataset supporting Fig. 1 B quantified. At metaphase, tubules were assessed across the folded apical domain. At anaphase and telophase, tubules were assessed across the folded nascent caps.
Figure 3.
Figure 3.
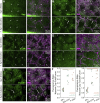
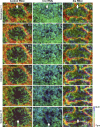
Arp2/3 pathway enrichment at PM folds and tubules of the nascent cap. (A–E) Single sections at levels of folds (0 µm) and tubules (−1.5 µm) show pathway members coexpressed with PIP2 probe at telophase 11. Corner brackets indicate nascent cap PM folds and tubules. (A) Spg-NG puncta localize at nascent cap PM folds and tubules, with the minimal signal at surrounding pseudocleavage furrows. Saturated eggshell signal at the base of Spg-NG image. 8/8 embryos. (B) Rac-GTP sensor enriches at nascent cap folds and tubules versus pseudocleavage furrows (arrows). 10/10 embryos. (C) SCAR-NG puncta localize at nascent cap folds and tubules, with minimal signal at pseudocleavage furrows. 6/6 embryos. (D) Arp3-GFP puncta localize to nascent cap folds and tubules, with minimal signal at pseudocleavage furrows. 7/7 embryos. (E) F-actin probe enriched at nascent cap folds and tubules versus lower levels at pseudocleavage furrows (arrows). 8/8 embryos. (F) Signal ratios at nascent cap folds versus pseudocleavage furrows, and tubules versus furrows, were measured at the same sites for PIP2 probe and Rac-GTP probe and for PIP2 probe and F-actin probe. Embryo values plotted.
Figure S3.
Figure S3.
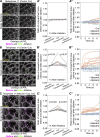
Changes to cortical localizations of Rac-GTP and SCAR from metaphase to telophase of cycle 11. (A) Single sections of coexpressed probes for Rac-GTP and PIP2 at metaphase 11, anaphase 11, and telophase 11. Arrows indicate pseudocleavage furrow surrounding the compartment. Corner brackets indicate a nascent cap at telophase. The overall signal decreases from metaphase to telophase due to photobleaching. Enrichment of Rac-GTP at apical PM folds of the nascent cap can be seen by comparing levels at apical folds to levels at pseudocleavage furrows at each stage. Seen in 7/7 embryos. (B) Signal ratios of probes for Rac-GTP and PIP2 at apical PM folds versus surrounding pseudocleavage furrows at metaphase 11, anaphase 11, and telophase 11. Both probes were measured at the same sites. (C) Single sections of co-expressed probes for SCAR and PIP2 at metaphase 11, anaphase 11, and telophase 11. Arrows indicate pseudocleavage furrow surrounding the compartment. Corner brackets indicate nascent cap at telophase. The overall signal decreases from metaphase to telophase due to photobleaching. Enrichment of SCAR at apical PM folds of the nascent cap can be seen by comparing levels at apical folds to levels at pseudocleavage furrows at each stage. Seen in 6/6 embryos.
Figure 4.
Figure 4.
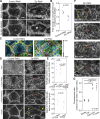
Perturbation of Cnn or dynein disrupts nascent cap PM tubules. (A) Telophase 11 live imaging of Tubulin-GFP shows reduced astral centrosomal MTs with Cnn RNAi versus control RNAi (corner brackets). Seen in 5/5 embryos each. (B) Telophase 11 live imaging of Zip-GFP shows an expanded actomyosin border (green brackets) around a smaller mitotic compartment (purple outline) of Cnn RNAi embryo versus control RNAi. Seen in 9/9 Cnn RNAi embryos and 8/8 controls. (C) Sections of PIP2 imaging at telophase 11 with control and Cnn RNAi, starting at embryo surface (0 µm). Corner brackets show nascent cap PM folds (−1.5 µm) and tubules (−3.0 µm). The purple outline shows overall telophase compartment in Cnn RNAi. The red bracket shows ectopic folds between nascent caps of Cnn RNAi compartment. Green bracket shows abnormal PM structure outside Cnn RNAi compartment. (D) Quantifications of tubule numbers and depths in embryos corresponding to C. Embryo values plotted. (E) Sections of telophase 11 PIP2 imaging in carrier control (DMSO) and Ciliobrevin D injected embryos, starting at embryo surface (0 µm). Coexpressed Jupiter-GFP (not shown) confirmed cell cycle stage. Corner brackets show nascent cap PM folds (−1.5 µm) and tubules (−3.0 µm). (F) Quantifications of tubule numbers and depths in embryos corresponding to E. Embryo values plotted.
Figure S4.
Figure S4.
Mitotic compartment apical PM folds from metaphase 11 to telophase 11 in control RNAi, Cnn RNAi, and Zip RNAi embryos. PIP2 probe color-coded by depth (scale shown). Surrounding pseudocleavage furrows are red-orange (deeper) in control RNAi and Zip RNAi, and green (shallower) in Cnn RNAi. Arrows indicate apical surfaces corresponding to the middle domain between the two nascent caps of the telophase compartment. In control RNAi, folds present in the middle of the apical domain at metaphase are lost by telophase (seen in 10/10 embryos). In Cnn RNAi, the middle of the apical domain remains folded from metaphase to telophase (seen in 8/8 embryos). In Zip RNAi, the middle of the apical domain remains folded from metaphase to telophase (seen in 10/10 embryos).
Figure S5.
Figure S5.
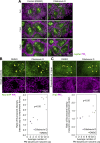
MTs, Rac-GTP, and Arp3 distributions in telophase 11 compartments following Ciliobrevin D and control injections. (A) Single sections of co-imaged PIP2 probe and Jupiter-GFP at telophase 11 following injection of Ciliobrevin D or DMSO carrier control. Yellow corner brackets show astral centrosomal MTs at nascent caps. The white bracket shows the central mitotic spindle. Seen in six embryos each. (B) Single sections of co-imaged PIP2 and Rac-GTP probes at telophase 11 following injection of Ciliobrevin D or DMSO carrier control. Corner brackets indicate nascent caps and arrows indicate surrounding pseudocleavage furrows. Graph plots nascent cap-to-furrow signal ratios versus nascent cap tubule numbers in embryos injected with Ciliobrevin D or DMSO carrier control. P value indicates significant differences both between the signal ratios and between the tubule numbers for the Ciliobrevin D and control injections. (C) 1.5-µm projections of coimaged probes for PIP2 and Arp3 at telophase 11. Corner brackets indicate nascent caps and curly bracket indicates the center domain between caps. Graph plots nascent cap-to-compartment center signal ratios versus nascent cap tubule numbers in embryos injected with Ciliobrevin D or DMSO carrier control. P value indicates significant differences both between the signal ratios and between the tubule numbers for the Ciliobrevin D and control injections.
Figure 5.
Figure 5.
Cnn is required for Arp2/3 pathway accumulation at the nascent cap. (A) Corner brackets show Rac-GTP sensor at telophase 11 nascent cap in control and Cnn RNAi. Nascent cap position is determined by imaging into interphase when abnormally small compartments form with Cnn RNAi (turquoise brackets). (B and C) Corner brackets show SCAR-NG and Arp3-GFP at telophase 11 nascent caps with control and Cnn RNAi. (D) Enrichment assay and data comparing nascent caps versus middle surface of telophase compartment. Embryo values plotted.
Figure S6.
Figure S6.
Cnn is required for F-actin enrichment to nascent caps of telophase 11 compartments. Corner brackets show minimal F-actin probe enrichment to the nascent cap relative to the middle of the telophase compartment in Cnn RNAi, in contrast to the enrichment at the nascent cap in control RNAi. Seen in 8/8 control embryos and 7/10 Cnn RNAi embryos.
Figure S7.
Figure S7.
Myosin localization in metaphase and telophase compartments of cycle 11. Single sections of embryos co-expressing Zip and PIP2 probes. At metaphase, Zip-GFP is non-cortical. At telophase, Zip-GFP accumulates at the base of pseudocleavage furrows (arrows). Seen in 5/5 embryos.
Figure 6.
Figure 6.
Mitotic compartment responses to apical surface laser cuts. (A–C) Co-expressed Jupiter-GFP (not shown) confirmed cell cycle stages. (A) Single sections of PIP2 probe before (magenta) and after laser cut (green). A cut of the center of the metaphase 11 compartment (yellow asterisk) produced minimal PM displacements at the apical surface or the pseudocleavage furrows below. Areas encompassed by pseudocleavage furrows of the cut compartment and of adjacent compartments quantified before and 9 s after the cut (A′). (B) Single sections of PIP2 probe before (magenta) and after laser cut (green). A cut of the center of the telophase 11 compartment (yellow asterisk) produced PM displacements away from the cut both at the apical surface and at the pseudocleavage furrows below (green arrows). Note that adjacent compartments translocate without apparent area change. Areas encompassed by pseudocleavage furrows of the cut compartment and of adjacent compartments quantified before and 9 s after the cut (B′). (C) Single sections of PIP2 probe before (magenta) and after laser cut (green). A cut of a nascent cap of the telophase 11 compartment (yellow asterisk) produced PM displacements away from the cut both at the apical surface and at the pseudocleavage furrows below (green arrows). Note that adjacent compartments translocate without apparent area change. Areas encompassed by pseudocleavage furrows of the cut compartment and of adjacent compartments quantified before and 9 s after the cut (C′).
Figure S8.
Figure S8.
High-time resolution analyses of mitotic compartment responses to local laser cuts. (A–C″) Single confocal section imaging of the PIP2 probe following local laser ablations, and quantifications of responses. Compartment pseudocleavage furrows overlaid before (purple) and after (green) ablation. Asterisks show cut sites. (A) Minimal response to cutting the center of a metaphase 11 compartment. (A′) Quantifications of minimal compartment area change 1 s after laser cuts of centers of metaphase 11 compartments. Neither the cut compartments nor adjacent compartments changed the area substantially, and the responses of the cut compartments were not significantly different from those of the adjacent compartments. Three interconnected dots of one cut compartment and two adjacent compartments are shown for each of the 10 embryos. (A″) Quantifications of minimal compartment area changes from 1 to 9 s after laser cuts of centers of metaphase 11 compartments. The compartments assessed in A′ were quantified second-by-second until 9 s after ablation. Neither the cut compartments nor adjacent compartments changed area substantially. (B) Green arrows show the increased area of a telophase 11 compartment from 1 to 9 s following a laser cut of its center. Note that adjacent compartments translocate without apparent area change. (B′) Quantifications 1 s after laser cutting show that telophase 11 compartments cut at their center significantly increase in area compared to adjacent compartments with minimal change. Three interconnected dots of one cut compartment and two adjacent compartments are shown for each of the 10 embryos. (B″) Quantifications of compartment area changes from 1 to 9 s after laser cuts of centers of telophase 11 compartments. The compartments assessed in B′ were quantified second-by-second until 9 s after ablation. Cut compartments continued to increase in area from 1 to 9 s, whereas adjacent compartments showed relatively low area changes. (C) Green arrows show increased area of a telophase 11 compartment from 1 to 9 s following a laser cut of one of its nascent caps. Note that adjacent compartments translocate without apparent area change. (C′) Quantifications 1 s after laser cutting show that telophase 11 compartments cut at a nascent cap significantly increase in area compared to adjacent compartments with minimal change. Three interconnected dots of one cut compartment and two adjacent compartments are shown for each of the 10 embryos. (C″) Quantifications of compartment area changes from 1 to 9 s after laser cuts of nascent caps of telophase 11 compartments. The compartments assessed in C′ were quantified second-by-second until 9 s after ablation. Cut compartments continued to increase in area from 1 to 9 s, whereas adjacent compartments showed relatively low area changes.
Figure 7.
Figure 7.
Effect of myosin on telophase compartment surface topography. (A–G) Telophase 11. (A) Single sections show PIP2 probe at pseudocleavage furrows in control and Zip RNAi embryos. Time points before and after ablation are shown. Red dot indicates the ablation site. (B) Compartment areas after ablation compared to pre-ablation areas as ratios in control and Zip RNAi embryos. Embryo values plotted. (C) Maximum intensity projections with color-coded Z-positions (scale) show PM organization detected by PIP2 probe expressed with control and Zip RNAi. The bracket shows ectopic folding between nascent caps in Zip RNAi. (D) Single sections of PIP2 probe in control and Zip RNAi embryos. Red brackets show ectopic folds between nascent caps. Yellow arrows show abnormally deep PM tubules of nascent caps. Minimal tubules were detected below the ectopic folds. Seen in 10/10 Zip RNAi embryos. (E) Quantifications of nascent cap tubule numbers and depths in control and Zip RNAi embryos. Ectopic folds of Zip RNAi embryos were also quantified for tubules. Embryo values plotted. (F) Single sections at level of PM folds show Spider-GFP, PIP2 probe, Rac-GTP probe, and F-actin probe with Zip RNAi. Corner brackets indicate nascent caps. Red brackets show ectopic folds. (G) Quantifications of signal ratios between nascent cap folds and ectopic folds in Zip RNAi embryos. Embryo values plotted.
Figure S9.
Figure S9.
Effects of Lat A and Arp3 RNAi on nascent cap F-actin. (A) Co-expressed PIP2 and F-actin probes at telophase 11 following control (DMSO) or Lat A injection. Corner brackets show similar nascent caps at 0 s. Arrows point to aggregated nascent cap PM in response to Lat A. The Lat A-induced PM aggregation coincided with F-actin loss (27–108 s). In control injections, the nascent cap PM domain expanded and increased in F-actin (26–104 s). Seen in 5/5 embryos for both control and Lat A injections. (B) F-actin probe with control or Arp3 RNAi. Corner brackets show planes of nascent cap folds (0 µm) and tubules (−0.9 µm) with lower F-actin in Arp3 RNAi. Arrows show F-actin at pseudocleavage furrows in control. F-actin-positive pseudocleavage furrows are minimal in Arp3 RNAi. Seen in 10/12 Arp3 RNAi embryos and 10/10 control RNAi embryos.
Figure 8.
Figure 8.
Effects of actin polymerization and Arp3 on nascent cap PM folds and tubules. (A) Coimaged PIP2 probe and Jupiter-GFP after injection of Lat A or carrier control (DMSO) from late anaphase 11 (0 s) into telophase 11. Corner brackets show nascent cap PM fold redistributions over time. (B) Quantification of nascent cap PM fold areas relative to anaphase 11 (0 s) into telophase 11 for embryos injected with a carrier (blue) or LatA (red). Embryo values plotted. (C) Coimaged PIP2 probe and Jupiter-GFP after injection of CK666 or control (CK689) from late anaphase 11 (0 s) into telophase 11. Corner brackets show nascent cap PM fold redistributions over time. (D) Quantification of nascent cap PM fold areas relative to anaphase 11 (0 s) into telophase 11 for embryos injected with CK689 control (blue) or CK666 (red). Embryo values plotted. (E) PIP2 probe in control and Arp3 RNAi embryos at telophase 11. Corner brackets show PM folds (0 µm) and PM tubules (−1.5 µm). Pink bracket shows abnormal PIP2 aggregation at pseudocleavage furrow in Arp3 RNAi. (F) Quantifications of nascent cap tubule numbers and depths in control and Arp3 RNAi embryos. Embryo values are plotted.
Figure 9.
Figure 9.
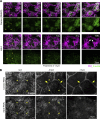
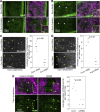
Localization of Rab8 and Sec15 to the nascent cap. (A and B) Telophase 11 dual live imaging of PIP2 probe with endogenously-expressed Rab8-YFP (A) or with overexpressed Sec15-GFP (B). Single sections at PM folds (0 µm) and tubules (−1.5 µm). Arrows, corner brackets, and magnified insets show nascent caps. Both patterns seen in 9/9 embryos. (C) Corner brackets show Rab8 puncta at telophase 11 nascent caps with control and Cnn RNAi. Rab8 detected as overexpressed Rab8-GFP. Quantifications of Rab8 puncta numbers per nascent cap are shown. Embryo values plotted. (D) Corner brackets show Rab8 puncta at telophase 11 nascent caps with control and Arp3 RNAi. Rab8 detected as over-expressed Rab8-GFP. Quantifications of Rab8 puncta numbers per nascent cap are shown. Embryo values plotted. (E) Imaging of PIP2 probe with endogenously-expressed Rab8-YFP at telophase 11 nascent caps with control CK689 and CK666 injection. Corner brackets show nascent caps. Quantifications of Rab8 puncta numbers per nascent cap are shown. Embryo values plotted.
Figure S10.
Figure S10.
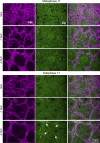
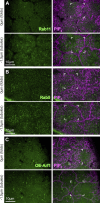
Localizations of Rab11, Rab5, and Arf1 in telophase 11 compartments. (A–C) Telophase 11 dual live imaging of PIP2 probe and internal membrane markers. Single sections at the level of PM folds (0 µm) and tubules (−1.5 µm) of nascent caps (corner brackets). Rab11 (A) and Rab5 (B) were detected as endogenously-expressed YFP-tagged proteins. Arf1 (C) was detected as an over-expressed GFP-tagged protein. Representative of 10/10, 9/9, and 5/5 embryos for Rab11, Rab5, and Arf1, respectively.

Similar articles

References

    1. Abreu-Blanco, M.T., Verboon J.M., and Parkhurst S.M.. 2014. Coordination of Rho family GTPase activities to orchestrate cytoskeleton responses during cell wound repair. Curr. Biol. 24:144–155. 10.1016/j.cub.2013.11.048 - DOI - PMC - PubMed
    1. Baldauf, L., Frey F., Arribas Perez M., Idema T., and Koenderink G.H.. 2023. Branched actin cortices reconstituted in vesicles sense membrane curvature. Biophys. J. 122:2311–2324. 10.1016/j.bpj.2023.02.018 - DOI - PMC - PubMed
    1. Blake-Hedges, C., and Megraw T.L.. 2019. Coordination of embryogenesis by the centrosome in Drosophila melanogaster. Results Probl. Cell Differ. 67:277–321. 10.1007/978-3-030-23173-6_12 - DOI - PubMed
    1. Bodor, D.L., Pönisch W., Endres R.G., and Paluch E.K.. 2020. Of cell shapes and motion: The physical basis of animal cell migration. Dev. Cell. 52:550–562. 10.1016/j.devcel.2020.02.013 - DOI - PubMed
    1. Britton, J.S., Lockwood W.K., Li L., Cohen S.M., and Edgar B.A.. 2002. Drosophila’s insulin/PI3-kinase pathway coordinates cellular metabolism with nutritional conditions. Dev. Cell. 2:239–249. 10.1016/S1534-5807(02)00117-X - DOI - PubMed

MeSH terms

LinkOut - more resources