

Digital Twin Smart City: Integrating IFC and CityGML with Semantic Graph for Advanced 3D City Model Visualization
- PMID: 38931546
- PMCID: PMC11207653
- DOI: 10.3390/s24123761
Digital Twin Smart City: Integrating IFC and CityGML with Semantic Graph for Advanced 3D City Model Visualization
Abstract
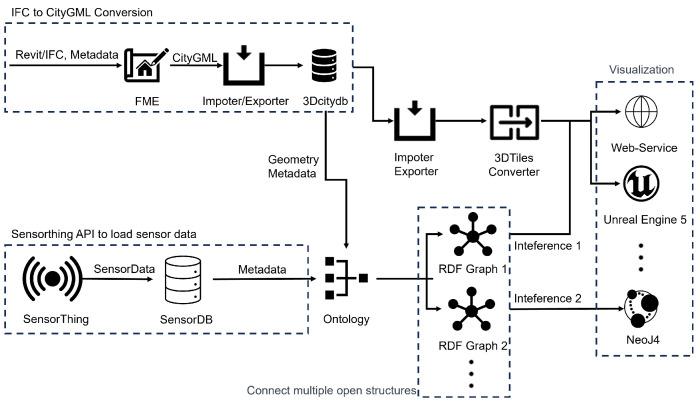
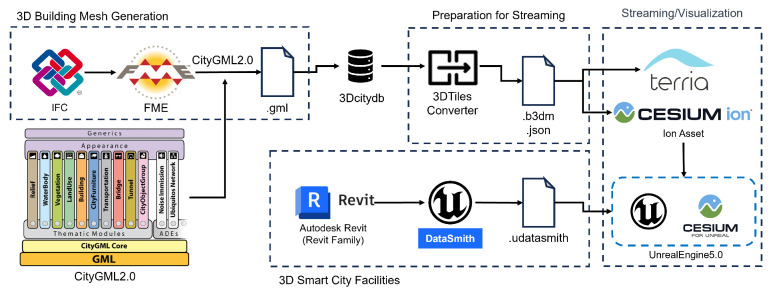
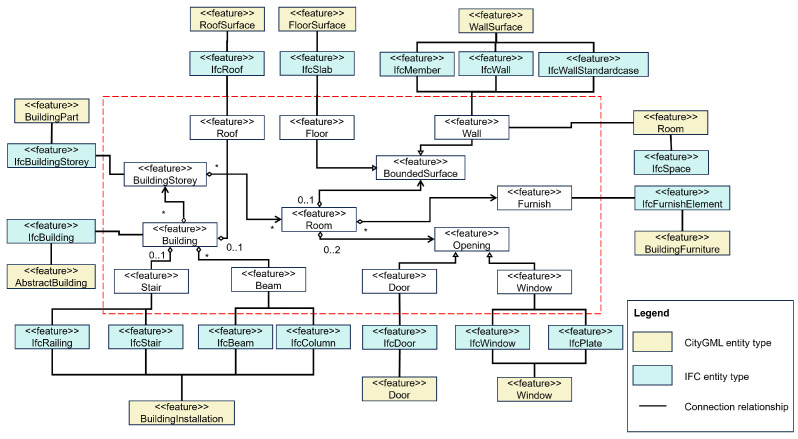
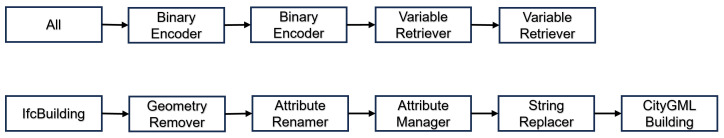
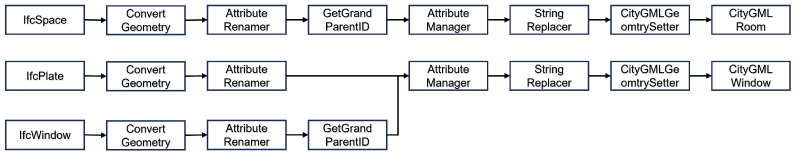
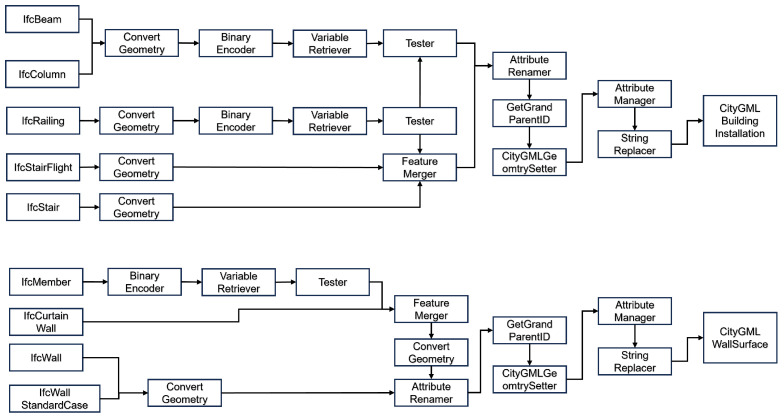
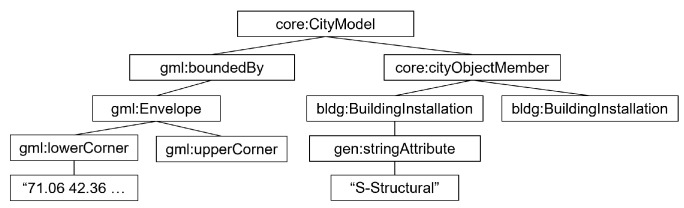
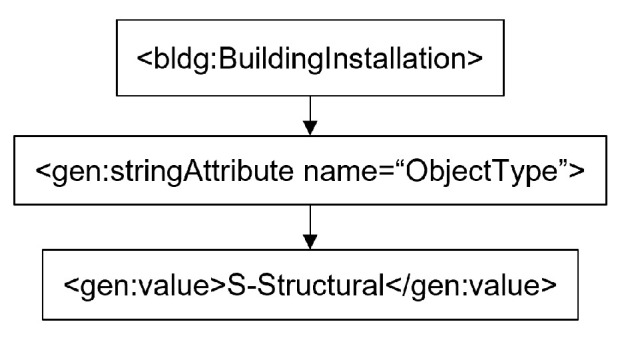
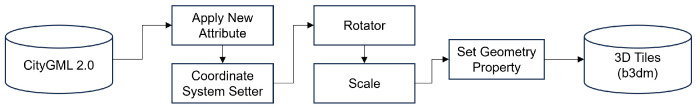
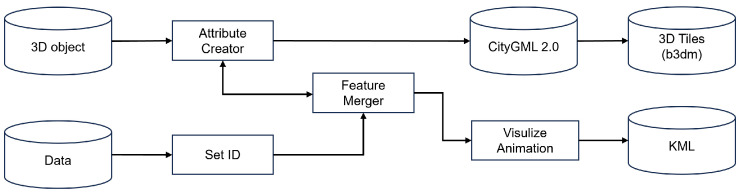
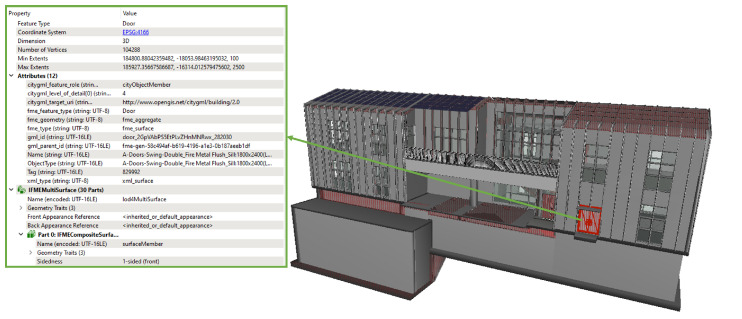
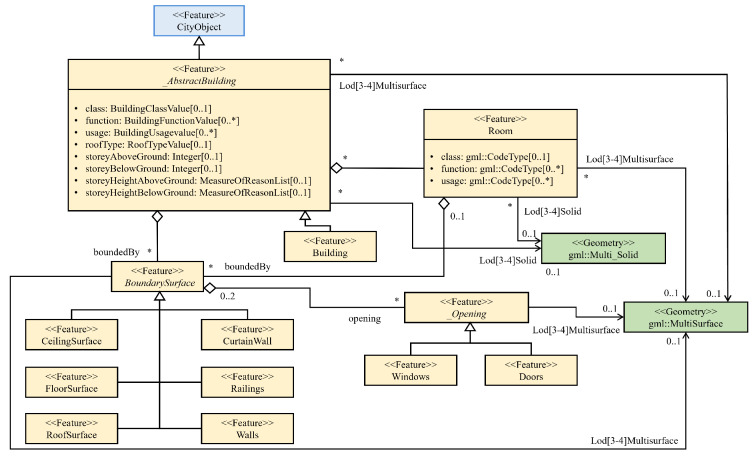
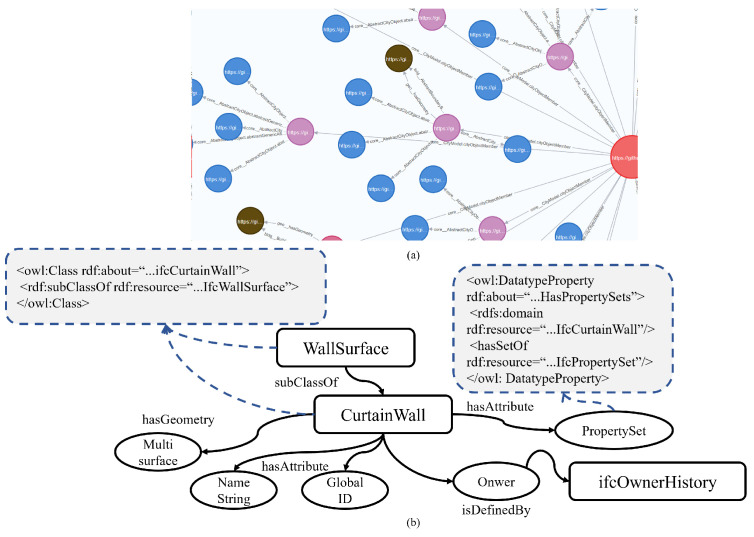
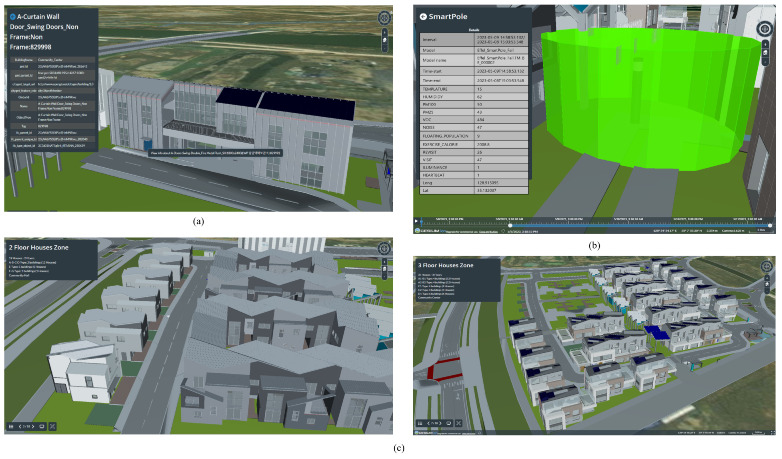
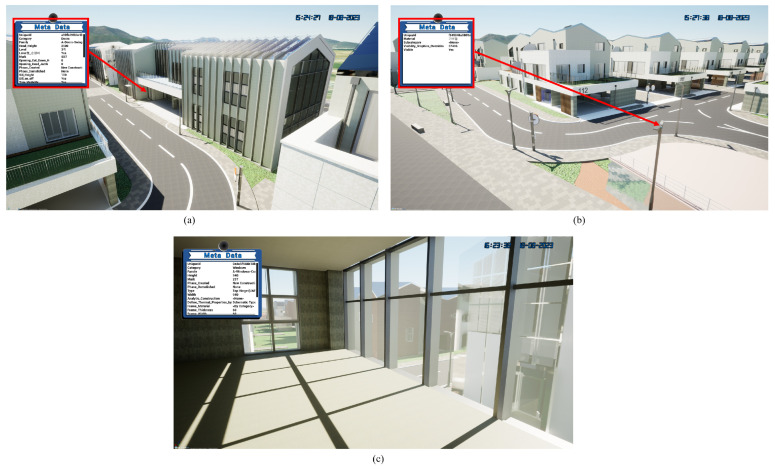
The growing interest in building data management, especially the building information model (BIM), has significantly influenced urban management, materials supply chain analysis, documentation, and storage. However, the integration of BIM into 3D GIS tools is becoming more common, showing progress beyond the traditional problem. To address this, this study proposes data transformation methods involving mapping between three domains: industry foundation classes (IFC), city geometry markup language (CityGML), and web ontology framework (OWL)/resource description framework (RDF). Initially, IFC data are converted to CityGML format using the feature manipulation engine (FME) at CityGML standard's levels of detail 4 (LOD4) to enhance BIM data interoperability. Subsequently, CityGML is converted to the OWL/RDF diagram format to validate the proposed BIM conversion process. To ensure integration between BIM and GIS, geometric data and information are visualized through Cesium Ion web services and Unreal Engine. Additionally, an RDF graph is applied to analyze the association between the semantic mapping of the CityGML standard, with Neo4j (a graph database management system) utilized for visualization. The study's results demonstrate that the proposed data transformation methods significantly improve the interoperability and visualization of 3D city models, facilitating better urban management and planning.
Keywords: 3D visualization; CityGML; building information model (BIM); digital twin; industry foundation classes (IFC); smart city.
Conflict of interest statement
The authors declare no conflicts of interest.
Figures


Similar articles
-
Dynamically loading IFC models on a web browser based on spatial semantic partitioning.Vis Comput Ind Biomed Art. 2019 Jun 3;2(1):4. doi: 10.1186/s42492-019-0011-z. Vis Comput Ind Biomed Art. 2019. PMID: 32240404 Free PMC article.
-
Using 3D CityGML for the Modeling of the Food Waste and Wastewater Generation-A Case Study for the City of Montréal.Front Big Data. 2021 Jun 22;4:662011. doi: 10.3389/fdata.2021.662011. eCollection 2021. Front Big Data. 2021. PMID: 34240049 Free PMC article.
-
CityGML urban model generation using national public datasets for flood damage simulations: A case study in Korea.J Environ Manage. 2021 Nov 1;297:113236. doi: 10.1016/j.jenvman.2021.113236. Epub 2021 Jul 22. J Environ Manage. 2021. PMID: 34303938
-
Electronic Health Record and Semantic Issues Using Fast Healthcare Interoperability Resources: Systematic Mapping Review.J Med Internet Res. 2024 Jan 30;26:e45209. doi: 10.2196/45209. J Med Internet Res. 2024. PMID: 38289660 Free PMC article. Review.
-
Implementation of linked data in the life sciences at BioHackathon 2011.J Biomed Semantics. 2015 Jan 7;6:3. doi: 10.1186/2041-1480-6-3. eCollection 2015. J Biomed Semantics. 2015. PMID: 25973165 Free PMC article. Review.
References
-
- Sester M. 3D Visualization and Generalization. Wichmann Verlag; Heidelberg, Germany: 2007.
-
- Lee J., Bagheri B., Kao H.A. A Cyber-Physical Systems architecture for Industry 4.0-based manufacturing systems. SME Manuf. Lett. 2014;3:18–23. doi: 10.1016/j.mfglet.2014.12.001. - DOI
-
- Tao F., Qi Q., Wang L., Nee A. Digital Twins and Cyber–Physical Systems toward Smart Manufacturing and Industry 4.0: Correlation and Comparison. Engineering. 2019;5:653–661. doi: 10.1016/j.eng.2019.01.014. - DOI
-
- Meijer A., Rodríguez Bolívar M.P. Governing the smart city: A review of the literature on smart urban governance. Int. Rev. Adm. Sci. 2016;82:392–408. doi: 10.1177/0020852314564308. - DOI
-
- Angel S., Parent J., Civco D., Blei A., Potere D. The Dimensions of Global Urban Expansion: Estimates and Projections for All Countries, 2000–2050. Prog. Plan. 2011;75:53–107. doi: 10.1016/j.progress.2011.04.001. - DOI
Grants and funding
LinkOut - more resources
Full Text Sources
