. 2024 Jun 19;17(6):805.
doi: 10.3390/ph17060805.

Sulfated Laminarin Polysaccharides Reduce the Adhesion of Nano-COM Crystals to Renal Epithelial Cells by Inhibiting Oxidative and Endoplasmic Reticulum Stress

Affiliations

Sulfated Laminarin Polysaccharides Reduce the Adhesion of Nano-COM Crystals to Renal Epithelial Cells by Inhibiting Oxidative and Endoplasmic Reticulum Stress

Tian-Qu He et al. Pharmaceuticals (Basel). .

Abstract

Purpose: Adhesion between calcium oxalate crystals and renal tubular epithelial cells is a vital cause of renal stone formation; however, the drugs that inhibit crystal adhesion and the mechanism of inhibition have yet to be explored. Methods: The cell injury model was constructed using nano-COM crystals, and changes in oxidative stress levels, endoplasmic reticulum (ER) stress levels, downstream p38 MAPK protein expression, apoptosis, adhesion protein osteopontin expression, and cell-crystal adhesion were examined in the presence of Laminarin polysaccharide (DLP) and sulfated DLP (SDLP) under protected and unprotected conditions. Results: Both DLP and SDLP inhibited nano-COM damage to human kidney proximal tubular epithelial cell (HK-2), increased cell viability, decreased ROS levels, reduced the opening of mitochondrial membrane permeability transition pore, markedly reduced ER Ca2+ ion concentration and adhesion molecule OPN expression, down-regulated the expression of ER stress signature proteins including CHOP, Caspase 12, and p38 MAPK, and decreased the apoptosis rate of cells. SDLP has a better protective effect on cells than DLP. Conclusions: SDLP protects HK-2 cells from nano-COM crystal-induced apoptosis by reducing oxidative and ER stress levels and their downstream factors, thereby reducing crystal-cell adhesion interactions and the risks of kidney stone formation.

Keywords: apoptosis; crystal adhesion; endoplasmic reticulum stress; sulfated polysaccharide.


Conflict of interest statement

The authors declare no conflict of interest.

Figures
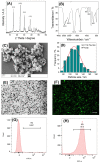
Figure 1
Figure 1
Characterization and fluorescence labeling of Nano-COM crystals. (A) XRD spectrum; (B) FT-IR spectrum; (C) SEM image; (D) average COM diameter from the analysis of (C) by Nano Measurer 1.2 software; (E,F) Nano-COM microscopy images before and after FITC labeling; scale bar: 100 μm; (G,H) fluorescence of Nano-COM before and after FITC labeling detected by flow cytometry.
Figure 2
Figure 2
Cytotoxic (A) and protective effect on HK-2 cells (B) of different concentrations of DLP and SDLP determined by CCK-8 method. NC: normal control group; DC: nano-COM crystal control group, crystal concentration: 200 μg/mL. Protection time: 24 h. Compared with DC group, * p < 0.05, ** p < 0.01.
Figure 3
Figure 3
Changes in ROS levels in HK-2 cells before and after protection by different concentrations of DLP and SDLP. (A) Fluorescence microscopy; (B) columnar quantitative graph. NC: normal control group; DC: nano-COM crystal damage group. DLP-10 and DLP-60 are polysaccharide protection groups, indicating polysaccharide concentrations of 10 μg/mL and 60 μg/mL, respectively. Crystal concentration: 200 μg/mL. Protection time: 24 h. Compared with DC group, ** p < 0.01.
Figure 4
Figure 4
Laser confocal microscopy observation of DLP and SDLP inhibiting nano-COM damage to HK-2 cells to reduce mPTP opening. (A) Laser confocal micrograph; (B) columnar quantitative graph. NC: normal control group; DC: nano-COM crystal damage group. DLP-10 and DLP-60 are polysaccharide protection groups, indicating polysaccharide concentrations of 10 μg/mL and 60 μg/mL, respectively. Crystal concentration: 200 μg/mL. Protection time: 24 h. Compared with DC group, * p < 0.05, ** p < 0.01 Scale bar: 20 µm.
Figure 5
Figure 5
Changes in ERS before and after protection of HK-2 cells by different concentrations of DLP and SDLP. (A) Fluorescence micrograph; (B) column quantitative graph. The blue fluorescence indicates the nucleus, red fluorescence indicates the endoplasmic reticulum (ER), and green fluorescence indicates the calcium ion concentration in the endoplasmic reticulum (ER Ca2+). NC: normal control group; DC: nano-COM crystal damage group. DLP-10 and DLP-60 are polysaccharide protection groups, indicating polysaccharide concentrations of 10 μg/mL and 60 μg/mL, respectively. Crystal concentration: 200 μg/mL. Protection time: 24 h. Compared with DC group, * p < 0.05, ** p < 0.01. Scale bar: 20 µm.
Figure 6
Figure 6
Changes in CHOP expression levels before and after protection of HK-2 cells by different concentrations of DLP and SDLP. (A) Fluorescence micrographs; (B) quantitative bar graphs. Blue fluorescence indicates nucleus and red fluorescence indicates CHOP. NC: normal control group; DC: nano-COM crystal damage group. DLP-10 and DLP-60 are polysaccharide protection groups, indicating polysaccharide concentrations of 10 μg/mL and 60 μg/mL, respectively. Crystal concentration: 200 μg/mL. Protection time: 24 h. Scale bar: 20 µm. Compared with DC group, ** p < 0.01.
Figure 7
Figure 7
Changes in Caspase 12 expression levels before and after protection of HK-2 cells by different concentrations of DLP and SDLP. (A) Qualitative fluorescence plot; (B) quantitative bar graph. The blue fluorescence indicates the nucleus and the green fluorescence indicates Caspase 12. NC: normal control group; DC: nano-COM crystal damage group. DLP-10 and DLP-60 are polysaccharide protection groups, indicating polysaccharide concentrations of 10 μg/mL and 60 μg/mL, respectively. Crystal concentration: 200 μg/mL. Protection time: 24 h. Scale bar: 20 µm. Compared with DC group, ** p < 0.01.
Figure 8
Figure 8
Changes in P-p38 expression levels before and after protection of HK-2 cells by different concentrations of DLP and SDLP. (A) Fluorescence micrographs; (B) quantitative bar graphs. The blue fluorescence indicates the nucleus and the green fluorescence indicates P-p38. NC: normal control group; DC: nano-COM crystal damage group. DLP-10 and DLP-60 are polysaccharide protection groups, indicating polysaccharide concentrations of 10 μg/mL and 60 μg/mL, respectively. Crystal concentration: 200 μg/mL. Protection time: 24 h. Scale bar: 20 µm. Compared with DC group, * p < 0.05. ** p < 0.01.
Figure 9
Figure 9
Changes in apoptosis/necrosis before and after protection of HK-2 cells by different concentrations of DLP and SDLP. (A) Qualitative assay; (B) flow-through quantitative histogram; (C) flow-through quantitative histogram. NC: normal control group; DC: nano-COM crystal damage group. DLP-10 and DLP-60 are polysaccharide protection groups, indicating polysaccharide concentrations of 10 μg/mL and 60 μg/mL, respectively. Crystal concentration: 200 μg/mL. Protection time: 24 h. Compared with DC group, ** p < 0.01.
Figure 10
Figure 10
Changes in OPN expression levels before and after protection of HK-2 cells by different concentrations of DLP and SDLP. (A) Qualitative fluorescence plot; (B) quantitative bar graph. The blue fluorescence indicates the nucleus and the green fluorescence indicates OPN. NC: normal control group; DC: nano-COM crystal damage group. DLP-10 and DLP-60 are polysaccharide protection groups, indicating polysaccharide concentrations of 10 μg/mL and 60 μg/mL, respectively. Crystal concentration: 200 μg/mL. Protection time: 24 h. Compared with DC group, * p < 0.05, ** p < 0.01. Scale bar: 20 µm.
Figure 11
Figure 11
Changes in crystal adhesion on the cell surface before and after polysaccharide protection by laser confocal microscopy. The blue fluorescence is the DAPI-stained nucleus; the green fluorescence is the FITC-labeled nano-COM crystals; the red fluorescence is the DiI-stained cell membrane. NC: normal control group; DC: nano-COM crystal damage group. DLP-10 and DLP-60 are polysaccharide protection groups, indicating polysaccharide concentrations of 10 μg/mL and 60 μg/mL, respectively. Crystal concentration: 200 μg/mL. Protection time: 24 h. Scale bar: 20 µm.
Figure 12
Figure 12
Changes in crystal adhesion on the surface of HK-2 cells before and after protection by different concentrations of DLP and SDLP. (A) Flow histogram; (B) quantitative bar graph. NC: normal control group; DC: nano-COM crystal damage group. DLP-10 and DLP-60 are polysaccharide protection groups, indicating polysaccharide concentrations of 10 μg/mL and 60 μg/mL, respectively. Crystal concentration: 200 μg/mL. Protection time: 24 h. Compared with DC group, * p < 0.05, ** p < 0.01.

Similar articles

References

    1. Szarka A., Lőrincz T., Hajdinák P. Friend or Foe: The relativity of (anti) oxidative agents and pathways. Int. J. Mol. Sci. 2022;23:5188. doi: 10.3390/ijms23095188. - DOI - PMC - PubMed
    1. Bao B., Liu H., Han Y., Xu L., Xing W., Li Z. Simultaneous elimination of reactive oxygen species and activation of Nrf2 by ultrasmall nanoparticles to relieve acute kidney injury. ACS Appl. Mater. Interfaces. 2023;15:16460–16470. doi: 10.1021/acsami.3c00052. - DOI - PubMed
    1. Ho H.J., Shirakawa H. Oxidative stress and mitochondrial dysfunction in chronic kidney disease. Cells. 2022;12:88. doi: 10.3390/cells12010088. - DOI - PMC - PubMed
    1. Sun Y., Kang J., Guan X., Xu H., Wang X., Deng Y. Regulation of endoplasmic reticulum stress on the damage and apoptosis of renal tubular epithelial cells induced by calcium oxalate crystals. Urolithiasis. 2021;49:291–299. doi: 10.1007/s00240-021-01261-7. - DOI - PubMed
    1. Li X., Chen S., Feng D., Fu Y., Wu H., Lu J., Bao J. Calcium-sensing receptor promotes calcium oxalate crystal adhesion and renal injury in Wistar rats by promoting ROS production and subsequent regulation of PS ectropion, OPN, KIM-1, and ERK expression. Ren. Fail. 2021;43:465–476. doi: 10.1080/0886022X.2021.1881554. - DOI - PMC - PubMed