. 2024 Jun 11;25(12):6417.
doi: 10.3390/ijms25126417.

Chlorogenic Acid and Cinnamaldehyde in Combination Inhibit Metastatic Traits and Induce Apoptosis via Akt Downregulation in Breast Cancer Cells

Affiliations

Chlorogenic Acid and Cinnamaldehyde in Combination Inhibit Metastatic Traits and Induce Apoptosis via Akt Downregulation in Breast Cancer Cells

Yusuff Olayiwola et al. Int J Mol Sci. .

Abstract

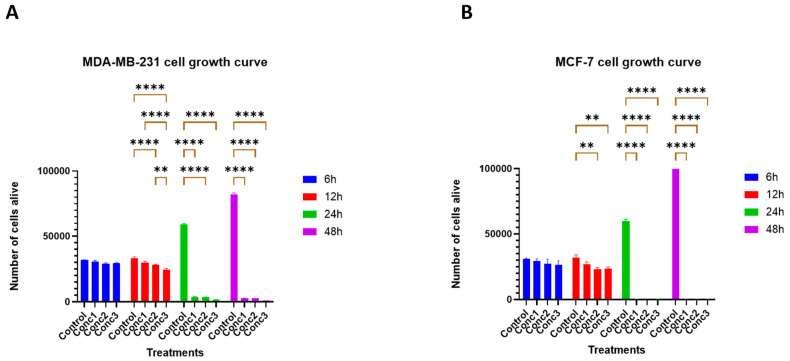
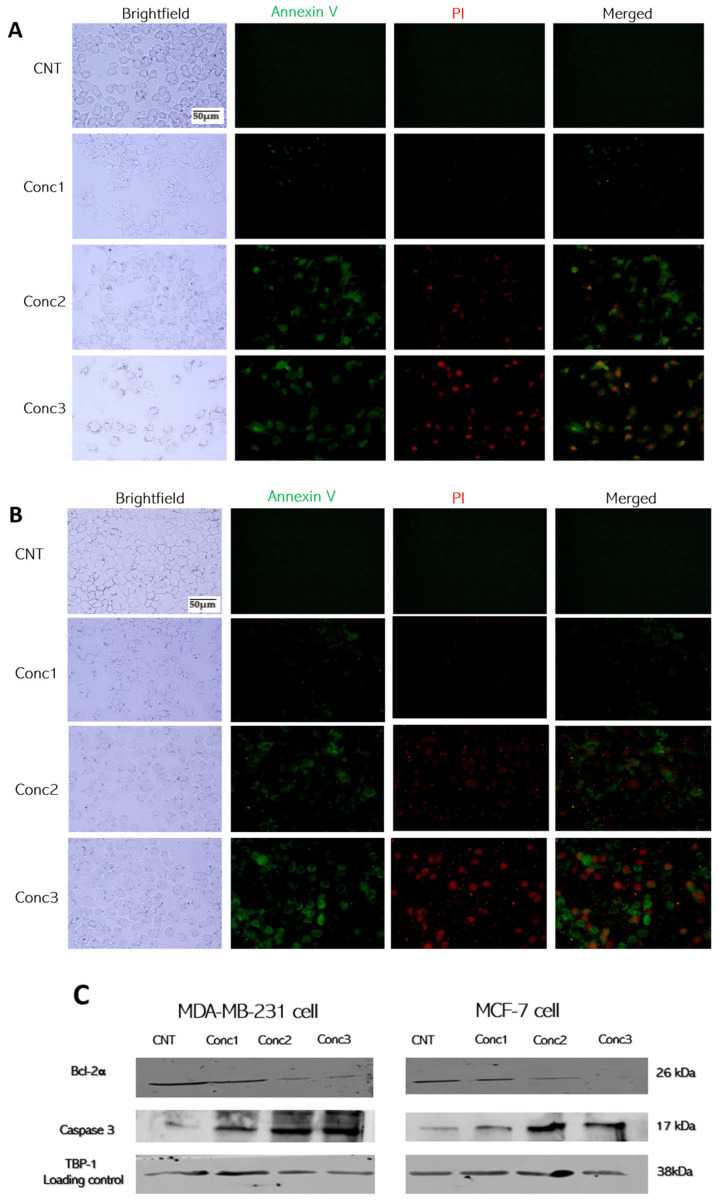
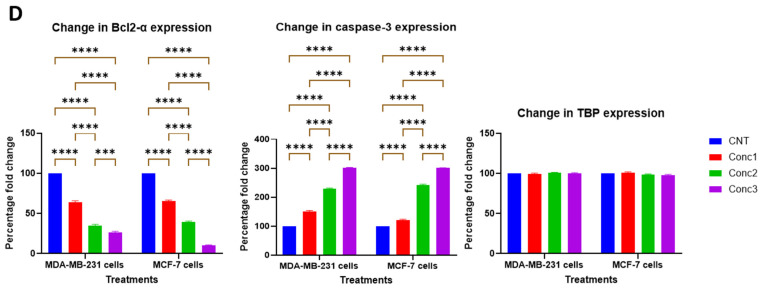
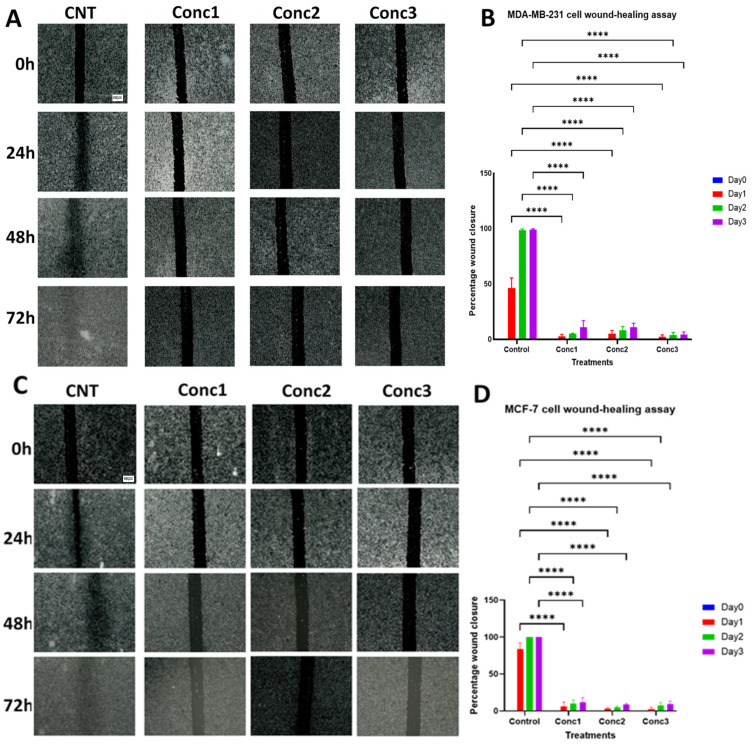
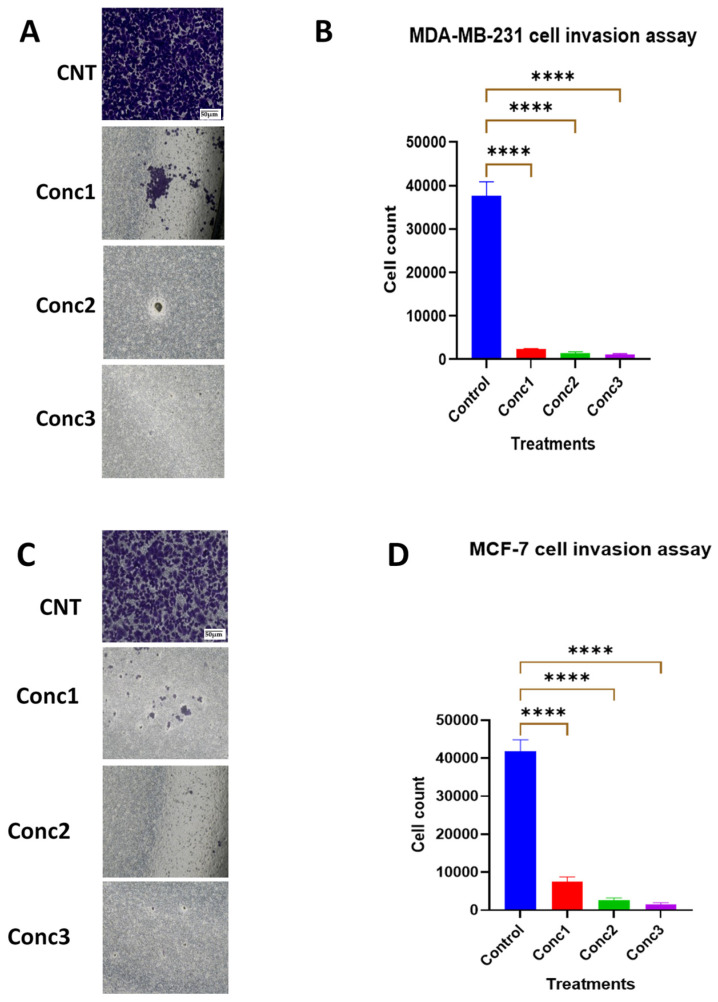
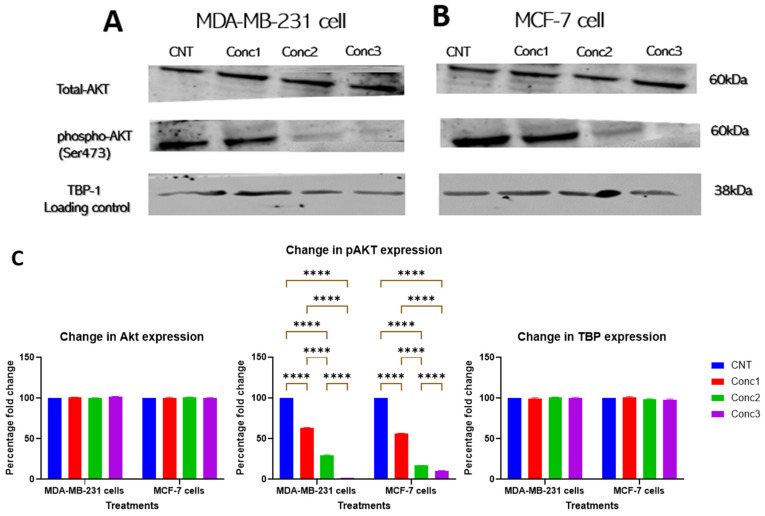
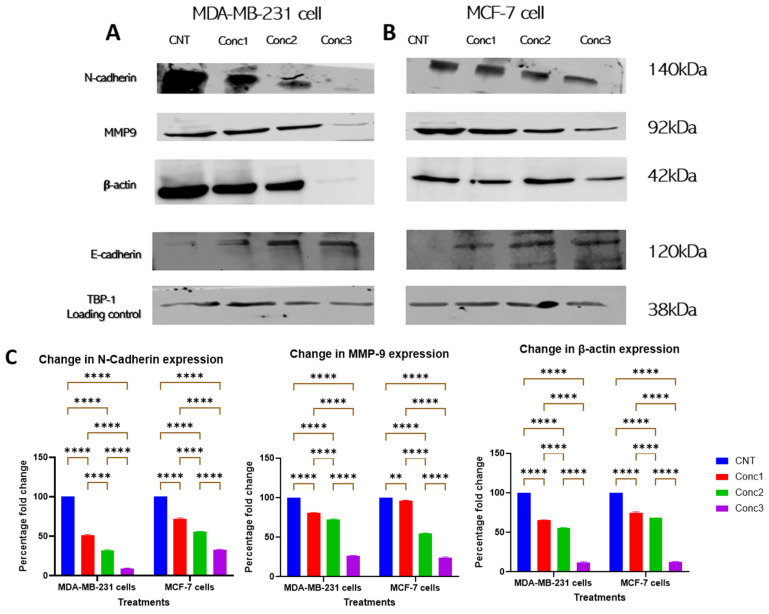
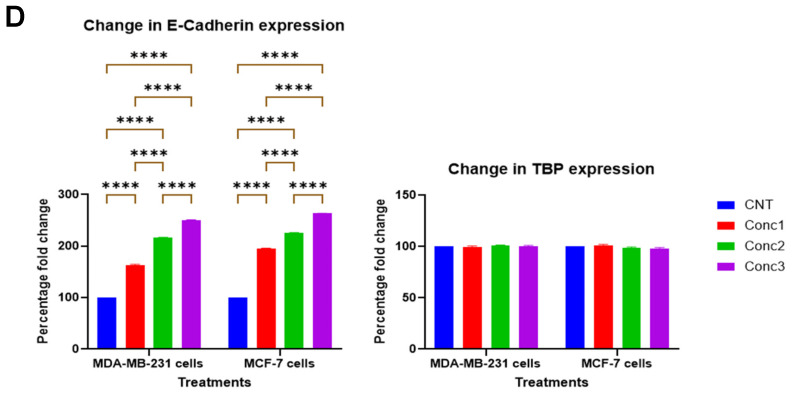
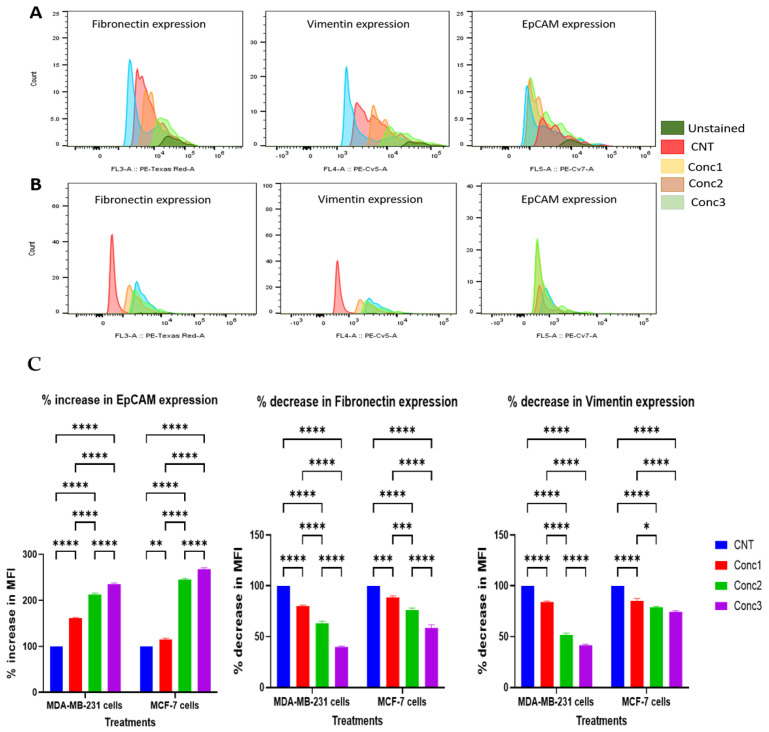
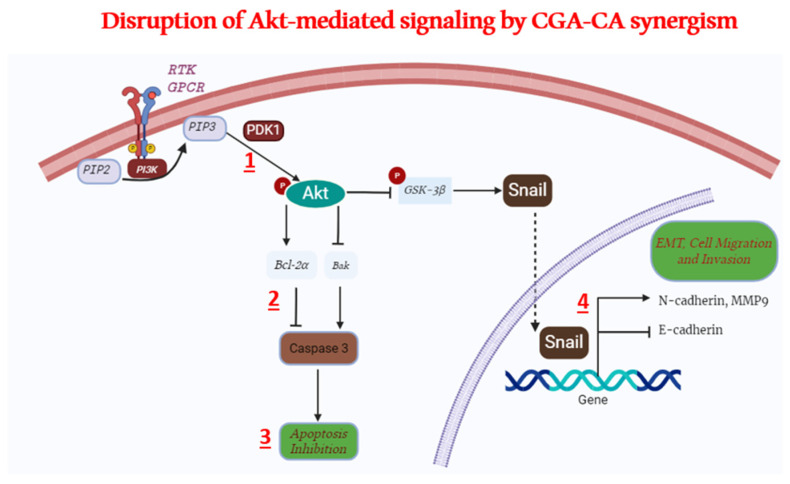
Most reported breast cancer-associated deaths are directly correlated with metastatic disease. Additionally, the primary goal of treating metastatic breast cancer is to prolong life. Thus, there remains the need for more effective and safer strategies to treat metastatic breast cancer. Recently, more attention has been given to natural products (or phytochemicals) as potential anticancer treatments. This study aimed to investigate the synergistic effects of the combination of the phytochemicals chlorogenic acid and cinnamaldehyde (CGA and CA) toward inhibiting metastasis. The hypothesis was that CGA and CA in combination decrease the metastatic potential of breast cancer cells by inhibiting their invasive and migratory abilities as well as the induction of apoptosis via the downregulation of the Akt, disrupting its signal transduction pathway. To test this, wound-healing and Transwell™ Matrigel™ assays were conducted to assess changes in the migration and invasion properties of the cells; apoptosis was analyzed by fluorescence microscopy for Annexin V/propidium iodide; and immunoblotting and FACSort were performed on markers for the epithelial-to-mesenchymal transition status. The results show that CGA and CA significantly downregulated Akt activation by inhibiting phosphorylation. Consequently, increased caspase 3 and decreased Bcl2-α levels were observed, and apoptosis was confirmed. The inhibition of metastatic behavior was demonstrated by the attenuation of N-cadherin, fibronectin, vimentin, and MMP-9 expressions with concomitant increased expressions of E-cadherin and EpCAM. In summary, the present study demonstrated that CGA and CA in combination downregulated Akt activation, inhibited the metastatic potential, and induced apoptosis in different breast cancer cell lines.

Keywords: breast cancer; chlorogenic acid; cinnamaldehyde; metastasis; natural products; phytochemicals.


Conflict of interest statement

The authors declare no conflicts of interest.

Figures

Figure 1
Figure 1
Anti-proliferative effects of CGA–CA combinations on (A) MDA MB-231 cells and (B) MCF-7 cells. Starting at 12 h, the CGA–CA combinations demonstrated significant anti-proliferative effects on both MDA-MB 231 and MCF-7 cells. Each bar represents the mean ± SEM of three biological replicates (n = 3). ** = p < 0.01, and **** = p < 0.0001, with p-value > 0.05 considered statistically nonsignificant (ns) and not indicated on the graph to reduce clutter.
Figure 2
Figure 2
Apoptotic percentages in MDA-MB-231 and MCF-7 breast cancer cells induced by CGA–CA mixtures. Fluorescence microscopy analysis of annexin V and propidium iodide-stained (A) MDA-MB-231 and (B) MCF-7 cells. Representative fluorescence microscopy images of FITC-conjugated annexin V (green) and PI (red) double-fluorescence staining showing MDA-MB-231 and MCF-7 breast cancer cell apoptosis after treatment with three different concentrations of CGA–CA. All images processed under same conditions. Scale bar = 50 μm (C) Western blot showing the changes in expressions of caspase 3 and Bcl-2α in cells treated with varied concentrations of CGA–CA. TBP = loading control. (D) Quantitative representation of the expression levels of each of the proteins from (C). The results of three different biological replicates are expressed as means ± SEM. Image processing was performed using ImageJ software (version v1.54i). The statistical significance between the CGA–CA-treated groups and the control group for both cell lines was measured using one-way ANOVA followed by Tukey’s post hoc test for multiple comparisons. *** = p < 0.001, and **** = p < 0.0001. Statistically nonsignificant results are not included in the graphs to avoid clutter.
Figure 2
Figure 2
Apoptotic percentages in MDA-MB-231 and MCF-7 breast cancer cells induced by CGA–CA mixtures. Fluorescence microscopy analysis of annexin V and propidium iodide-stained (A) MDA-MB-231 and (B) MCF-7 cells. Representative fluorescence microscopy images of FITC-conjugated annexin V (green) and PI (red) double-fluorescence staining showing MDA-MB-231 and MCF-7 breast cancer cell apoptosis after treatment with three different concentrations of CGA–CA. All images processed under same conditions. Scale bar = 50 μm (C) Western blot showing the changes in expressions of caspase 3 and Bcl-2α in cells treated with varied concentrations of CGA–CA. TBP = loading control. (D) Quantitative representation of the expression levels of each of the proteins from (C). The results of three different biological replicates are expressed as means ± SEM. Image processing was performed using ImageJ software (version v1.54i). The statistical significance between the CGA–CA-treated groups and the control group for both cell lines was measured using one-way ANOVA followed by Tukey’s post hoc test for multiple comparisons. *** = p < 0.001, and **** = p < 0.0001. Statistically nonsignificant results are not included in the graphs to avoid clutter.
Figure 3
Figure 3
Wound-healing assay to assess anti-migration impact of CGA–CA on MDA-MB-231 and MCF-7 cells. (A,C) are representative photomicrograph images (scale bar = 100 μm; 4× mag) of wound-healing assays of MDA-MB-231 and MCF-7 cells, respectively, at 0 h, 24 h, 48 h, and 72 h. Images were processed with ImageJ software (version v1.54i). (B,D) are summary bar charts of the percentage of wound closure in both MDA-MB-231 and MCF-7 cells treated with three different doses of CGA–CA at 0 h, 24 h, 48 h, and 72 h, respectively. Three different biological replicates are expressed as means ± SEM of the percentage of wound closure. The statistical significance for the wound closure among the CGA–CA-treated cells in comparison with the untreated cells over time, for each cell line, was measured using one-way ANOVA, followed by Tukey’s post hoc test for multiple comparisons. **** = p < 0.0001. Statistically nonsignificant results are not indicated in the graphs to reduce clutter.
Figure 4
Figure 4
Transwell™ Matrigel™ invasion assay to assess anti-invasion capability of CA–CGA in MDA-MB-231 and MCF-7 breast cancer cell lines. (A) and (C) are representative photomicrographs of (scale bar = 50 μm, 10× mag) of MDA-MB-231 and MCF-7 breast cancer cells, respectively, via the Transwell™ Matrigel™ matrix. Cells were stained with crystal violet. (B,D) are bar graphs of the number of invasive cells in each group treated with three different doses of CGA–CA. Analysis of the invasive cells was carried out by acetic acid quantification method. The results of three different biological replicates are expressed as means ± SEM of the invasive cells. The statistical significance for the number of invading cells among the CGA–CA-treated groups in comparison with the control group for both cell lines was measured using one-way ANOVA, followed by Tukey’s post hoc test for multiple comparisons. **** = p < 0.0001. Statistically nonsignificant results are not included in the graphs to avoid clutter.
Figure 5
Figure 5
Akt activation was inhibited by CGA–CA in both MDA-MB-231 and MCF-7 cell lines. Western blotting shows the decreased levels of phosphorylated Akt in (A) MDA-MB-231 and (B) MCF-7 cells treated with CGA–CA. (C) Quantitative analysis of the expression levels of each of the proteins. TBP = internal loading control. The results of three different biological replicates are expressed as means ± SEM. The statistical significance between the groups for both cell lines was measured using one-way ANOVA, followed by Tukey’s post hoc test for multiple comparisons. **** = p < 0.0001. Statistically nonsignificant results are not included in the graphs to avoid clutter.
Figure 6
Figure 6
The impacts of CGA–CA treatments on expressions of proteins associated with epithelial-to-mesenchymal transition (EMT). Expression levels of EMT-associated proteins are shown in (A) MDA-MB-231 breast cancer cells and (B) MCF-7 breast cancer cells. (C) Quantitative results for the expression levels of each of the proteins associated with EMT. (D) Quantitative results for the expression levels of adhesion protein E-cadherin and loading control TBP. The results of three different biological replicates are expressed as means ± SEM. The statistical significance between the groups for both cell lines was measured using one-way ANOVA, followed by Tukey’s post hoc test for multiple comparisons. ** = p < 0.01, and **** = p < 0.0001. Statistically nonsignificant results are not included in the graphs to avoid clutter.
Figure 6
Figure 6
The impacts of CGA–CA treatments on expressions of proteins associated with epithelial-to-mesenchymal transition (EMT). Expression levels of EMT-associated proteins are shown in (A) MDA-MB-231 breast cancer cells and (B) MCF-7 breast cancer cells. (C) Quantitative results for the expression levels of each of the proteins associated with EMT. (D) Quantitative results for the expression levels of adhesion protein E-cadherin and loading control TBP. The results of three different biological replicates are expressed as means ± SEM. The statistical significance between the groups for both cell lines was measured using one-way ANOVA, followed by Tukey’s post hoc test for multiple comparisons. ** = p < 0.01, and **** = p < 0.0001. Statistically nonsignificant results are not included in the graphs to avoid clutter.
Figure 7
Figure 7
Summary results of EMT biomarkers fibronectin, vimentin, and EpCAM analyzed by flow cytometry. The flow cytometry data output was processed and analyzed with the FlowJo software (version V10.8.1). (A) MDA-MB-231 cells. (B) MCF-7 cells. Fibronectin and vimentin expression levels decreased in a dose-dependent manner with increasing CGA–CA treatment concentrations, while EpCAM expression increased in comparison with control breast cancer cells. (C) Quantitative results of the expressions of the proteins in both MDA-MB-231 and MCF-7 cells as a function of mean fluorescence intensity (MFI) of each cell expressing fibronectin, vimentin, and EpCAM. Expression levels were determined using FlowJo software (version v10.8.1) and fold changes in MFI, which corresponded to the expression levels of the proteins, calculated and expressed as percentages. The results of three different biological replicates are expressed as means ± SEM. The statistical significance of the percentage change in MFI among the CGA–CA-treated groups in comparison with the control group for both cell lines was measured using one-way ANOVA followed by Tukey’s post hoc test for multiple comparisons. * = p < 0.05, ** = p < 0.01, *** = p < 0.001, and **** = p < 0.0001. Statistically nonsignificant results are not indicated in the graphs to reduce clutter.
Figure 8
Figure 8
Effects of chlorogenic acid and cinnamaldehyde synergism on Akt-mediated signaling pathway downstream target proteins. Addition of CGA–CA inhibits phosphorylation of Akt (1) and inhibits expression of Bcl-2α (2), allowing induction of apoptosis via caspase 3 upregulation (3). Concurrently, inhibition of Akt phosphorylation affects N-cadherin and MMP9 expression (presumably by inhibiting SNAIL), causing upregulation of E-cadherin (4), and ultimately decreasing invasion and migration in breast cancer cells.

Similar articles

References

    1. Arnold M., Morgan E., Rumgay H., Mafra A., Singh D., Laversanne M., Vignat J., Gralow J.R., Cardoso F., Siesling S. Current and future burden of breast cancer: Global statistics for 2020 and 2040. Breast. 2022;66:15–23. doi: 10.1016/j.breast.2022.08.010. - DOI - PMC - PubMed
    1. Courtney D., Davey M.G., Moloney B.M., Barry M.K., Sweeney K., McLaughlin R.P., Malone C.M., Lowery A.J., Kerin M.J. Breast cancer recurrence: Factors impacting occurrence and survival. Ir. J. Med. Sci. 2022;191:2501–2510. doi: 10.1007/s11845-022-02926-x. - DOI - PMC - PubMed
    1. Welch D.R., Hurst D.R. Defining the hallmarks of metastasis. Cancer Res. 2019;79:3011–3027. doi: 10.1158/0008-5472.CAN-19-0458. - DOI - PMC - PubMed
    1. Finger E.C., Giaccia A.J. Hypoxia, inflammation, and the tumor microenvironment in metastatic disease. Cancer Metastasis Rev. 2010;29:285–293. doi: 10.1007/s10555-010-9224-5. - DOI - PMC - PubMed
    1. Wells A., Grahovac J., Wheeler S., Ma B., Lauffenburger D. Targeting tumor cell motility as a strategy against invasion and metastasis. Trends Pharmacol. Sci. 2013;34:283–289. doi: 10.1016/j.tips.2013.03.001. - DOI - PMC - PubMed

MeSH terms